LOW ENERGY PROTON CAPTURE STUDY OF THE 14N(p, γ)15O REACTION
Stephen Michael Daigle
A dissertation submitted to the faculty at the University of North Carolina at Chapel Hill in partial fulfillment of the requirements for the degree of Doctor of Philosophy in the Depart-ment of Physics and Astronomy.
Chapel Hill 2013
Approved by:
Arthur E. Champagne Gerald Cecil
c 2013
ABSTRACT
Stephen Michael Daigle: Low Energy Proton Capture Study of the14N(p, γ)15O Reaction. (Under the direction of Arthur E. Champagne.)
The 14N(p, γ)15O reaction regulates the rate of energy production for stars slightly more massive than the sun throughout stable hydrogen burning on the main sequence. The 14N(p, γ)15O reaction rate also determines the luminosity for all stars after leaving the main sequence when their cores have exhausted hydrogen fuel, and later when they become red giant stars. The significant role that this reaction plays in stellar evolution has far-reaching consequences, from neutrino production in our Sun, to age estimates of globular clusters in our Galaxy. The weak cross section and inherent coincidence summing in the15Oγ-ray de-cay scheme make a precision measurement of the astrophysicalS-factor especially challenging, particularly for the ground-state transition.
Dedicated to the most influential teachers in my life –
ACKNOWLEDGMENTS
This work was made possible with the generous assistance of my advisors, colleagues, family, and friends. I am extremely grateful for having Art Champagne as my advisor and it has been a privilege to work for him throughout graduate school. When I met with Art during my visit as a prospective student, our conversation solidified my interest in experimental nuclear astrophysics, and in the end, was the reason I came to UNC. He not only had the remarkable foresight in steering this work to its completion, but his approach as an advisor allowed me to explore many aspects of this project on my own. Art always made time to work on the accelerators and meet with me whenever I had questions. He has been an exceptional advisor and professor and I can not thank him enough for his support throughout this project. I also consider myself very fortunate to have had the opportunity of working closely with Christian Iliadis. Christian has been an outstanding professor and mentor and I have learned a tremendous amount about γ-ray detectors and data analysis from our many interesting conversations. I thank Christian for the variety of research projects I was able to participate in over the years that enriched my graduate school experience. Both Art and Christian have also been very helpful in the development of my research presentation skills and I am grateful for their example and invaluable advice.
I would like to thank Reyco Henning, Gerald Cecil, and Jon Engel for their service on my dissertation committee and for their helpful input. Reyco provided much useful advice throughout the project and helped in revising this dissertation. He also gave me the chance to explore underground nuclear physics early on in graduate school. During this time, I had the opportunity to work at the Kimballton underground research facility with Paddy Finnerty. Paddy helped make the experience very enjoyable and one that I will never forget.
a second family to me. Senior students Peter Bertone, Joe Newton, and Rich Longland, were incredible as they helped me learn the ropes of operating the proton accelerators and γ-ray detectors. I am especially thankful for all of our great conversations and afternoon pints. I also would like to thank Rich for his significant contribution to the Monte Carlo simulation and for assisting with geant4. I am grateful to postdoctoral physicists Anne
Sallaska and Chris Howard for providing useful suggestions during the experiment. Chris always made time to help me withroot and shared his expertise in data analysis. Thanks
to Lori Downen for her assistance in maintaining the ion implanter during the summer prior to the experiment. I also thank Matt Buckner and Keegan Kelly for their crucial role in operating the proton accelerators while I collected data. The experiment would not have gone as smoothly if it had not been for their hard work, determination, and espresso-fueled accelerator shifts. Johnny Cesaratto was also essential in keeping the lab running and for upgrading the electron cyclotron resonance ion source which was used for part of this work. In addition, Johnny was my roommate for 5 years, the best man at my wedding, and remains a very close friend. He certainly helped me get through graduate school in one piece, and I look back on that difficult first year with fondness because of him.
My dissertation project would not have been complete without a small portion of time spent in the laboratory doing manual labor. On several occasions, I participated in stacking hundreds of lead bricks or numerous concrete blocks that would serve as shielding for γ-ray detectors. Those days reminded me of the undergraduate summer and winter breaks I spent as a laborer for L. Stewart Homes, Inc., a general contractor in Beaver Falls, Pennsylvania. I am thankful for the time spent building foundations for houses and hauling concrete blocks with my good friend Josh Stewart, as it taught me to be industrious and kept me motivated to finish graduate school.
technical staff, especially Chris Westerfeldt, John Dunham, Richard O’Quinn, and Patrick Mulkey for their assistance in LENA. It was always a relief having experienced technicians that we could turn to when lab equipment seemed beyond repair. I also want to thank Bret Carlin and Alex Crowell for helping me with everything computer related. I can not count the number of times Bret and Alex came to the rescue when one of the many computers I relied on had crashed.
I am very fortunate to have had unwavering support from my family and friends who were willing to travel to Chapel Hill on numerous occasions. Longtime friends Adam McClarey, Brian Shoemaker, and Ty Burin have always been there for me and continue to show genuine interest in my physics research. I thank them for our amazing friendships, the many beach trips we shared, and also for providing some much needed comic relief in what would have otherwise been a very stressful few years. I would also like to thank my brother Bernie Daigle and his fianc´e Patty Lee, and my brothers Jon Daigle and Andrew Daigle. They have been constant sources of support for me during graduate school and throughout life.
TABLE OF CONTENTS
LIST OF TABLES . . . xi
LIST OF FIGURES . . . xii
1 INTRODUCTION . . . 1
1.1 Astrophysical Motivation . . . 1
1.1.1 Proton-proton Chain . . . 1
1.1.2 CN Cycle . . . 3
1.1.3 Solar Metallicity . . . 5
1.1.4 Globular Cluster Ages . . . 9
1.2 Nuclear Reactions . . . 14
1.2.1 Nonresonant Cross Sections . . . 16
1.2.2 Resonant Cross Sections . . . 19
1.2.3 Astrophysical S-factor and Reaction Rates . . . 21
1.3 Previous Measurements . . . 26
1.3.1 Coincidence Summing Considerations . . . 29
1.4 The Project Goals . . . 33
2 ACCELERATOR AND DETECTOR . . . 34
2.1 The Laboratory for Experimental Nuclear Astrophysics . . . 34
2.2 JN Van de Graaff Accelerator . . . 34
2.3 Target Chamber . . . 37
2.4 APEX Trigger Detector . . . 38
2.4.1 Assembly . . . 41
2.4.3 Electronics Setup . . . 56
2.4.4 Monte Carlo Simulation . . . 60
3 TARGETS . . . 63
3.1 Introduction. . . 63
3.2 Target Backing Preparation . . . 63
3.2.1 Wet Etching . . . 65
3.2.2 Resistive Heating . . . 66
3.3 Implanted Targets . . . 66
3.3.1 Eaton NV-3206 Ion Implanter . . . 67
3.3.2 Dose Calculations . . . 69
3.3.3 Implantation of Nitrogen-14 . . . 70
3.4 Gas Nitrided Targets . . . 71
3.5 Target Composition . . . 72
3.6 Target Profiles . . . 76
4 MEASURING THE14N(p, γ)15OS-FACTOR . . . . 80
4.1 Experimental Procedures . . . 80
4.1.1 Energy Calibration . . . 81
4.1.2 Detector Efficiency . . . 84
4.2 Run Time Summary . . . 86
4.3 Data Reduction . . . 87
4.4 Analysis and Results . . . 90
4.4.1 Fraction Fitter . . . 90
4.4.2 Effective Energy . . . 94
4.4.3 Analysis of 180 keV Data . . . 95
4.4.4 5.18, 6.18, and 6.79 MeV Transitions . . . 97
4.4.5 The Ground-state Transition . . . 101
4.5 Summary and Discussion . . . 108
4.5.1 Relative Uncertainty . . . 109
5 MEASURING ANGULAR CORRELATIONS. . . 113
5.1 Experimental Procedures . . . 113
5.2 Data Reduction . . . 115
5.3 Analysis and Results . . . 116
5.3.1 Resonant Capture Data . . . 120
5.3.2 Direct Capture Data . . . 123
5.4 Summary and Discussion . . . 128
6 CONCLUSION . . . 130
A PMT SPECIFICATIONS . . . 132
B ELECTRONICS SETTINGS . . . 134
C GEANT4 DETECTOR CONSTRUCTION . . . 135
D ROOT ANALYSIS . . . 139
LIST OF TABLES
1.1 Branching ratios for the decay of theEcm
r = 259 keV resonance . . . 30
2.1 Tuning parameter settings for the JN Van de Graaff accelerator . . . 36
2.2 Resonances used for calibrating the LENA analyzing magnet . . . 37
2.3 Photomultiplier tube comparison . . . 42
2.4 Assembled APEX configuration . . . 45
2.5 APEX NaI(Tl) attenuation coefficients . . . 54
3.1 Contaminant proton-induced capture reactions . . . 64
3.2 Tuning parameter settings for implanting N+2 ions into tantalum . . . 71
3.3 Summary of nitrogen targets analyzed with RBS . . . 76
4.1 Energies ofγ rays used for calibrating the APEX detector array . . . 83
4.2 Run time summary of theS-factor measurement . . . 87
4.3 S-factor statistical uncertainty . . . 110
4.4 S-factor systematic uncertainty . . . 110
4.5 Summary of S-factor results . . . 111
5.1 Angular correlation functions measured at the Ecm r = 259 keV resonance . . . 129
A.1 Photonis XP2012 PMT specifications . . . 132
A.2 Hamamatsu R580 PMT specifications . . . 133
LIST OF FIGURES
1.1 Diagram of the pp chain reactions in the sun . . . 3
1.2 Stellar energy production for the ppchain and CN cycle . . . 4
1.3 Sequence of reactions in the CNO bi-cycle . . . 5
1.4 Reaction times in the CN cycle . . . 6
1.5 Solar neutrino energy spectrum . . . 8
1.6 Hubble Space Telescope image of NGC 6397 . . . 10
1.7 Simulated time sequence of a globular cluster . . . 12
1.8 H-R diagram of NGC 6397 . . . 13
1.9 Direct capture level scheme of the14N(p, γ)15O reaction . . . . 17
1.10 Resonant capture level scheme of the 14N(p, γ)15O reaction . . . 20
1.11 Energy dependence of the cross section andS-factor . . . 22
1.12 Dominant energy-dependent functions for charged-particle reactions . . . 25
1.13 Previous ground-state S-factor measurements . . . 28
1.14 Coincidence summing of γ rays in the 14N(p, γ)15O reaction . . . . 31
2.1 Laboratory for Experimental Nuclear Astrophysics . . . 35
2.2 Photograph of the JN Van de Graaff ion source . . . 36
2.3 Schematic drawing of the LENA target chamber . . . 38
2.4 Photograph of the assembled APEX detector . . . 39
2.5 Exploded view drawing of a NaI(Tl) segment . . . 40
2.6 Photograph of the APEX detector photomultiplier tubes . . . 42
2.7 Photograph of a NaI(Tl) scintillation crystal. . . 43
2.8 Photograph of the APEX detector assembly . . . 44
2.9 Drawing of the NaI(Tl) segment configuration in APEX . . . 46
2.10 Schematic drawing of a NaI(Tl) segment . . . 47
2.12 Photograph of APEX and the radial collimator on the beamline. . . 50
2.13 Drawing of the relative position of APEX and radial collimator . . . 51
2.14 Reconstructed positions of γ rays from a60Co source . . . . 52
2.15 Reconstructed position versus source position . . . 53
2.16 Difference between the reconstructed and actual position . . . 55
2.17 Schematic diagram of the APEX electronics setup . . . 57
2.18 Reconstructed energy versus position in a 2-d histogram . . . 59
2.19 geant4 geometry used in the APEX Monte Carlo simulation . . . . 60
2.20 Full-energy peak efficiencies of the APEX and HPGe detectors . . . 62
3.1 Polycarbonate target box . . . 64
3.2 The UNC ion implanter . . . 68
3.3 Schematic of the ion implantation system . . . 69
3.4 Photograph of Ta2N3 and TiN targets . . . 72
3.5 Schematic of the RBS experimental setup . . . 74
3.6 Photograph of the RBS target wheel . . . 75
3.7 Silicon detector RBS energy spectra . . . 77
3.8 Yield curves of a nitrogen implanted target . . . 78
3.9 Yield curve comparison between Ta2N3 and TiN targets . . . 79
4.1 Photograph of the APEX and HPGe detector configuration . . . 81
4.2 Drawing of the APEX array divided into pixels . . . 82
4.3 APEX total efficiency . . . 86
4.4 Drawing of multiplicity events detected by the APEX detector . . . 88
4.5 Resonance data with imposed multiplicity 1 and 2 cuts. . . 89
4.6 Fit of multiplicity 2 resonance data . . . 92
4.7 Fit of multiplicity 1 resonance data . . . 93
4.8 Overlay of 180 keV direct capture data with Monte Carlo simulation . . . 96
4.9 Fit of multiplicity 2Eeff = 235 keV data . . . 98
4.11 Fit of multiplicity 2 Eeff = 195 keV data . . . 100
4.12 Measured S-factor for the 5.18, 6.18, and 6.79 MeV transitions . . . 102
4.13 Fit of multiplicity 1 Eeff = 235 keV data . . . 103
4.14 Fit of multiplicity 1 Eeff = 216 keV data . . . 104
4.15 Fit of multiplicity 1 Eeff = 195 keV data . . . 105
4.16 Residuals for fraction fits to multiplicity 1 data . . . 107
4.17 Measured S-factor for the ground-state transition . . . 108
4.18 Measured total S-factor . . . 112
5.1 Drawing of correlated γ rays detected by APEX . . . 114
5.2 Two-dimensional energy cuts used in the angular correlation measurement . . 117
5.3 Schematic level diagram of the resonant capture angular correlation . . . 118
5.4 Angular correlation of γ rays in the resonant capture 5.18 MeV transition . . 124
5.5 Angular correlation of γ rays in the resonant capture 6.18 MeV transition . . 125
5.6 Angular correlation of γ rays in the resonant capture 6.79 MeV transition . . 126
CHAPTER 1: INTRODUCTION
1.1 Astrophysical Motivation
The mechanism by which stars generate energy is dependent upon their evolutionary stage and composition. The oldest stars observed, referred to as Population II stars, consist mostly of hydrogen, and thus their energy is produced primarily by the fusion of protons into helium. This process is known as the proton-proton chain [Bethe and Critchfield, 1938]. The stars observed today are at least second-generation Population I stars, formed from hydrogen and material ejected during the explosive deaths of Population II stars. In stars slightly more massive than the sun, higher density and temperature inside the core will favor a chain of nuclear reactions, known as the carbon nitrogen (CN) cycle [von Weizs¨acker, 1938, Bethe,
1939], that still converts four protons into helium but involves heavier elements that act as catalysts. The rate of energy production in the CN cycle is governed by the slowest step, the 14N(p, γ)15O reaction, which acts as a “bottleneck” in the cycle. This work will examine the 14N(p, γ)15O reaction and its impact on the energy generation in our Sun and age estimates of some of the oldest clusters of stars in our Galaxy.
1.1.1 Proton-proton Chain
This fusion of hydrogen into helium is characterized by the nuclear reaction
4p→4He + 2e++ 2ν+ 26.73 MeV (1.1)
which produces 2 positrons e+, 2 neutrinos ν, and 26.73 MeV of energy in addition to 4He. The probability of four protons fusing simultaneously into helium is essentially zero. Instead, a series of two-body interactions take place as part of the proton-proton (pp) chain, and produce the same end result in Equation 1.1. A schematic diagram of the nuclear reactions involved in theppchain is shown in Figure1.1. The first two steps of the mainpp chain,ppI, must occur twice before the last step can proceed and involves a total of six protons, two of which are released in the final step. The competing reaction
3He +4He→7Be (1.2)
may occur instead of the last step of the ppI chain resulting in two possible branches from 7Be, labeled as the ppII and ppIII chains. All three pp chains operate simultaneously in a star but the ppI, ppII, and ppIII chains are the main producers of 4He at temperatures of T < 18 MK, T = 18−25 MK, and T > 25 MK respectively [Iliadis, 2007]. The branching percentages shown in Figure 1.1correspond to those in our sun, and thus theppII andppIII chains contribute a minor amount to the sun’s luminosity. The least probable branch
3He +p
→4He +e++νe (1.3)
burns only about 10−7 of 3He, but produces the most energetic neutrinos [Adelberger et al.,
Figure 1.1: Diagram of theppchain reactions and respective branching percentages between the three principal chains (ppI, ppII, ppIII) for the sun (reproduced from [Adelberger et al.,
2011]).
The pp chain dominates energy generation at temperatures lower than 20 MK (T6 = 20). Stars with masses M > 1.5M⊙, that contain carbon and nitrogen, predominantly burn hy-drogen via the CN cycle. The higher coulomb barriers of the carbon and nitrogen nuclei in the CN cycle compared to hydrogen and helium require higher temperatures to proceed. For comparison, the temperature dependence goes as approximatelyT4 for the pp chain and as T18for the CN cycle [Rolfs and Rodney,1988]. The energy generation as a function of central temperature for thepp chain and CN cycle is shown in Figure1.2. For the core temperature of our sun, T⊙ = 15.7 MK, it is estimated that the pp chain is responsible for nearly 99% of the luminosity while the CN cycle makes up the remainder. The details of the nuclear reactions involved in the CN cycle are outlined in the following section.
1.1.2 CN Cycle
The carbon nitrogen (CN) cycle consists of the following sequence of proton captures and β+-decays
Figure 1.2: Stellar energy production for theppchain and CN cycle as a function of tempera-ture (adapted from [Adelberger et al.,2011]). The sun’s luminosity is predominantly a result of the nuclear reactions in thepp chain (T⊙ denotes the temperature of the sun).
where the formation of 4He, is the same net result as for the pp chain. In the CN cycle however, only hydrogen nuclei are consumed while the total abundance of carbon, nitrogen and oxygen remain unchanged. For example, if the cycle begins with12C as in Equation1.4, the last step ends with 12C, and thus the same nuclei can be used over and over again as catalysts.
The competing reaction 15N(p, γ)16O may occur instead of the15N(p, α)12C reaction and results in a branch from 15N into a secondary, oxygen nitrogen (ON) cycle. The hydrogen burning process in this cycle is similar to the CN cycle but involves additional isotopes of oxygen as catalyst nuclei. The ON cycle is characterized by the following sequence of reactions
16O(p, γ)17F(e+ν)17O(p, α)14N (1.5)
122.24(16) seconds, and 64.49(16) seconds respectively [Ajzenberg-Selove,1991,Tilley et al.,
1993].
Figure 1.3: The CN and ON cycles together are referred to as the CNO bi-cycle. The stable nuclides are represented as shaded squares and the key shown at the right relates an arrow to either a (p, γ), (p, α), orβ+-decay.
The rate of energy production in the CN cycle or any sequence of nuclear reactions, is governed by the slowest reaction. As an example, the CN cycle reaction times for a 2M⊙ star with a temperature T6 = 25 and density ρ = 100 g/cm3 are shown in Figure 1.4. The 14N(p, γ)15O reaction proceeds at a rate nearly 1000 times slower than the next slowest reaction, 12C(p, γ)13N . For the temperatures present in hydrostatic hydrogen burning, the β+-decays of unstable nuclei proceed at a faster rate than competing proton capture reactions on the unstable nuclei and thus do not play a role in energy generation. The slow rate of the 14N(p, γ)15O reaction forms a bottleneck for the flow of material through the CN cycle and effectively limits the speed at which the cycle can operate. The significance of the 14N(p, γ)15O reaction and its impact on neutrino production in our Sun and age estimates of globular clusters in our Galaxy is detailed in the following two sections.
1.1.3 Solar Metallicity
Figure 1.4: Reaction times in the CN cycle for a 2M⊙ star with a temperature and density of T6= 25 andρ= 100 g/cm3 respectively [Champagne,2013]. The14N(p, γ)15O reaction is by far the slowest reaction and in turn, regulates the rate of energy production of the CN cycle.
age of approximately 4.57 Gy. The SSM assumes local hydrostatic equilibrium, energy gener-ation by hydrogen burning, a homogeneous zero-age sun, and boundary conditions imposed by the known mass, radius, and luminosity of the present sun [Haxton and Serenelli,2008]. The assumption of a homogeneous zero-age sun constrains the primordial core metallicity to the surface abundances observed today. The chemical composition is characterized by the mass fractions of hydrogen (X), helium (Y), and all heavier elements or metals (Z). The composition of a star is expressed as
µ= [2X+ (3/4)Y + (1/2)Z]−1 (1.6)
where µ(r) is the mean molecular weight for a given stellar model. Assuming the sun was chemically homogeneous when it formed, the composition of the present solar surface would be identical to the abundances of elements present in the pre-stellar cloud,X= 0.73, Y = 0.25, and Z = 0.02. The composition of the core on the other hand, is believed to have evolved toX = 0.42, Y = 0.56, andZ = 0.02 as a result of the pp chain and CNO cycles converting hydrogen into helium [Rolfs and Rodney,1988].
helioseismology, or the study of the propagation of wave oscillations in the sun, similar to the way terrestrial seismic waves are used to probe the interior of Earth. The oscillations are periodic fluctuations in the Doppler shifts of spectral lines in the solar atmosphere, and have periods ranging from less than 5 min to 2 h 40 min [Zeilik and Gregory, 1998]. The 5 min oscillations are observed as vertical motions of areas of the sun that result from sound waves traversing the solar interior. These radial motions of gases at the solar surface agree with a metallicity content of approximatelyZ = 0.02 as predicted in 1-d solar models. In contrast, the most recent 3-d solar models that include an improved modeling of the sun’s atmosphere, indicate a lower metallicity content of Z=0.0134 [Asplund et al., 2009]. This disagreement between low-Z solar model predictions and helioseismic constraints is known as the “solar abundance problem”.
As an independent test of the SSM, the solar neutrino spectrum can be measured to probe the interior of the sun. The 26.73 MeV energy released in hydrogen burning in Equation 1.1 is shared among the resulting nuclei, γ rays, and neutrinos, and thus the energy of the neutrino is characteristic to the process in thepp chain or CNO cycles that produces it. The CNO neutrinos have a different endpoint energy thanpp neutrinos and can be distinguished on earth using large neutrino detectors filled with liquid scintillator. The predicted solar neutrino energy spectrum for the SSM is shown in Figure1.5and comparing this spectrum to the measured solar neutrino flux would provide an independent test of whether the zero-age sun was in fact homogeneous.
termination of the 14N(p, γ)15O reaction rate, represent a series of recent advances that aim to resolve the solar abundance problem.
1.1.4 Globular Cluster Ages
Globular clusters (GCs) are extremely compact (diameters≈100 ly), spherically symmet-ric collections of stars, and the oldest GCs (12 to 15 Gy) represent the oldest structures in the galaxy [Zeilik and Gregory,1998]. Nearly 200 have been documented in the Milky Way and can be found at great distances (out to ≈300,000 ly) from the central plane of our Galaxy in what is referred to as the “galactic halo” [Zeilik and Gregory,1998]. Globular clusters are very luminous and dense as they typically contain between 105 to 106stars. Stellar spectra for the halo GCs indicate a very low metal abundance (Z ≤0.001) and therefore are indicative of Population II stars. The stars in a GC are also formed at approximately the same instance relative to the age of the cluster and share the same initial composition [Zeilik and Gregory,
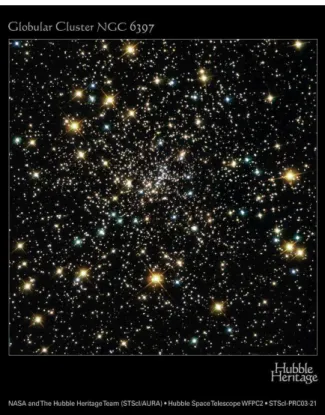
1998]. There are some stars that appear to be formed from separate star-formation events, but this simple picture underlies our basic understanding of most clusters. The major differ-ence between stars in GCs are their initial masses, which in the end, causes the heaviest stars to evolve the fastest while the lightest stars evolve the slowest. A Hubble Space Telescope image of the globular cluster NGC 6397 is shown in Figure1.6.
Figure 1.6: Hubble Space Telescope image of the globular cluster NGC 6397.
proton fusion keep these stars in hydrostatic equilibrium and most of the interior transports energy by radiation, while only the outer region of the star’s envelope is convective.
The H-R diagram in the middle of Figure 1.7 represents 10 My from ZAMS when the red giant branch (RGB) begins to form. After the hydrogen fuel is used up in the core, thermonuclear reactions no longer take place there but instead continue in a shell surrounding the core where fresh hydrogen still exists. Meanwhile, the core begins to contract which heats the layer of burning hydrogen, causing the temperature and associated nuclear energy generation rate to increase. The shell of burning hydrogen heats up the surrounding envelope of the star, and causes it to expand. As the radius of the star begins to increase, its surface temperature decreases, which in turn, increases the opacity because H−
ions begin to form. Eventually convection carries most of the energy outward in the envelope. The luminosity will then increase drastically and this causes the star to move up the RGB branch.
mass stars have a higher effective temperature and therefore will leave the main sequence sooner than lower mass stars. For this reason, the MSTO will be seen to decrease in luminosity and temperature as the cluster ages. The turnoff is the hottest position on the main sequence and marks the point in a star’s evolution where hydrogen is exhausted in the core. As a star approaches the MSTO, energy generation switches from theppchain to CN cycle reactions and thus the luminosity is mostly regulated by the14N(p, γ)15O reaction rate [Rolfs and Rodney,
1988]. Subsequent stellar evolutionary stages, while equally fascinating, will not be discussed here as they are less relevant to the subject of globular cluster age estimation.
The observed turnoff points of clusters give their approximate age when compared to constant-time lines, or “isochrones”, from theoretical models. An isochrone is a snapshot in the life of a cluster as it represents the locations of the ends of evolutionary tracks for stars to that particular time since formation. The H-R diagram of the globular cluster NGC 6397 is shown in Figure 1.8. Isochrones of 13, 14, and 15 Gy are fit to the main-sequence turnoff region using the14N(p, γ)15O reaction rate measured at the underground accelerator facility LUNA at Gran Sasso, Italy [Formicola et al., 2004]. The age of globular cluster NGC 6397 is determined to be 14±1 Gy which is nearly 1.0 Gy older than previously thought, a result of the revised 14N(p, γ)15O reaction rate. Increased ages of the oldest GCs have a significant impact in cosmology as well. Age estimates of the Milky Way halo GCs provide a strict lower limit on the age of our Galaxy and also a consistency check of the age of the Universe.
Estimating the age of globular clusters using the isochrone fitting method is one way to get the ages of GCs and it is for the most part, the best understood. There are also techniques based on the location of the horizontal branch (HB) in H-R diagrams or the difference from the HB to the MSTO, but these methods have higher systematic uncertainty [Champagne,2013]. Sources of uncertainty in the isochrone fitting procedure, in order of importance, are the dis-tance scale (16%), oxygen abundance (7%), treatment of convection within stars (5%), helium abundance (3%),14N(p, γ)15O reaction rate (3%), and helium diffusion (3%) [Chaboyer et al.,
Figure 1.8: H-R diagram of the globular cluster NGC 6397 (reproduced from [Imbriani et al.,
1.2 Nuclear Reactions
Nuclear reaction theory describes the interactions between nucleons in terms of two fun-damental forces, the electromagnetic and strong nuclear force. The electromagnetic force, or Coulomb interaction between charged particles, is very well understood, whereas the strong nuclear force involved is extremely complex and not precisely known. The nucleon-nucleon interaction exhibits a repulsive force at short distances, yet at distances close to the size of the nucleus (≈ 1 fm = 10−15 m), the fundamental strong interaction exhibits an attractive force. Calculating every interaction between nucleons becomes computationally impractical after just a few nucleons, and therefore approximations using effective potentials are neces-sary. For the most part, the approximations are customized to a specific energy of a reaction and are not generalized to all nuclear interactions. The quantum-mechanical approximations are beyond the scope of this work; however, the next few sections outline some fundamentals of nuclear reactions and how the specific models apply to the14N(p, γ)15O reaction.
The nuclear structure influencing the reaction mechanism can be best understood through a physical quantity known as the cross section. The cross section, σ, is a measure of the probability that a nuclear interaction occurs between the incident particles and target nuclei, defined as
σ = number of interactions per time
number of incident particles per time×number of target nuclei per area (1.7) The cross section can be expressed in measurable laboratory quantities as
σ = NR/t (Nb/t)(Nt/A)
(1.8)
where NR/t is the number of interactions per unit time, Nb/t, is the number of incident
particles per time or beam current, andNt/Ais the number of target nuclei per area covered
by the beam. The traditional units of the nuclear cross section is the barn, b, which is defined as
and is simply an interaction area between the incident particle and target nucleus. Measurable cross sections are typically greater than 10−9 b. The discussion of the cross section in this work is focused on radiative capture, or the capture of a particle by a nucleus, inducing the emission of electromagnetic radiation as aγ ray.
In general, radiative-capture cross sections at low energies exhibit two distinct character-istics. The cross section has an overall energy dependence described by a smooth, exponential increase with beam energy. Superimposed on the smooth background are spikes in the cross section which rapidly change by many orders of magnitude, called resonances. The smoothly varying cross section is attributed to the Coulomb interaction of the incident and target par-ticles and described as a single-step process known as direct capture. On the other hand, the resonant capture process corresponds to energies of distinct nuclear levels in the target nu-cleus and involves a two-step process of first forming a compound state, and the subsequent de-excitation of that state. A summary of both the direct capture and resonant capture mechanisms are described in the following sections.
Frequently, cross sections for radiative-capture reactions that take place in astrophysical environments are too weak to be measured in the laboratory. For example, at the interior temperature of the sun the14N(p, γ)15O reaction has a cross section on the order of 10−20 b, which is nearly 10 orders of magnitude lower than what is typically measurable in the labora-tory. Assuming a proton beam current of 1 mA and a detection efficiency of 1%, a statistically significant measurement of the cross section at energies of the nuclei in the sun’s core would require an experiment to run for nearly 100 My. In practice, the cross section is measured at the lowest reasonable energies that may require several weeks of run time, then extrapolated down to astrophysically relevant energies.
nature of each process allow resonances to interfere with other resonances or with direct capture. The 14N(p, γ)15O reaction exhibits all of the aforementioned complications and therefore, discrepancies exist in the extrapolations of the 14N(p, γ)15O cross section to low energies. The method for determining the nonresonant reaction rate for the 14N(p, γ)15O reaction is outlined later in this chapter.
1.2.1 Nonresonant Cross Sections
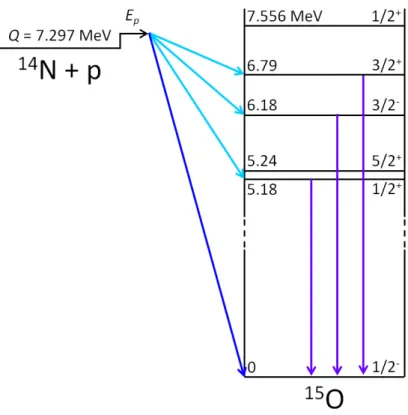
The nonresonant reaction mechanism is characterized by a single-step process where a proton is captured by the target nucleus as aγ ray is emitted to form a bound state of a final nucleus. The interaction with the electromagnetic field allows for the transition of the proton from an initial scattering state to a final bound state without the formation of a compound nucleus. In this direct capture model, the incident proton interacts with the target nucleus as a single core and not with individual nucleons. Therefore, the direct capture reaction is a relatively quick process, on the order of t≈10−22s, in comparison to resonant capture, where the time needed to form a compound nucleus is on the order of t≈10−17 s. Figure 1.9 is an illustration of the 14N(p, γ)15O direct capture reaction that can occur for all energies, E
p, of
the incident proton. In each transition, a γ ray of energy Eγ =Q+Ep −Ex is emitted to
form a bound state of energyEx, in the final nucleus. TheQ-value is defined as the difference
in the masses before and after the reaction, and thus in the case of the14N(p, γ)15O reaction isQ= 7.297 MeV.
The direct capture cross section discussed here is focused on the E1 transition, which is typically the dominant contribution to the cross section. The cross section for an E1 transition of a scattering state of initial angular momentum li to a bound state of final
angular momentumlf is given by
σ(E1) = 0.0716m301/2
Z0 m0 −
Z1 m1
2 E3
γ
Ep3/2
(2Jf + 1)(2li+ 1)
(2j0+ 1)(2j1+ 1)(2lf + 1)
×(li010|lf0)2R2li1lf (10
−6 b)
(1.10)
Z1,m0,m1,j0, andj1are the charges, masses (in amu), and spins of the projectile and target respectively; Jf is the angular momentum of the final state; Ep is the bombarding energy in
the center-of-mass system (in MeV); andEγ is the energy of theγ-ray transition [Rolfs,1973, Iliadis and Wiescher,2004]. The radial integral,Rli1lf, is defined as
Rli1lf =
Z ∞
0
uc(r)OE1(r)ub(r)r2dr (1.11)
whereOE1(r) is the radial part of the electric dipole operator E1, anduc,ubare the continuum
and bound state wave functions respectively [Rolfs, 1973, Iliadis and Wiescher, 2004]. The radial integral has to be evaluated numerically, and requires significant knowledge regarding the nature of the bound state wave functions and is beyond the scope of the current work.
In practice, the absolute normalization of the theoretical direct capture cross section can not be reliably calculated. The previous assumption regarding the single particle nature of the direct capture reaction is not entirely correct, whereas in actuality, only a fraction of the total wave function exists as a single particle state. Spectroscopic factors provide an empirical estimate of the fraction of the final state wave function that can be described by a single particle bound in a potential well. The experimental cross section is related to the theoretical cross section through
σexp = X
li,lf
C2S(lf)σtheo(li, lf) (1.12)
where the sum is over all possible initial and final state orbital angular momenta, li and lf
respectively, and C2S(l
f) is the spectroscopic factor. Thus, the direct capture cross section
can be used to determine the spectroscopic factor. Alternatively, theC2S(l
f) values can be
1.2.2 Resonant Cross Sections
In contrast to direct capture, the resonant capture process results in a strongly energy-dependent cross section that can vary by many orders of magnitude over a small energy range (10 keV). The radial integral in the resonant capture model has a major contribution from the nuclear interior for energies that are near the quasi-bound states of the nuclear potential and is a maximum when the internal wavefunction matches the external scattering wavefunction. This occurs when the energy of the entrance channel,Q+Er, closely matches the energy of
the excited state,Ex, in the compound nucleus and implies that the resonance energies are
Er=Ex−Q (1.13)
whereQis the constant Q-value for the given nuclear reaction, for the14N(p, γ)15O reaction Q= 7.297 MeV. The total width of a resonance, Γ, is given by the sum of the partial widths of all energetically allowed decay channels
Γ = Γp+ Γγ+· · · (1.14)
which in the present study are only the proton and γ channels. An illustration of the Elab
r = 278 keV resonant capture reaction is shown in Figure1.10where the entrance channel,
14N +p, forms an excited state at 7.556 MeV in the15O compound nucleus atEcm
r = 259 keV
center-of-mass energy. The 7.556 MeV state decays into lower-lying states, Ei, with the
emission of a γ ray of energy Eγ= 7.556 MeV−Ei.
The resonant capture cross section discussed here is focused on a resonance which is both isolated and narrow. A resonance is considered isolated if the level density in the compound nucleus is small, such that neighboring resonances do not overlap significantly. Moreover, a resonance is called narrow if the partial widths are approximately constant over the total resonance width, which is typically less than a few keV [Iliadis,2007]. The cross section of a narrow, isolated resonance such as theEcm
Figure 1.10: Illustration of the Ecm
r = 259 keV resonant capture level scheme of the
by the single-level Breit-Wigner formula
σ(E) = λ 2
4πω
ΓpΓγ
(Er−E)2+ Γ2/4
(1.15)
where Er is the energy of the resonance, Γp and Γγ are the resonance partial widths of the
entrance and exit channel respectively, and Γ is the total resonance width. The de Broglie wavelength,λ, is expressed as
λ= h
(2m01Er)1/2
(1.16)
wherem01 is the reduced mass andω is a statistical factor. The statistical factor is defined as
ω = (2J+ 1)(1 +δ01) (2j0+ 1)(2j1+ 1)
(1.17)
where J is the angular momentum of the resonance, j0 and j1 are the spins of the target and projectile, and the factor (1 +δ01) is included because the cross section is increased by a factor of 2 in the case of identical particles in the entrance channel [Rolfs and Rodney,1988]. The cross section of astrophysically relevant reactions at low energy, is often dominated by the tails of higher energy resonances since the direct capture contribution is negligible in comparison. Precise calculations of the resonant contribution far from Er require accurate
values of the partial widths and resonance energy in the Breit-Wigner formula. The resonance energy can be measured with the use of high resolution charged-particle accelerators; however, the partial widths for many resonances remain unknown and typically contribute the majority of the uncertainty in calculations of the cross section.
1.2.3 Astrophysical S-factor and Reaction Rates
The total cross section from a previous14N(p, γ)15O reaction measurement [Runkle et al.,
2005] is shown in the left panel of Figure 1.11. Plotted in the right panel is what is known as the “astrophysical S-factor”, which is related to the cross section through
σ(E) = 1
where exp (−2πη) is the Gamow factor and ηis the Sommerfeld parameter. The Sommerfeld parameter is defined as
η= Z0Z1e 2
~ν (1.19)
whereν is the velocity of the projectile. The exponent of the Gamow factor can be calculated numerically as
2πη= (31.29)Z0Z1 m01
E 1/2
(1.20)
where m01 is the reduced mass of the target projectile system in amu, and E is the center-of-mass energy in keV [Rolfs and Rodney,1988].
Figure 1.11: Total cross section and corresponding S-factor data for the 14N(p, γ)15O reac-tion [Champagne,2013]. The cross section, shown in the left panel, falls off rapidly at energies below the Coulomb barrier, whereas the S-factor, shown in the right panel, is a smoothly varying function which remains nearly flat with beam energy. The solar energy window is illustrated by the yellow band at low energy for a stellar temperature ofT⊙= 15×106 K.
cross section to theS-factor is used to extrapolate a fit of the data to astrophysical energies where direct measurements are prohibited by the Coulomb barrier. The significance and location of this astrophysical energy region is discussed in depth later in this section.
The following discussion is a treatment of nonresonant reaction rates for a nondegenerate, nonrelativistic, stellar environment in thermal equilibrium. The reaction rate per particle pair,hσvi, for a particle-induced reaction is given by
hσvi=
8 πm01
1/2 1 (kT)3/2
Z ∞
0
σ(E)Eexp
− E kT
dE (1.21)
where the relative velocity of the nuclei are described by a Maxwell-Boltzmann velocity dis-tribution
φ(E)∝Eexp
−kTE
(1.22)
and the Boltzmann constant is given by k = 8.6173×10⁻⁸ keV/K. The reaction rate per particle pair can also be written in terms of the astrophysicalS-factor by substituting Equa-tion1.18 in Equation 1.21
hσvi=
8 πm01
1/2 1 (kT)3/2
Z ∞
0
S(E) exp
−kTE −2πη
dE (1.23)
In practice, the number of reactions per unit volume per time is evaluated at each tem-perature of interest for a stellar environment. The product of the number of particle pairs and the reaction rate per particle pair,NAhσvi, in units of cm3mol−1s−1, is given by
NAhσvi=
8 πm01
1/2 NA
(kT)3/2 Z ∞
0
S(E) exp
−kTE −2πη
dE (1.24)
where NA is Avogadro’s number. Typically, the S(E) factor is nearly a constant over the
narrow energy window around the effective burning energy for a given stellar temperature so Equation1.24 simplifies to
NAhσvi=
8 πm01
1/2 NA
(kT)3/2S(E0) Z ∞
0 exp
−kTE −2πη
where the temperatureT, energyE, and masses are in units of Kelvin, keV, and amu respec-tively.
The integrand in Equation1.25approaches zero at low energies as a result of the Gamow factor, exp (−2πη), but also approaches zero at higher energies on account of the Maxwell-Boltzmann distribution, exp (−E/kT). For this reason, the dominant contribution to the integral will arise from energies where the product of the exponential factors is near its maxi-mum value. Figure1.12illustrates the energy dependence of the integrand in Equation 1.25. The maximum value energy E0 can be found by taking the first derivative of the integrand with respect toE,
E0 =
π
~
2
e2Z0Z1
2m01 2
(kT)2
1/3
(1.26)
Numerically, the energyE0 is calculated using
E0= 1.22 Z02Z12m01T62 1/3
(keV) (1.27)
Approximating the Gamow peak as a Gaussian function, the 1/e width, ∆, of the energy window is given by
∆ = √4
3(E0kT) 1/2
= 0.749 Z02Z12m01T65 1/6
(keV) (1.28)
which defines the effective width of the Gamow peak.
Figure 1.12: The convolution of the Maxwell-Boltzmann distribution and the quantum me-chanical tunneling probability results in a peak nearE0 known as the Gamow peak (adapted from [Rolfs and Rodney,1988]). The Gamow peak illustrates the narrow energy or temper-ature range over which the majority of nuclear reactions occur in a star.
contraction [Rolfs and Rodney,1988].
Frequently, it is sufficient to calculate the nonresonant reaction rate in terms of an effective astrophysicalS-factor that is only dependent upon the temperature and extrapolatedS-factor at zero energy, S(0) [Fowler et al., 1967]. If the S-factor is described by a slowly varying function of energy instead of a constant as assumed in Equation1.25, it can be expanded in a Taylor series at E= 0 as
S(E)≈S(0) +S′
(0)E+1 2S
′′
(0)E2+· · · (1.29)
whereS′
(0) andS′′
series expansion, an analytic expression for the reaction rate is
NAhσvi=
4 3
3/2
~
π
NA
m01Z0Z1e2
Seffτ2e−τ (1.30)
where the effectiveS-factor,Seff [Fowler et al.,1967], is given by
Seff(E0) =S(0)
1 + 5 12τ +
S′ (0) S(0)
E0+
35 36kT +1 2 S′′ (0) S(0)
E02+ 89 36E0kT
(1.31)
The dimensionless parameterτ found in both Equations 1.30, and 1.31is defined as
τ = 3E0
kT = 42.46
Z2 0Z12m01
T6
1/3
(1.32)
1.3 Previous Measurements
Since a direct measurement of the total14N(p, γ)15OS-factor at astrophysical energies is out of reach experimentally, the14N(p, γ)15O reaction rate is determined by the extrapolated totalS-factor at zero energy. In order to produce an accurate extrapolation of the total S -factor, each transition of the14N(p, γ)15O reaction must be fit and extrapolated individually so that its distinct energy dependence is properly taken into account. Precision measurements of the ground-state S-factor have been performed since the 1980’s but the landscape of the low-energy extrapolation is still quite uncertain. In the last 25 years, the extrapolatedS(0) value for the ground state has been revised by a factor of 5 and presently, the recommended S(0) value has a relative uncertainty of nearly 20% [Adelberger et al., 2011]. The ground-state transition contributes approximately 15−30% to the total S(0) which makes it the second-largest component following the 6.79 MeV transition. The low-energy ground-stateS -factor is especially complicated as a result of interference effects that make the extrapolation highly dependent upon the nuclear reaction model. The Ecm
r = 259 keV resonance resides
on top of an interference “dip” created by a subthreshold resonance atEcm
r =−504 keV and
higher energy resonances atEcm
r = 987 and 2187 keV, as shown in Figure1.13.
am-plitudes may interfere with one another. The total cross section of two interfering resonances with individual cross sectionsσ1 and σ2 is given by
σ(E) =σ1(E) +σ2(E)±2pσ1(E)σ2(E) cos(δ1−δ2) (1.33)
and the phase shifts,δi, are defined as
δi = arctan
Γi
2(E−Er,i)
(1.34)
where the resonance energy and width are given asEr,iand Γirespectively [Rolfs and Rodney, 1975]. The reaction rate for the interfering resonances is calculated by substituting Equa-tion 1.33 in Equation 1.21 and numerically integrating. In the case of the ground-state transition in the 14N(p, γ)15O reaction, the tails of resonances at Ecm
r =−504, 259, 987, and
2187 keV extend into the low-energy region of theS-factor curve and interfere with each other and with the direct capture contribution. As a result of the complicated landscape, a model known as “R-matrix theory” [Lane and Thomas, 1958,Breit, 1959] is frequently used to fit the data and extrapolate the S-factor to zero energy.
R-matrix theory is a phenomenological model that requires empirical data to describe resonant capture cross sections and does not make predictions from first principles. R-matrix can be described as a boundary value theory, where a boundary separates an internal region, which represents the interior of the nucleus, from the external world around it. Only the Coulomb potential is present in the external region, so the interaction behavior is well known. In contrast, the internal region contains all the unknowns, which are the parameters of the characteristic resonances of the system. The observables, such as the cross section and S -factor, are calculated by matching the logarithmic derivative of the wave functions at the boundary.
fits were performed on various subsets of data. The fit of Angulo [Angulo and Descouvemont,
2001] considered only the data from Schr¨oder whereas the fit of Imbriani included the Schr¨oder data along with their measured results [Formicola et al., 2004]. The R-matrix fit to the Runkle data omitted the Schr¨oder results except for the parameters of the higher energy resonances, which were obtained from the Angulo fit. A 2009 review [Costantini et al.,2009] by LUNA considered all the ground-state transition data at the time including the Marta data and performed a re-normalization to the strength of theEcm
r = 259 keV resonance. The
(p, p) constrained fit [Bertone,2010] is a multi-channel R-matrix fit that included14N(p, p)14N scattering data with the global14N(p, γ)15O ground-state data set excluding the Marta points. Fitting the measured S-factor data using R-matrix is computationally intensive to perform and beyond the scope of this study. An outline of the specific project goals for this work is detailed in the last section of this chapter.
1.3.1 Coincidence Summing Considerations
At the energies of interest in the present study, the nuclear level populated in 15O by proton capture can de-excite via a single γ ray directly to the ground state or by the se-quential emission of two γ rays in a cascade as illustrated in Figures 1.9 and 1.10. In some instances, the two coincident γ rays from the 5.18, 6.18, or 6.79 MeV transition can interact simultaneously with the detector resulting in a summed energy signal. This effect, known as “coincidence summing”, creates spurious events in the ground-state peak and a deficit in the cascades. In this case, coincidence summing corrections must be applied to the experi-mental data in order to extract the total number of decays from the number of detected γ rays in the primary, secondary, and ground-state full-energy peaks. Summing corrections can be particularly severe in the measurement of the 14N(p, γ)15O ground-state transition as a result of its relatively small branching ratio, which is only 1−2% over the energy region of interest. Measured branching ratios for transitions to the ground state, 5.18, 5.24, 6.18, and 6.79 MeV states at theEcm
r = 259 keV resonance are listed in Table 1.1[Marta et al.,2011].
Transition Branching (%) Ground State 1.49±0.04
5.18 MeV 17.3±0.2 5.24 MeV 0.15±0.03 6.18 MeV 58.3±0.4 6.79 MeV 22.6±0.3
Table 1.1: Tabulation of branching ratios for the decay of the Ecm
r = 259 keV
reso-nance [Marta et al.,2011].
The procedure for making coincidence summing corrections in the case of the14N(p, γ)15O reaction, can be demonstrated by a simple example involving only three nuclear levels. Fig-ure 1.14 illustrates the effect of coincidence summing on the intensities of the primary, sec-ondary, and ground-state full-energy peaks in the 15O decay scheme. In this scenario, the 7.556 MeV state populated in the Ecm
r = 259 keV resonance either decays directly to the
ground state, via emission of γ0 with a branching ratio ofB0, or to the 6.18 MeV state, via emission ofγ1 with a branching ratio of B1. The 6.18 MeV state subsequently decays to the ground state 100% of the time via emission ofγ2.
Ignoring angular correlation effects between the primary and secondaryγrays, the number of detected primaryγ rays in the full-energy peak, N1, can be calculated using
N1=N B1η1P −N B1ηP1η2T
=N B1η1P(1−ηT2) (1.35)
Figure 1.14: Coincidence summing of γ rays in the14N(p, γ)15O reaction. The left panel is a simplified level diagram of the Ecm
r = 259 keV resonance in 14N(p, γ)15O . The energy
detected secondaryγ rays in the full-energy peak, N2, is equal to
N2=N B1η2P −N B1ηP2η1T
=N B1η2P(1−ηT1) (1.36)
whereη2P is the full-energy peak efficiency of the secondaryγray, andη1T is the total-efficiency of the primaryγ ray.
Alternatively, the number of detected full-energy peak ground-state events,N0, is related to the total number of decays by
N0 =N B0ηP0 +N B1η1PηP2 (1.37)
which is increased by the amountN B1η1Pη2P, the probability that the full-energy of both γ1 and γ2 are detected. This effect is referred to as “summing-in” and shown in Figure1.14 by the dashed lines at the full-energy peak of the ground state.
Finally, the total number of decays can be calculated from the intensities of the primary or secondaryγ ray full-energy peaks. Rearranging Equations 1.35 or1.36 and solving forN gives
N = N1
B1η1P(1−η2T)
= N2
B1η2P(1−η1T)
(1.38)
and properly accounts for coincidence summing.
1.4 The Project Goals
The focus of the present study was to characterize a NaI(Tl) detector array and measure the low-energyS-factor of the14N(p, γ)15O reaction. Of particular interest, was the ground-state S-factor residing in the low-energy interference dip between Ecm = 150−180 keV. The published data in this interference region have relatively large uncertainty as a result of low counting statistics and coincidence summing corrections as shown in Figure 1.13. The primary goal of this work was to measure the ground-state transition without the need for coincidence summing corrections in an attempt to better constrain future R-matrix fits that extrapolate theS-factor to zero energy. Additionally, the 5.18, 6.18, and 6.79 MeVS-factors were measured without additional cost to the experiment and with higher counting statistics since those transitions are stronger than the ground-state transition in the region of interest. A secondary goal was to utilize the position-sensitivity of the γ-ray detector to measure the angular correlations of the primary and secondary γ rays emitted in transitions to the 5.18, 6.18, and 6.79 MeV states. The direct capture angular correlation data could improve coincidence sum corrections in future14N(p, γ)15O experiments that utilize detectors arranged in a close counting geometry.
CHAPTER 2: ACCELERATOR AND DETECTOR
2.1 The Laboratory for Experimental Nuclear Astrophysics
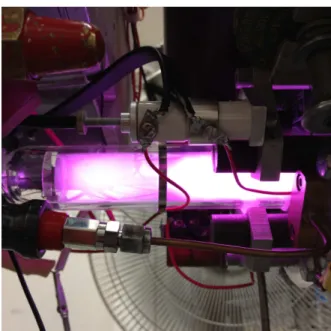
The14N(p, γ)15O reaction experiments were performed in the Laboratory for Experimen-tal Nuclear Astrophysics (LENA) at the Triangle Universities Nuclear Laboratory (TUNL). LENA is a dedicated nuclear astrophysics laboratory equipped with two charged particle ac-celerators and multipleγ-ray detector systems. A schematic drawing of the layout of LENA is shown in Figure2.1with accelerators, major beamline components, analyzing magnet, and the “APEX”γ-ray detector labeled. The JN Van de Graaff accelerator is capable of acceler-ating protons with energies up to 1 MeV with beam current intensities between 100−150µA on target. The Electron Cyclotron Resonance (ECR) ion source resides on a 200 kV plat-form and can produce high intensity proton beams (> 1 mA) up to 200 keV. The data in the present work were recorded using the APEX γ-ray detector while the proton beam was provided by the JN Van de Graaff accelerator.
2.2 JN Van de Graaff Accelerator
Figure 2.1: Schematic of the Laboratory for Experimental Nuclear Astrophysics [Champagne,
2013]. Electron Cyclotron Resonance (ECR) ion source, JN Van de Graaff accelerator, ana-lyzing magnet, APEXγ-ray detector, and relevant beamline components are labeled.
to ionize the gas. The axial magnetic field produced by permanent magnets confined and positioned the plasma. Proton beam was extracted by an electric potential that ranged between 0−5 kV, applied between the probe tip and the ion source base.
The beam output was optimized by control of the source gas pressure and oscillator loading. Optimal tuning parameter settings for striking a hydrogen plasma in the JN Van de Graaff accelerator and obtaining maximum beam output are shown in Table 2.1. The total beam current measured on the first few shorted planes of the acceleration column reached 2.2 mA while tuning the ion source, which was performed with the ion source open to air and a grounding rod attached to the acceleration column. During the experiment, the ion source was operated at high voltage inside a pressurized vessel filled with a mixture of carbon dioxide and nitrogen gas that electrically insulated the terminal.
Figure 2.2: Photograph of a hydrogen plasma inside the JN Van de Graaff ion source bottle. The probe tip is visible protruding into the end of the source bottle near the left side of the image.
Twin-lead length 15.0 cm
Tuning capacitor position All the way out Plate line clip position 1.25 inches from base Rear bottle clip position 0.875 inches from magnets JN gas pressure 2.3×10⁻⁶ Torr
Extraction voltage 5.0 kV
Grid current 4.0 mA
Plate current 250 mA
Total beam current 2.2 mA
calibration is determined through several measurements of well-known resonance reactions. The reactions used to calibrate the analyzing magnet along with their natural widths are shown in Table2.2. The calibrated magnetic field, B, for a desired energy,E, is determined by
B = k q 2mc
2E+E21/2
(2.1)
where q and m are the charge and mass of the accelerated ion and k is the calibration constant [Rolfs and Rodney, 1988]. The energy selected proton beam leaving the magnet travels through a second set of quadrupole magnets and beam steerers that focus and position the beam on the center of the target. The energy resolution of the proton beam on target is typically 1−2 keV full width at half maximum (FWHM). The beam current is measured directly from an electrically isolated target chamber (i.e., a Faraday cup) and will be discussed in the following section.
Reaction Elab
r (keV) Γ (eV)
18O(p, γ)19F 150.82(9) 130(10) 27Al(p, γ)28Si 202.8(9)
326.97(5) <38 405.44(10) <42 26Mg(p, γ)27Al 292.06(9) <37 338.4(1) <40 453.8(1) <81
Table 2.2: Tabulation of resonances used for calibrating the LENA analyzing magnet [Iliadis,
2007].
2.3 Target Chamber
nitrogen implanted region of the target. The target chamber pressure was maintained below 5×10⁻⁷ Torr and a liquid nitrogen cooled copper shroud, commonly referred to as a “cold trap”, positioned before the target prevented carbon and other contaminants from plating onto the surface of the target. The copper shroud is biased to -300 V in order to suppress the emission of secondary electrons from the target, thereby improving the measurement of the integrated beam current.
Figure 2.3: Schematic drawing of the LENA target chamber. The beam passes through a copper collimator and secondary electron suppression ring (-300 V bias) before bombarding a directly water-cooled beamstop target. The target holder is electrically isolated to measure the accumulated charge of the incident proton beam. The copper shroud is cooled to liquid-nitrogen (LN2) temperatures to reduce the buildup of contaminants on the target.
2.4 APEX Trigger Detector
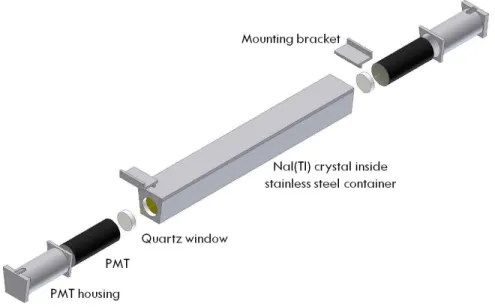
The APEX detector is segmented into 24 position-sensitive bars of NaI(Tl) scintilla-tor. The crystals are trapezoidal in cross section with dimensions 55.0×6.0×5.5(7.0) cm3 (L×H×W). Each crystal is encapsulated in a 0.4 mm thick evacuated stainless steel con-tainer with quartz windows, 4.4 cm in diameter and 1.1 cm thick, permanently fixed at either end. A 5 cm diameter Hamamatsu R2490 photomultiplier tube (PMT) is optically coupled to each window using Saint-Gobain BC-630 silicone grease. The performance of the original PMTs was inadequate for the present study and consequently the tubes were replaced, as de-scribed in the following section. An exploded view drawing of one APEX detector segment is shown in Figure2.5with the NaI(Tl) crystal, quartz windows, PMTs and aluminum housings indicated.
Figure 2.5: Drawing of a NaI(Tl) segment with major components identified. The photo-multiplier tubes (PMTs) are optically coupled to each window using Saint-Gobain BC-630 silicone grease.
the cradle were mounted with leveling jacks that provided the necessary height adjustments to center the NaI(Tl) array around the LENA target chamber. Plastic standoffs placed under the leveling jacks electrically insulate the APEX detector from the beamline, which reduced electronic noise in the PMTs.
2.4.1 Assembly
The Hamamatsu R2490 PMTs that were originally coupled to the NaI(Tl) segments were chosen specifically for their performance in a strong magnetic field. Testing of the PMTs for the APEX experiment showed they suffered only a 3% gain reduction in a 300 Gauss longi-tudinal field [Kaloskamis et al., 1993]. PMTs such as these, are designed with a fine mesh dynode structure and minimal distance between the photocathode and first dynode, are suit-able for operation in strong magnetic fields, but typically at the expense of energy resolution. Initial testing performed at LENA of the NaI(Tl) scintillators and R2490 tubes with a 60Co source indicated unusually poor energy resolution and noisy PMT signals. The two signature γ-ray lines at 1173.2 keV and 1332.5 keV were indistinguishable in the 60Co reconstructed energy spectrum. Consequently, we replaced the original tubes with with 32 Hamamatsu R580 tubes and 16 Photonis XP2012B tubes in new aluminum mounts. The new PMT hous-ings have eliminated light leaks, while the spectroscopy grade tubes provide improved energy resolution. A specification comparison of the different PMT models is listed in Table 2.3. The new PMTs although smaller in diameter, have greater luminous sensitivity, less dark current, and the 1173.2 keV and 1332.5 keV peaks in the 60Co energy spectrum could now be differentiated. A photograph of the Hamamatsu R2490, R580, and the Photonis XP2012 with separate mu-metal shield and voltage divider is shown in Figure2.6.
Hamamatsu Photonis Hamamatsu
R2490 XP2012 R580
Diameter 2.0 inches 1.5 inches 1.5 inches
Number of stages 16 10 10
Quantum efficiency 22% 25% 27%
Luminous sensitivity 70µA/lm 85 µA/lm 90 µA/lm Radiant sensitivity at 420 nm 75 mA/W 85 mA/W 88 mA/W
Dark current 200 nA 1 nA <3 nA
Pulse rise time 2.7 ns 2.5 ns 2.7 ns
Table 2.3: Tabulation of photomultiplier tube specifications as listed by the manufacturer.
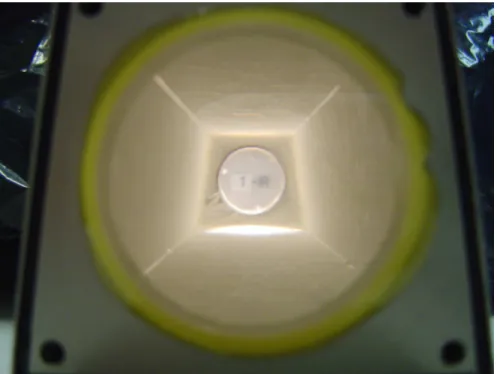
surrounding a few of the crystals are no longer airtight, exposing the crystals to moisture and resulting in the appearance of a yellow tint to the crystal. The catalog of NaI(Tl) crystal photographs is kept on file for future reference in the event we suspect a scintillator bar is behaving poorly and will permit future comparison if we suspect continuing degradation.
Figure 2.7: Photograph of a NaI(Tl) scintillation crystal as viewed through the quartz window on one side of the segment. The length of the NaI(Tl) crystal is 55.0 cm and the diameter of the quartz window is 4.4 cm.
Figure 2.8: Photograph of the APEX detector segments prior to PMT coupling and assembly.
and downstream PMTs, relative to the beam direction, were matched to the same NaI(Tl) crystal according to their cathode blue sensitivity index printed on the PMT test ticket issued by the manufacturer. The detailed specifications from each test ticket are included in Appendix A. The blue sensitivity index, expressed in µA/lmF (“F” as in Filtered), is a measure of the photoelectric current generated from the photocathode with light from a tungsten filament lamp, transmitted through a blue filter. Blue sensitivity index is an essential parameter in PMT selection because NaI(Tl) crystal scintillates light in the blue region of the electromagnetic spectrum with maximum emission at 415 nm [Knoll,2010].
LENA NaI(Tl) NaI(Tl) NaI(Tl) PMT Upstream Downstream Segment Serial Origin Sticker Model PMT Serial PMT Serial
ID Number Label Number Number Number Number
0 OU503 APPL. LAB 45 XP2012 106722 105621
1 OU504 APPL. LAB 46 XP2012 106804 107030
2 OT432 B. U. #2 27 XP2012 106356 106747
8 OT433 B. U. #2 14 R580 CE2911 CE2454
9 OT492 NS #2 16 R580 CE2944 CE2906
10 OT637 B. U. 17 R580 CE2945 CE2950
11 OT638 B. U. 18 R580 CE2957 CE2951
12 OT640 B. U. 20 R580 CE2931 CE2904
13 OT641 B. U. 21 R580 CE2960 CE2894
14 OT931 B. UTTS 15 R580 CE2926 CE2397
15 OT932 B. UTTS 28 R580 CE2876 CE2036
3 OT933 B. UTTS 29 XP2012 106527 105736
4 OT934 B. UTTS 30 XP2012 105488 105967
5 OT935 B. UTTS 31 XP2012 106818 106986
6 OU272 APPL. 32 XP2012 106529 106781
7 OU273 APPL. 33 XP2012 106247 107174
16 OU274 APPL. 34 R580 CE2503 CE2932
17 OU276 APPL. 36 R580 CE2895 CE2927
18 OU278 APPL. 38 R580 CE2930 CE2909
19 OU364 APPL. LAB 39 R580 CE2964 CE2956
20 OU365 APPL. LAB 40 R580 CE2902 CE2912
21 OU366 APPL. LAB 41 R580 CE2949 CE2965
22 OU500 APPL. LAB 42 R580 CE2941 CE2898
23 OU501 APPL. LAB 43 R580 CE2967 CE2948
2.4.2 Characterization
A unique feature of the APEX detector is the ability to read out both the position and en-ergy ofγ-ray interactions in the scintillator array. The position and energy are reconstructed from the signals produced by the PMTs coupled to both ends of the NaI(Tl) crystal. Diffusing the surfaces of the NaI(Tl) crystal by grinding causes the angles of reflection to be approxi-mately independent of the angle of incidence, and thus results in exponential attenuation of the scintillation light. Because of the exponential attenuation of photons along the length of the segment, the position can be reconstructed by comparing the relative pulse heights from the PMTs [Kaloskamis et al.,1993].
Figure2.10is a schematic drawing of a single bar of the APEX array with simplified pulse amplitudesA1 andA2, from PMT 1 and 2 respectively. The linear position,X, at which the scintillation light occurs is measured from the center of the NaI(Tl) crystal of lengthL. The signal pulse generated by the PMT closest to the interaction point of theγ ray will have a greater amplitude than that of the more distant PMT.
Figure 2.10: Schematic drawing of a NaI(Tl) segment with simplified pulse amplitudes from both photomultiplier tubes.
The amplitude of the signal from PMT 1 can be expressed as
A1 = EγP
E0
exp [−µ(L/2 +X)] (2.2)
![Figure 1.1: Diagram of the pp chain reactions and respective branching percentages between the three principal chains (ppI, ppII, ppIII) for the sun (reproduced from [Adelberger et al., 2011]).](https://thumb-us.123doks.com/thumbv2/123dok_us/8228763.2181329/17.918.228.715.121.450/diagram-reactions-respective-branching-percentages-principal-reproduced-adelberger.webp)
![Figure 1.2: Stellar energy production for the pp chain and CN cycle as a function of tempera- tempera-ture (adapted from [Adelberger et al., 2011])](https://thumb-us.123doks.com/thumbv2/123dok_us/8228763.2181329/18.918.279.670.118.426/figure-stellar-production-function-tempera-tempera-adapted-adelberger.webp)
![Figure 1.5: Solar neutrino flux as a result of nuclear reactions in the pp chain (black lines) and CNO cycles (blue dashed lines) (reproduced from [Bahcall et al., 2005]).](https://thumb-us.123doks.com/thumbv2/123dok_us/8228763.2181329/22.918.198.727.359.748/figure-neutrino-result-nuclear-reactions-cycles-reproduced-bahcall.webp)
![Figure 1.8: H-R diagram of the globular cluster NGC 6397 (reproduced from [Imbriani et al., 2004])](https://thumb-us.123doks.com/thumbv2/123dok_us/8228763.2181329/27.918.267.648.354.732/figure-h-diagram-globular-cluster-ngc-reproduced-imbriani.webp)
![Figure 1.13: A comparison of published R-matrix fits to ground-state S -factor data (adapted from [Bertone, 2010]).](https://thumb-us.123doks.com/thumbv2/123dok_us/8228763.2181329/42.918.198.693.355.804/figure-comparison-published-matrix-ground-factor-adapted-bertone.webp)