Neurocognitive Function in Children with Primary Hypertension
Marc B. Lande, MD, MPH*, Donald L. Batisky, MD%, Juan C. Kupferman, MD, MPH$, Joshua Samuels, MD, MPH#, Stephen R. Hooper, PhD&, Bonita Falkner, MD+, Shari R. Waldstein, PhDˆ, Peter G. Szilagyi, MD, MPH++, Hongyue Wang, PhD@, Jennifer Staskiewicz, MS*, and Heather R. Adams, PhD**
*Department of Pediatrics, University of Rochester, Rochester, NY %Department of Pediatrics, Emory University, Atlanta, GA
$Department of Pediatrics, Maimonides Medical Center, Brooklyn, NY #Department of Pediatrics, University of Texas at Houston, Houston, Texas
&Departments of Allied Health Sciences and Psychiatry, University of North Carolina, Chapel Hill,
North Carolina
+Department of Pediatrics, Thomas Jefferson University, Philadelphia, PA
ˆDepartment of Psychology, University of Maryland, Baltimore County, Baltimore, MD @Department of Biostatistics, University of Rochester, Rochester, NY
++Department of Pediatrics, University of California at Los Angeles (UCLA), Los Angeles, CA **Department of Neurology, University of Rochester, Rochester, NY
Abstract
Objective—To compare neurocognitive test performance of children with primary hypertension to that of normotensive controls.
Study design—Seventy-five children (10-18 years of age) with newly diagnosed, untreated hypertension and 75 frequency matched normotensive controls had baseline neurocognitive testing as part of a prospective multicenter study of cognition in primary hypertension. Subjects
completed tests of general intelligence, attention, memory, executive function, and processing speed. Parents completed rating scales of executive function and the Sleep-Related Breathing Disorder scale of the Pediatric Sleep Questionnaire (PSQ-SRBD).
Results—Hypertension and control groups did not differ significantly in age, sex, maternal education, income, race, ethnicity, obesity, anxiety, depression, cholesterol, glucose, insulin, and C-reactive protein. Subjects with hypertension had higher PSQ-SRBD scores (p = 0.04) and
Corresponding Author: Marc Lande, MD, 601 Elmwood Ave., Box 777, Rochester, NY 14642, [email protected], Ph: 585-275-9784, Fax: 585-756-8054.
The authors declare no conflicts of interest.
Publisher's Disclaimer: This is a PDF file of an unedited manuscript that has been accepted for publication. As a service to our
customers we are providing this early version of the manuscript. The manuscript will undergo copyediting, typesetting, and review of
HHS Public Access
Author manuscript
J Pediatr
. Author manuscript; available in PMC 2018 January 01.Published in final edited form as:
J Pediatr. 2017 January ; 180: 148–155.e1. doi:10.1016/j.jpeds.2016.08.076.
A
uthor Man
uscr
ipt
A
uthor Man
uscr
ipt
A
uthor Man
uscr
ipt
A
uthor Man
uscr
triglycerides (p = 0.037). Multivariate analyses showed that hypertension was independently associated with worse performance on the Rey Auditory Verbal Learning Test (List A Trial 1, p = 0.034; List A Total, p = 0.009; Short delay recall, p = 0.013), CogState Groton Maze Learning Test delayed recall (p = 0.002), Grooved Pegboard dominant hand (p = 0.045), and Wechsler Abbreviated Scales of Intelligence Vocabulary (p = 0.016). Results indicated a significant interaction between disordered sleep (PSQ-SRBD score) and hypertension on ratings of executive function (p = 0.04), such that hypertension heightened the association between increased
disordered sleep and worse executive function.
Conclusions—Youth with primary hypertension demonstrated significantly lower performance on neurocognitive testing compared with normotensive controls, in particular, on measures of memory, attention, and executive functions.
Keywords
neuropsychological testing; blood pressure; obesity; pediatric; adolescence
The prevalence of primary hypertension in children has increased significantly, a public health phenomenon that parallels the current childhood obesity epidemic. School screening studies show that the prevalence of hypertension is as high as 10% in children who are overweight, a remarkably high number given that nearly 20% of adolescents in the United States are obese.(1, 2) Studies focusing on the impact of childhood primary hypertension during youth have found that youth with hypertension often demonstrate similar target organ damage findings as adults, including left ventricular hypertrophy (LVH), increased carotid intima-media thickness, and increased arterial stiffness.(3-6) Although hypertension in young adults has also been associated with lower scores on tests of cognitive performance compared with scores in matched normotensive controls(7-9), there have been only very limited assessments of hypertensive target organ effects on the brain in children. Instead, older descriptions were limited to gross neurologic events, such as facial palsy, seizure, and stroke, in children with malignant hypertension.(10) Other studies provide emerging
evidence that children with primary hypertension score lower on measures of neurocognition compared with normotensive controls, a pattern that is similar to young adults with
hypertension.(11) These preliminary studies in children, however, have been limited mostly to database and single-center studies.(12-14) Further study of neurocognition in children with hypertension is needed to determine both the short-term impact of childhood
hypertension on the child’s brain as well as long-term effects, into adulthood, and to assess the degree to which any effects can be minimized or reversed.
We have established a prospective, multicenter study of neurocognition in children with primary hypertension.(15) Our specific aims are to compare the performance on
neurocognitive testing of newly diagnosed, subjects with untreated hypertension to that of the performance of matched normotensive controls at baseline, and to evaluate the effect of 1-year of antihypertensive therapy on neurocognitive test performance. Here, we report the results of the baseline comparison of the neurocognitive test performance of subjects with hypertension and normotensive controls. Consistent with the emerging pediatric literature and the existing adult studies, we hypothesize that children with primary hypertension will
A
uthor Man
uscr
ipt
A
uthor Man
uscr
ipt
A
uthor Man
uscr
ipt
A
uthor Man
uscr
show significantly lower neurocognitive functions when compared with a matched control group of normotensive, healthy peers, particularly in the area of executive functioning.
Methods
Participating recruitment sites included the University of Rochester, Emory University, Maimonides Medical Center, and the University of Texas Medical School at Houston. A total of seventy-five newly diagnosed, children aged 10 – 18 years old with untreated hypertension, were enrolled through the Pediatric Hypertension Clinics at each site. All subjects with hypertension were required to have clinic blood pressure (BP) ≥95th
percentile(6) and sustained hypertension confirmed by 24-hour ambulatory BP monitoring (ABPM). For comparison, 75 normotensive, healthy 10-18 year old children were enrolled from participating general pediatrics and family medicine practices. Control subjects were required to have clinic BP < 95th percentile and normotension confirmed by ABPM. The control group was frequency matched to the group with hypertension for maternal education (less than high school, high school, college, beyond college), sex, and proportion with obesity (body mass index [BMI] ≥95th percentile). Matching for maternal education and obesity was done because both factors are known to have potential influence on cognitive outcomes (16, 17), and children with hypertension often are obese. Controls were matched to the hypertension subjects for sex because hypertension subjects recruited from patients referred for hypertension evaluation are more frequently male.(18) Exclusion criteria included being on medication for attention-deficit/hyperactivity disorder (ADHD), the presence of a pre- existing learning problem/disability (defined as having an Individual Educational Plan or Section 504 Plan at school), any disorder of cognitive impairment, history of chelation treatment for elevated lead level, history of chronic disease (known renal, cardiovascular, gastrointestinal tract, hepatic, endocrine, or rheumatologic disease), pregnancy or breast feeding, previous sleep study diagnosis of obstructive sleep apnea, a diagnosis of secondary hypertension, and previous or current treatment with
antihypertensive medication. Subjects with morbid obesity, a group more likely to have unrecognized obstructive sleep apnea, were not excluded. The study was approved by the Institutional Review Board of each site, and parental permission obtained, as well as subject assent, when appropriate.
Neurocognitive Assessment
Measurements from the baseline neurocognitive assessment were analyzed in this report and included both laboratory performance-based measures and behavior rating scales.
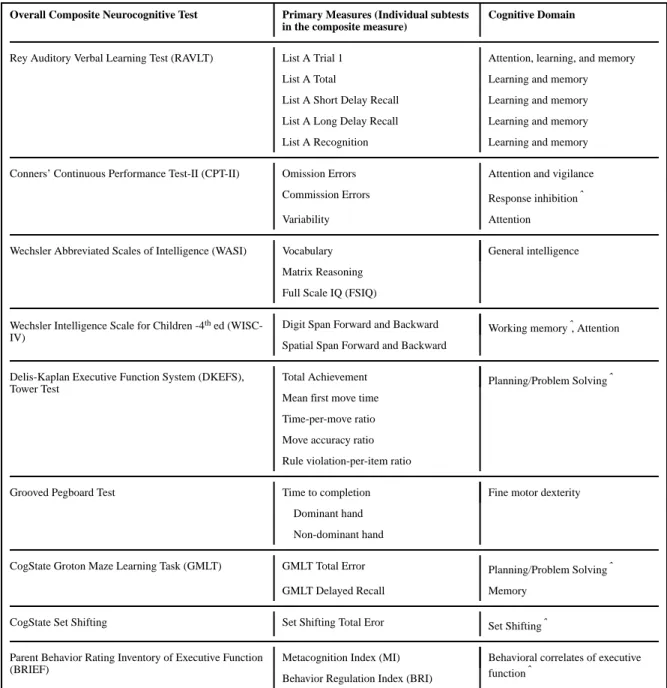
Laboratory measures of executive function included tests of problem solving/planning, set-shifting, response inhibition, vigilance, and working memory. Behavior ratings of executive function included the Behavior Rating Inventory of Executive Function (BRIEF) completed by the parent. In addition to measures of executive function, the neurocognitive test battery included assessments of verbal learning and memory, attention, fine-motor dexterity, and general intellectual functioning. Table I lists the neurocognitive tests along with the primary variables for each test and the cognitive domain assessed.
A
uthor Man
uscr
ipt
A
uthor Man
uscr
ipt
A
uthor Man
uscr
ipt
A
uthor Man
uscr
In addition, mood symptoms were evaluated with the child self-report measures of the Multidimensional Anxiety Scale for Children (MASC) and the Child Depression Inventory (CDI). Lastly, because daytime sleepiness and sleep disorders are associated with cognitive dysfunction as well as obesity, parents completed the Sleep-Related Breathing Disorder scale of the Pediatric Sleep Questionnaire (PSQ-SRBD) as an estimate of disordered sleep. (19, 20) These rating scales were examined to determine the need for covarying these variables in the data analyses, because sleep and mood can influence neurocognitive function.
Other Measures and Procedures
All subjects underwent ABPM at baseline according to published American Heart Association guidelines utilizing the Spacelabs 90217 oscillometric monitor.(21) Blood pressure measurements were recorded every 20 minutes for the entire 24-hour period, and wake and sleep periods were determined by patient diary. A minimum of 40 total readings were required for the study to be considered valid without a minimum number of readings per hour requirement. BP load was defined as the percentage of readings above the 95th percentile for ambulatory norms in the 24-hr period. Subjects with hypertension were required to have sustained ambulatory hypertension, defined as mean wake or sleep systolic (SBP) or diastolic (DBP) ≥95th percentile for ambulatory norms. A subject with
hypertension could also be included if the mean ambulatory BP was < 95th percentile, but the subject had both BP load > 25% (ambulatory prehypertension) and left ventricular hypertrophy (LVH) on echocardiogram. Control subjects were required to have mean wake and sleep SBP and DBP < 95th percentile and 24hr BP load < 25% to be included.(21)
Subjects with hypertension underwent baseline echocardiography, which was read centrally at the University of Rochester. Control subjects did not have echocardiography. Left ventricular mass indexed to height2.7 was determined by the area-length method according to standards published by the American Society of Echocardiography.(22) Left ventricular hypertrophy was defined as left ventricular mass index (LVMI) ≥ the 95th percentile for age and sex.(23)
Because hyperinsulinemia,(24) hyperlipidemia,(25) and chronic inflammation(26) have been associated with cognitive deficits in adults, both hypertension and control subjects had baseline central laboratory evaluation including fasting lipid profile, insulin level, glucose, and C-reactive protein (CRP). Homeostatic model assessment for insulin resistance (HOMA-IR) was calculated as glucose × insulin/405.
Statistical Analyses
Patient characteristics were compared between the group with hypertension and
normotensive controls using 2-sample t-tests for continuous variables and the Fisher exact test for categorical variables. For variables with distributions violating assumptions of normality, Wilcoxon rank sum tests were used. Ordinal variables were tested using Cochran Mantel Haenszel statistics. Results are reported as mean ± standard deviation (SD), or median and interquartile range where appropriate. The association between hypertension and neurocognitive measures was evaluated using multivariate mixed-effects regression analyses
A
uthor Man
uscr
ipt
A
uthor Man
uscr
ipt
A
uthor Man
uscr
ipt
A
uthor Man
uscr
using SAS Proc Mixed with unstructured covariance matrix for estimation. This statistical approach remains unaffected by randomly missing data. For measures with significant skewed distribution, such as CogState, Grooved Pegboard, and D-KEFS Tower, generalized estimating equations (GEE) were used to compare between subject groups. GEE is a semi-parametric approach that estimates robust standard errors empirically with fewer
distributional assumptions while accounting for the within subject correlations at the same time. We first evaluated the association between hypertension and the overall composite neurocognitive measures. Then, for overall composite neurocognitive measures with significant main effects of hypertension on the neurocognitive test results, a separate multivariate analysis was performed for each individual subtest included in that overall composite neurocognitive measure. The overall neurocognitive measures and the individual subtests included in the analyses are listed in Table I. Separate multivariate analyses were also performed for the Wechsler Abbreviated Scales of Intelligence (WASI) Full Scale IQ and the Parent BRIEF Behavioral Regulation Index (BRI) and Metacognition Index (MI), with these summary scores as dependent variables. Covariates for all models included age and socioeconomic status (maternal education, household income, race, ethnicity) as well as demographic and laboratory variables found to be imbalanced between groups, with p < 0.15. Demographic variables of interest for this analysis included age in years, sex, maternal education (less than high school, high school, college, or beyond college), household annual income (< $25,000 ≥ $25,000 to < $75,000, > $75,000), self-reported race (African
American versus non–African American), self-reported ethnicity (Hispanic versus non-Hispanic), body mass index (BMI) z-score, obesity (BMI percentile ≥ 95), MASC Total T-score, CDI Total T-T-score, and PSQ-SRBD score. We also examined the association of severity of hypertension (control vs mild-to-moderate vs severe) on neurocognitive measures. Mild-to-moderate hypertension was defined as SBP load ≥ 25% but < 50%, no LVH), and severe hypertension was defined as SBP load ≥ 50% and/or the presence of LVH. The significance level of the data analysis was set at 0.05. Analyses were performed with SAS (version 9.3, SAS Institute Inc; Cary, North Carolina).
Results
Seventy-five subjects with hypertension and 75 normotensive control subjects were enrolled. Of the 75 subjects with hypertension, 73 were included by having mean wake or sleep BP ≥95th percentile for ambulatory norms. Only 2 subjects with hypertension were included with the alternate criteria of mean ambulatory BP < 95th percentile but BP load > 25% and LVH on echocardiogram. Because the number of subjects with hypertension included under the alternate criteria was so small, all 75 hypertension subjects were combined for all analyses. Table II shows the comparison of characteristics in subjects with hypertension and controls. As expected by the matching criteria, the group with hypertension and
normotensive controls were similar in sex, maternal education, and percent with obesity. The groups were also similar in age, race, ethnicity, household income, and BMI z-score. Hypertension and control groups also had similar scores in the MASC and CDI scales, indicating similar levels of child-reported anxiety and depression, respectively. In contrast, the subjects with hypertension had a higher median PSQ-SRBD score, indicating more disordered sleep in the group with hypertension. By design, the groups differed in baseline
A
uthor Man
uscr
ipt
A
uthor Man
uscr
ipt
A
uthor Man
uscr
ipt
A
uthor Man
uscr
ABPM measurements. Analysis of laboratory evaluation showed that the groups were similar in total cholesterol, LDL-cholesterol, HDL-cholesterol, insulin level, HOMA-IR, glucose, and CRP. The group with hypertension had a higher triglyceride level than controls. Nine of 75 (12%) subjects with hypertension had LVH. Of the 75 subjects with
hypertension, 51 (68%) were characterized as having severe hypertension, defined as a SBP load ≥ 50% and/or LVH.
Group Differences on Neurocognitive Functioning
The principal findings are shown in Table III, including the unadjusted comparison of test scores for subjects with hypertension and controls, and the results of multivariate analyses for the individual subtests for composite neurocognitive measures found to show an overall main effect for hypertension. Comprehensive results for the composite neurocognitive measures not found to show an overall main effect for hypertension are shown in Table IV (available at www.jpeds.com). Multivariate analyses showed an overall main effect of hypertension on worse neurocognitive test performance for the composite Rey Auditory Verbal Learning Test (RAVLT, β = -1.13, β SE = 0.44, p = 0.012), composite CogState Groton Maze Learning Test (CogState GMLT, β = 4.2, β SE = 1.96, p = 0.031), and the Wechsler Abbreviated Scales of Intelligence Full Scale IQ (WASI FSIQ, β = -4.1, β SE = 1.97, p = 0.038). In contrast, there was not a significant independent association between hypertension and neurocognitive test performance for the composite Conners’ Continuous Performance Test-II (CPT-II), Wechsler Intelligence Scale – Fourth edition (WISC-IV) Digit Span and Spatial Span, composite Grooved Pegboard, CogState Set Shifting, or the
composite Delis-Kaplan Executive Function System (D-KEFS) Tower test. To summarize, hypertension was associated with worse performances on overall measures of verbal (RAVLT) and visual (CogState GMLT) learning and recall, and on a measure of verbal and visual reasoning (WASI). Hypertension was not associated with performance on tasks of vigilance and visuomotor reaction time (CPT-II), auditory and visual attention and working memory (WISC-IV Digit Span; Spatial Span), and tasks of problem solving, planning, and set shifting between different problem-solving rules (DKEFS Tower Test; CogState Set Shifting).
Given the significance of the overall composite tests for RAVLT, CogState GMLT, and WASI FSIQ, separate multivariate analysis was performed for each individual subtest included in the overall composite neurocognitive measure. The RAVLT evaluates learning and recall for verbal information; subjects are presented with a word list and asked to learn and then subsequently recall the list. Independent, unaided recall is evaluated twice, both immediately after all learning tasks are completed (Short Delay recall), and again after an approximately 20 minute delay during which intervening tasks are presented (Long Delay recall). Subsequently, a Recognition task is completed in which subjects must choose the initial target words from among a longer list that is presented by the examiner. The independent recall tasks (short and long delay) are considered more cognitively demanding than the Recognition task, as subjects are required to implement their own strategy to retrieve the words from memory, without any prompts or cues from the examiner. For the RAVLT, hypertension remained independently associated with worse performance on List A Trial 1 (a measure of initial learning and of auditory attention), List A total (a composite
A
uthor Man
uscr
ipt
A
uthor Man
uscr
ipt
A
uthor Man
uscr
ipt
A
uthor Man
uscr
measure of total learning across all five learning trials), and List A short delay recall, and there was a trend toward worse performance on List A long delay recall (Table III). In contrast, there was no difference between the group with hypertension and controls in List A Recognition.
For CogState GMLT, hypertension remained independently associated with worse
performance on the Groton Maze Learning Test Delayed Recall Task. In contrast, there was no difference between groups for Groton Maze Learning Test Total Error. For the WASI, hypertension was significantly associated with lower scores on Vocabulary, but there was no difference between groups for Matrix Reasoning. Although the composite Grooved
Pegboard measure did not show a significant difference between groups, subjects with hypertension performed worse on the Grooved Pegboard dominant hand subtest, indicating that subjects with hypertension showed worse fine motor dexterity compared with control subjects (Table IV).
Parents completed the Parent BRIEF (ratings of executive function in everyday settings) and the PSQ-SRBD (rating of disordered sleep). For the Parent BRIEF, unadjusted analysis showed that subjects with hypertension scored significantly higher (worse) than
normotensive controls on the Behavior Regulation Index (BRI, 50.4 ± 11 vs 45.9 ± 7.6, p = 0.004), but there was no difference between groups on the Metacognition Index (MI, 50.7 ± 10.3 vs 48.2 ± 8.9, p = 0.12). However, multivariate analysis revealed that the BRI score of the group with hypertension was not significantly different from that of control subjects (β = 1.95, p = 0.19), after adjustment for PSQ-SRBD score (β = 29.9, p < 0.001), age (β = -0.07, p = 0.84), maternal education (β = -1.3, p = 0.6), household income (β = -1.1, p = 0.26), race (β = -1.9, p = 0.28), ethnicity (β = -0.14, p = 0.94), sex (β = -1.4, p = 0.37) triglyceride (β = -0.002, p = 0.85), and glucose (β = -1.3, p = 0.24). Because of the strong influence of PSQ-SRBD score on BRI score and the higher median PSQ-PSQ-SRBD score in subjects with hypertension compared with control subjects, the potential interaction between PSQ-SRBD score and hypertension was examined. Repeat multivariate analysis for BRI, adding an interaction term for SRBD x hypertension, showed a significant interaction of PSQ-SRBD and hypertension on BRI score (interaction term, p = 0.04), such that the association between increased disordered sleep and worse executive function was more pronounced in subjects with hypertension than in normotensive subjects (Figure; available at
www.jpeds.com).
In order to examine the association between the degree of severity of hypertension and cognition, separate analyses were performed for the individual subtests of the RAVLT, CogState, and WASI for which hypertension was independently associated with worse performance. For these analyses, the hypertension variable was separated into mild-to-moderate hypertension (SBP load ≥ 25% but < 50%, no LVH) and severe hypertension (SBP load ≥ 50% and/or LVH). For the RAVLT and CogState tests, the moderate hypertension group scored better than the severe hypertension group, but worse than the control group: RAVLT List A Trial 1, moderate hypertension mean difference: -0.39, p = 0.34, severe hypertension mean difference: -0.67, p = 0.027; RAVLT List A Total: moderate hypertension mean difference: -1.8, p = 0.32, severe hypertension mean difference: -3.8, p = 0.005; RAVLT List A short delay recall, moderate hypertension mean difference: - 0.65, p=0.33,
A
uthor Man
uscr
ipt
A
uthor Man
uscr
ipt
A
uthor Man
uscr
ipt
A
uthor Man
uscr
severe hypertension mean difference : -1.3, p = 0.007; CogState GMLT delayed recall, moderate hypertension mean difference: 1.3, p=0.47, control severe hypertension mean difference : 4.4, p < 0.001. In contrast, there was no difference in WASI Vocabulary results by severity of hypertension (data not shown).
Discussion
We found that children with newly diagnosed, untreated sustained primary hypertension had decreased performance on neurocognitive measures of attention, learning, memory, and fine motor dexterity compared with a contemporaneous normotensive control group well matched for maternal education, race, ethnicity, age, sex, insulin resistance, inflammation (CRP levels), negative affect, and obesity. The differences remained significant after adjusting for socioeconomic status, age, and imbalances between groups in sex, parent ratings of disordered sleep, triglyceride levels, and glucose levels. Specifically, hypertension was independently associated with worse performance on subtests of the Rey Auditory Verbal Learning Test and the delayed (visual) recall task of the CogState Groton Maze Learning Test, both primarily measures of memory, as well as the Grooved Pegboard dominant hand subtest, a measure of manual dexterity. In addition, the hypertension group had lower scores on WASI Vocabulary, a finding that is conceptually consistent with the increased prevalence of learning disabilities previously described in children with primary hypertension.(27) The effect sizes of the group differences were modest, but increased when the hypertension group was limited to subjects with severe ambulatory hypertension and/or LVH, suggesting a dose effect of hypertension on neurocognitive test performance.
Subjects with hypertension also scored worse on parent ratings of executive function (parent BRIEF BRI), but this difference did not persist after adjustment for confounders, a result largely attributable to the impact of disordered sleep. Despite excluding children with a previous sleep study diagnosis of obstructive sleep apnea, the group with hypertension had higher parent ratings of disordered sleep compared with the normotensive group, as measured by the PSQ-SRBD scale. Children with primary hypertension have an increased prevalence of disordered sleep, an entity itself associated with cognitive problems. Therefore, disordered sleep potentially confounds the relation between hypertension and cognition. We found that subjects with increased disordered sleep (higher PSQ-SRBD score) were more likely to have higher (worse) Parent BRI scores, a finding consistent with previous studies showing that disordered sleep is associated with problems with executive function, and perhaps reflected in daytime sleepiness.(20) However, we also found a significant interaction between hypertension and disordered sleep on Parent BRIEF BRI scores, suggesting that children with disordered sleep are more likely to have problems with decreased executive functioning skills if they also have hypertension. The Parent BRIEF BRI rates behaviors that reflect the child’s ability to control impulses, move freely from one situation to another, alter problem-solving strategies, and modulate emotional responses.(28) These results underscore the complex inter-relation of the effects of hypertension and disordered sleep on cognition, especially on the behavioral manifestations of executive function, suggesting the importance of sleep to general regulatory functions in day-to-day life.
A
uthor Man
uscr
ipt
A
uthor Man
uscr
ipt
A
uthor Man
uscr
ipt
A
uthor Man
uscr
Adults with hypertension score lower on neurocognitive testing compared with normotensive controls, a finding felt to potentially represent an early manifestation of hypertensive target organ damage to the brain.(7, 8, 29) Observations from the literature on neurocognitive testing in adults with hypertension provided guidance for the design of the current study of cognition in children with hypertension. Reports have shown a more pronounced difference in neurocognitive test performance between subjects with hypertension and normotensive controls when young adults are studied compared with studies of middle-aged or older adults,(8) a finding which lends biological plausibility to the presence of a hypertension-cognition link in children and adolescents. Young adults with hypertension demonstrate performance deficits most consistently in the domains of learning and memory, attention, mental flexibility, abstract reasoning, and fine motor dexterity.(7) However, few young adults with hypertension are cognitively impaired. Instead, the effect size of the difference in performance on neurocognitive testing between adults with hypertension and normotensive groups is often small to medium, and absolute scores fall within the broad normal range of the tests(25)—findings mirroring the results of the current study. Therefore, the current study was designed to detect relatively small differences between groups with emphasis on the domains of memory, attention, and executive function. Study strategies have been described(15) and included close matching of the groups for characteristics that were likely to influence more strongly neurocognitive test performance (i.e. maternal education) and exclusion of subjects with pathologic processes that could potentially overshadow the smaller cognitive effects of hypertension (ie, ADHD, learning problems/disability, previous sleep study with obstructive sleep apnea) in an effort to isolate the effects of hypertension on neurocognitive outcomes.
This multicenter study provides confirmation of previous preliminary, single center and database reports that first suggested that children with primary hypertension have performance deficits on neurocognitive testing in comparison with a rigorously matched normotensive control group. Althogh the cross sectional nature of the current analysis limits inference regarding causality between hypertension and the lower neurocognitive test performance, the similarity in pattern between our findings and those reported in young adults with hypertension, along with the presence of a dose effect of the severity of hypertension on the neurocognitive findings, suggests that these findings potentially represent early hypertensive target organ damage to the brain. Future results from this study on the effects of antihypertensive medication on neurocognitive test performance will provide further data to establish whether these effects are causative.
The practical implications of the significantly lower performance on measures of attention, memory, and executive functions demonstrated in this study are not known, but our results raise both short-term and long-term concerns. The finding of demonstrable differences between groups, albeit modest, is striking given that youth with hypertension are at the earliest stage of their disease process and given the large number of variables that were accounted for, either by matching or statistically in the data analyses. In addition, hypertension in youth often clusters with other cardiovascular risk factors that may have further negative effects on cognition, including obstructive sleep apnea, metabolic syndrome, insulin resistance, hyperlipidemia, and chronic inflammation.(6) Furthermore, minority youth are at particular risk of developing hypertension,(30) a group already at risk for
A
uthor Man
uscr
ipt
A
uthor Man
uscr
ipt
A
uthor Man
uscr
ipt
A
uthor Man
uscr
academic difficulties. We postulate that together the cognitive effects of these cardiovascular risk factors may present challenges to some youth with hypertension, especially in the context of the cognitively challenging environment of school.
Longitudinal studies have suggested that hypertension from mid-life onward predicts the development of cognitive decline in late life.(31, 32) More recently, investigators of the Coronary Artery Risk Development in Young Adults (CARDIA) Study showed that longitudinal exposure to systolic hypertension in early adulthood is associated with worse mid-life cognitive performance.(33) Subjects with hypertensive (age, 18 – 30 years at baseline) with 25 years of follow-up demonstrated worse performance in tests of processing speed, executive function, and delayed memory (as assessed by the Rey Auditory Verbal Learning Test delayed recall task, the same cognitive task that featured prominently in our results). Increased fasting blood sugar and total cholesterol were also predictive of mid-life cognitive test performance. The authors suggested that young adults with elevated
cardiovascular risk factors may be a promising target group for early intervention to lessen and/or delay later cognitive decline.(33) Our data suggest that the relation between
hypertension and decreased cognitive test performance c a n extend even further back in age, into adolescence, and suggests the possibility that intervention addressing hypertension and other cardiovascular risk factors during youth may represent an early opportunity to impact cognitive challenges later in life.
The current study has several limitations. There was no neuroimaging component, so we cannot discern the physiologic or anatomic basis for the lower neurocognitive test
performance in children with hypertension. We excluded children with prehypertension and white-coat hypertension, so that we cannot evaluate the potential neurocognitive effects of these more mild but higher prevalent forms of elevations in blood pressure. By excluding subjects on medication for ADHD and those with a learning disability, we may have minimized the difference between groups and lost the opportunity to evaluate the potential contribution of hypertension to the development of these more overt learning problems; however, we were trying to isolate the effects of hypertension on neurocognition, so we purposely excluded such subjects.
In summary, our data on an extremely well characterized group of children and adolescents with primary hypertension demonstrated significantly lower performance on neurocognitive testing compared with matched normotensive controls. In particular, significant differences were identified in measures of memory and attention/executive functions. These results suggest that hypertension in youth may have an impact on brain function, and perhaps brain development in childhood. Future results from this study will assess the degree to which these effects can be minimized or reversed with antihypertensive therapies.
Acknowledgments
We thank the study coordinators at each participating center.
Funded by the National Heart, Lung, and Blood Institute (R01HL098332 [to M.L.]).
A
uthor Man
uscr
ipt
A
uthor Man
uscr
ipt
A
uthor Man
uscr
ipt
A
uthor Man
uscr
References
1. Ogden CL, Carroll MD, Kit BK, Flegal KM. Prevalence of childhood and adult obesity in the united states, 2011-2012. JAMA. 2014 Feb 26.311:806–14. [PubMed: 24570244]
2. McNiece KL, Poffenbarger TS, Turner JL, Franco KD, Sorof JM, Portman RJ. Prevalence of hypertension and pre-hypertension among adolescents. J Pediatr. 2007 Jun.150:640,4–644.e1. [PubMed: 17517252]
3. Lande MB, Carson NL, Roy J, Meagher CC. Effects of childhood primary hypertension on carotid intima media thickness: A matched controlled study. Hypertension. 2006 Jul.48:40–4. [PubMed: 16735644]
4. McNiece KL, Gupta-Malhotra M, Samuels J, Bell C, Garcia K, Poffenbarger T, et al. Left ventricular hypertrophy in hypertensive adolescents: Analysis of risk by 2004 national high blood pressure education program working group staging criteria. Hypertension. 2007 Aug.50:392–5. [PubMed: 17592068]
5. Urbina EM, Khoury PR, McCoy C, Daniels SR, Kimball TR, Dolan LM. Cardiac and vascular consequences of pre-hypertension in youth. J Clin Hypertens (Greenwich). 2011 May.13:332–42. [PubMed: 21545394]
6. National High Blood Pressure Education Program Working Group on High Blood Pressure in Children and Adolescents. The fourth report on the diagnosis, evaluation, and treatment of high blood pressure in children and adolescents. Pediatrics. 2004 Aug; 114(2 Suppl 4th Report):555–76. [PubMed: 15286277]
7. Waldstein SR. Hypertension and neuropsychological function: A lifespan perspective. Exp Aging Res. 1995 Oct-Dec;21:321–52. [PubMed: 8595801]
8. Waldstein SR, Jennings JR, Ryan CM, Muldoon MF, Shapiro AP, Polefrone JM, et al. Hypertension and neuropsychological performance in men: Interactive effects of age. Health Psychol. 1996 Mar. 15:102–9. [PubMed: 8681917]
9. Suhr JA, Stewart JC, France CR. The relationship between blood pressure and cognitive performance in the third national health and nutrition examination survey (NHANES III). Psychosom Med. 2004 May-Jun;66:291–7. [PubMed: 15184686]
10. Bricker, JT. Hypertension. In: McMillian, JA.; Feigin, RD.; DeAngelis, C.; Jones, MD., editors. Oski’s Pediatrics: Principles and Practice. 4. Philadelphia, PA: Lippincott, Williams, and Wilkins; 2006.
11. Lande MB, Kupferman JC, Adams HR. Neurocognitive alterations in hypertensive children and adolescents. J Clin Hypertens (Greenwich). 2012 Jun.14:353–9. [PubMed: 22672088] 12. Lande MB, Adams H, Falkner B, Waldstein SR, Schwartz GJ, Szilagyi PG, et al. Parental
assessment of executive function and internalizing and externalizing behavior in primary hypertension after anti-hypertensive therapy. J Pediatr. 2010 Jul.157:114–9. [PubMed: 20227722] 13. Lande MB, Adams H, Falkner B, Waldstein SR, Schwartz GJ, Szilagyi PG, et al. Parental
assessments of internalizing and externalizing behavior and executive function in children with primary hypertension. J Pediatr. 2009; 154:207–212. [PubMed: 18823913]
14. Lande MB, Kaczorowski JM, Auinger P, Schwartz GJ, Weitzman M. Elevated blood pressure and decreased cognitive function among school-age children and adolescents in the united states. J Pediatr. 2003 Dec.143:720–4. [PubMed: 14657815]
15. Lande MB, Adams HR, Kupferman JC, Hooper SR, Szilagyi PG, Batisky DL. A multicenter study of neurocognition in children with hypertension: Methods, challenges, and solutions. J Am Soc Hypertens. 2013 Sep-Oct;7:353–62. [PubMed: 23792121]
16. Waldstein SR, Katzel LI. Interactive relations of central versus total obesity and blood pressure to cognitive function. Int J Obes (Lond). 2006 Jan.30:201–7. [PubMed: 16231030]
17. Hooper SR, Gerson AC, Butler RW, Gipson DS, Mendley SR, Lande MB, et al. Neurocognitive functioning of children and adolescents with mild-to-moderate chronic kidney disease. Clinical Journal of The American Society of Nephrology: CJASN. 2011 Aug.6:1824–30. [PubMed: 21737850]
A
uthor Man
uscr
ipt
A
uthor Man
uscr
ipt
A
uthor Man
uscr
ipt
A
uthor Man
uscr
18. Sorof JM, Turner J, Franco K, Portman RJ. Characteristics of hypertensive children identified by primary care referral compared with school-based screening. J Pediatr. 2004 Apr.144:485–9. [PubMed: 15069397]
19. Chervin RD, Hedger K, Dillon JE, Pituch KJ. Pediatric sleep questionnaire (PSQ): Validity and reliability of scales for sleep-disordered breathing, snoring, sleepiness, and behavioral problems. Sleep Med. 2000; 1:21–32. [PubMed: 10733617]
20. Owens JA. Neurocognitive and behavioral impact of sleep disordered breathing in children. Pediatr Pulmonol. 2009 May.44:417–22. [PubMed: 19382210]
21. Flynn JT, Daniels SR, Hayman LL, Maahs DM, McCrindle BW, Mitsnefes M, et al. Update: Ambulatory blood pressure monitoring in children and adolescents: A scientific statement from the american heart association. Hypertension. 2014 May.63:1116–35. [PubMed: 24591341]
22. Lang RM, Bierig M, Devereux RB, Flachskampf FA, Foster E, Pellikka PA, et al. Recommendations for chamber quantification: A report from the american society of
echocardiography’s guidelines and standards committee and the chamber quantification writing group, developed in conjunction with the european association of echocardiography, a branch of the european society of cardiology. J Am Soc Echocardiogr. 2005 Dec.18:1440–63. [PubMed: 16376782]
23. Khoury PR, Mitsnefes M, Daniels SR, Kimball TR. Age-specific reference intervals for indexed left ventricular mass in children. Journal of the American Society of Echocardiography. 2009 Jun. 22:709–14. [PubMed: 19423289]
24. Yau PL, Castro MG, Tagani A, Tsui WH, Convit A. Obesity and metabolic syndrome and functional and structural brain impairments in adolescence. Pediatrics. 2012 Oct.130:e856–64. [PubMed: 22945407]
25. Waldstein, SR.; Snow, J.; Muldoon, MF.; Katzel, LI. Neuropsychological consequences of cardiovascular disease. In: Tarter, RE.; Butters, M.; Beers, SR., editors. Medical Neuropsychology. 2. New York: Kluwer Academic/Plenum Publishers; 2001. p. 51-83.
26. Marsland AL, Petersen KL, Sathanoori R, Muldoon MF, Neumann SA, Ryan C, et al. Interleukin-6 covaries inversely with cognitive performance among middle-aged community volunteers. Psychosom Med. 2006 Nov-Dec;68:895–903. [PubMed: 17132839]
27. Adams HR, Szilagyi PG, Gebhardt L, Lande MB. Learning and attention problems among children with pediatric primary hypertension. Pediatrics. 2010 Dec.126:e1425–9. [PubMed: 21059718] 28. Straus, E.; sherman, EMS.; spreen, O., editors. A compendium of neuropsychological tests:
administration, norms, and commentary. 3. New York: Oxford University Press; 2006. 29. Jennings JR, Muldoon MF, Ryan C, Price JC, Greer P, Sutton-Tyrrell K, et al. Reduced cerebral
blood flow response and compensation among patients with untreated hypertension. Neurology. 2005 Apr 26.64:1358–65. [PubMed: 15851723]
30. Samuels, J.; Negroni-Balasquide, X.; Bell, C. Ethnic differences in childhood blood pressure. In: Flynn, JT.; Ingelfinger, JR.; Portman, RJ., editors. Pediatric Hypertension. 3. New York: Humana Press; 2013.
31. Launer LJ, Ross GW, Petrovitch H, Masaki K, Foley D, White LR, et al. Midlife blood pressure and dementia: The honolulu-asia aging study. Neurobiol Aging. 2000 Jan-Feb;21:49–55. [PubMed: 10794848]
32. Swan GE, DeCarli C, Miller BL, Reed T, Wolf PA, Jack LM, et al. Association of midlife blood pressure to late-life cognitive decline and brain morphology. Neurology. 1998 Oct.51:986–93. [PubMed: 9781518]
33. Yaffe K, Vittinghoff E, Pletcher MJ, Hoang TD, Launer LJ, Whitmer R, et al. Early adult to midlife cardiovascular risk factors and cognitive function. Circulation. 2014 Apr 15.129:1560–7.
[PubMed: 24687777]
A
uthor Man
uscr
ipt
A
uthor Man
uscr
ipt
A
uthor Man
uscr
ipt
A
uthor Man
uscr
Figure 1.
The effect of hypertension on the relationship between PSQ-SRBD score and Parent BRIEF BRI T-scores (interaction term, p = 0.04). BRI scores and PSQ-SRBD scores are both plotted as continuous variables.
A
uthor Man
uscr
ipt
A
uthor Man
uscr
ipt
A
uthor Man
uscr
ipt
A
uthor Man
uscr
A
uthor Man
uscr
ipt
A
uthor Man
uscr
ipt
A
uthor Man
uscr
ipt
A
uthor Man
uscr
ipt
Table 1
Neurocognitive Test Battery
Overall Composite Neurocognitive Test Primary Measures (Individual subtests in the composite measure)
Cognitive Domain
Rey Auditory Verbal Learning Test (RAVLT) List A Trial 1 Attention, learning, and memory List A Total Learning and memory List A Short Delay Recall Learning and memory List A Long Delay Recall Learning and memory List A Recognition Learning and memory
Conners’ Continuous Performance Test-II (CPT-II) Omission Errors Attention and vigilance Commission Errors Response inhibitionˆ
Variability Attention
Wechsler Abbreviated Scales of Intelligence (WASI) Vocabulary General intelligence Matrix Reasoning
Full Scale IQ (FSIQ)
Wechsler Intelligence Scale for Children -4th ed
(WISC-IV)
Digit Span Forward and Backward Working memoryˆ, Attention Spatial Span Forward and Backward
Delis-Kaplan Executive Function System (DKEFS), Tower Test
Total Achievement Planning/Problem Solvingˆ Mean first move time
Time-per-move ratio Move accuracy ratio Rule violation-per-item ratio
Grooved Pegboard Test Time to completion Fine motor dexterity Dominant hand
Non-dominant hand
CogState Groton Maze Learning Task (GMLT) GMLT Total Error Planning/Problem Solvingˆ
GMLT Delayed Recall Memory
CogState Set Shifting Set Shifting Total Eror Set Shiftingˆ
Parent Behavior Rating Inventory of Executive Function (BRIEF)
Metacognition Index (MI) Behavioral correlates of executive functionˆ
Behavior Regulation Index (BRI)
ˆ
A
uthor Man
uscr
ipt
A
uthor Man
uscr
ipt
A
uthor Man
uscr
ipt
A
uthor Man
uscr
ipt
Table 2
Demographic characteristics of the group with hypertension and normotensive controls
Characteristic Hypertensio n N = 75 Normotensive controls N = 75 P value
Male, % 76 63.5 0.097
Maternal Education, % 0.99
< High School 13.3 13.3
High School 40 37.3
College 38.7 44
> College 8 5.3
Obese, % 66 72 0.49
BMI z-score 2.07 (1.25, 2.51) 1.98 (1.52, 2.31) 0.39
Age, y 15.1 ± 2.2 15.4 ± 1.9 0.35
African American, % 26 24 0.73
Hispanic, % 14 11 0.51
Household income, % 0.35
< $25,000 36 21.3
25,000 to < 75,000 29.3 46.7
> 75,000 34.7 32
PSQ-SRBD score 0.14 (0.06, 0.35) 0.12 (0.05, 0.23) 0.04
Total cholesterol, mg/dl 159 ± 40 154 ± 29 0.38
LDL cholesterol, mg/dl 91± 29 87 ± 26 0.32
HDL cholesterol, mg/dl 46 ± 12 48 ± 12 0.19
Triglyceride, mg/dl 119 ± 85 94 ± 56 0.037
Glucose, mg/dl 89.9 ± 7.2 91.6 ± 6.5 0.13
Insulin, mlU/L 21.3 ± 14.5 22.9 ± 16 0.53
HOMA-IR 4.79 ± 3.44 5.18 ± 3.8 0.50
CRP, mg/L 0.80 (0.4, 2.8) 1.3 (0.6, 3.8) 0.35
MASC Total T-score 47.1 ± 10 48.1 ± 8.5 0.51
CDI Total T-score 44.2 ± 8.8 44.3 ± 9.5 0.91
24 hr SBP Load, % 56.5 ± 17.6 6.6 ± 6.7 < 0.001
A
uthor Man
uscr
ipt
A
uthor Man
uscr
ipt
A
uthor Man
uscr
ipt
A
uthor Man
uscr
ipt
A
uthor Man
uscr
ipt
A
uthor Man
uscr
ipt
A
uthor Man
uscr
ipt
A
uthor Man
uscr
ipt
T ab le 3Unadjusted comparison of test scores and multi
v
ariate results for indi
vidual subtests for neurocogniti
v
e measures with o
v
erall signif
icant main ef
fects for h ypertension. Neur ocogniti v e Measur eˆ Unadjusted Analysis Multi v ariate Analysis HTN scor e Contr ol scor e P v alue β f or HTN β SE f or HTN P v alue RA VL
T (total corr
ect)
-1.13
0.44
0.012
ˆ
List A T
rial 1
6.2 ± 1.6
6.8 ± 1.5
0.012
-0.58
0.27
0.034
List A T
otal (T
rials 1– 5)
48.2 ± 7.5
51.1 ± 6.9
0.014
-3.25
1.24
0.009
List A Short Delay Recall
9.5 ± 2.7
10.6 ± 2.5
0.010
-1.12
0.44
0.013
List A Long Delay Recall
9.7 ± 2.7
10.5 ± 2.7
0.080
-0.83
0.46
0.075
List A Recognition
14.1 ± 1.8
14.1 ± 1.3
0.97 0.14 0.26 0.59 CogState GML T 4.2 1.96 0.031 ˆ GML T T otal Err or
58.9 ± 21.8
56.2 ± 20.4
0.60 3.8 3.3 0.25 GML T Delay
ed Recall Err
or
9.8 ± 8.1
7.1 ± 6.1
0.025
3.7
1.2
0.002
W
ASI Full Scale IQ
97.4 ± 11
101 ± 12.4
0.058 -4.1 2.0 0.038 V ocab ulary
47.4 ± 8.5
50.6 ± 9.6
0.033 -3.7 1.5 0.016 Matrix Reasoning 49.2 ±7.4
50.1 ± 8.2
0.49
-1.1
1.31
0.39
ˆ P v
alue for o
v
erall composite neurocogniti
v
e measure. F
or the Re
y Auditory V
erbal Learning T
est (RA
VL
T) and W
echsler Abbre
viated Scales of Intelligence (W
ASI), a higher score represents better
performance. F
or CogState, a lo
wer score represents better performance. All scores presented as mean ± SD.
All multi
v
ariate models were adjusted for age, maternal education, household income, African American race, Hispanic ethnicity
, PSQ-SRBD score, se
x, triglyceride le
v
el, and glucose le
v
A
uthor Man
uscr
ipt
A
uthor Man
uscr
ipt
A
uthor Man
uscr
ipt
A
uthor Man
uscr
ipt
T ab le 4Unadjusted and multi
v
ariate analyses results for neurocogniti
v
e measures without o
v
erall main ef
fect of h
ypertension. Neur ocogniti v e Measur e Unadjusted Analysis Multi v ariate Analysis HTN scor e Contr ol scor e P v alue β f or HTN β SE f or HTN P v alue CPT -II 2 1.2 0.10 ˆ Omission Err ors
49.4 ± 7.1
48.4 ± 7.3
0.42 2 1.3 0.11 Commission Err ors
53.4 ± 9.1
52.4 ± 11.3
0.55 1.3 1.8 0.46 V ariability
47.4 ± 9.7
46 ± 10.4
0.40 2.6 1.8 0.14 WISC-IV -0.19 0.32 0.56 ˆ
Spatial Span F
orward
9.0 ± 3.0
9.3 ± 2.7
0.53
-0.22
0.48
0.65
Spatial Span Backward
10.1 ± 2.5
10.3 ± 2.4
0.53
-0.12
0.41
0.77
Digit Span F
orward
8.9 ± 2.8
9.1 ± 3.1
0.66
-0.12
0.51
0.82
Digit Span Backward
9.4 ± 2.6
9.6 ± 2.8
0.60 -0.28 0.47 0.55 Gr oo v ed P egboard 2.4 2.1 0.26 ˆ Dominant hand
82.6 ± 19
77.2 ± 13.4
0.048 4.5 2.3 0.045 Non-dominant hand 87.6 ±17.7
86.5 ± 17.9
0.72
0.27
2.7
0.92
Cogstate Set Shifting
38.7 ± 16.4
37.9 ± 18.1
0.77 0.69 2.9 0.81 ˆ D-KEFS T o wer 0.03 0.17 0.87 ˆ T otal Achie v ement
9.3 ± 2.1
9.2 ± 2.5
0.72 0.14 0.39 0.73 Mean f irst mo v e time
11.0 ± 1.4
10.8 ± 1.6
0.56 0.13 0.26 0.62 T ime-per -mo v e ratio
9.9 ± 1.9
9.7 ± 2.0
0.46 0.17 0.34 0.62 Mo v
e accuracy ratio
7.9 ± 2.6
8.3 ± 2.9
0.46 0.15 0.47 0.75 Rule violation-per -item
9.4 ± 1.2
9.6 ± 1.3
0.54
0.14
0.22
0.53
ˆ P v
alue for o
v
erall composite neurocogniti
v
e measure. All scores reported as mean ± SD. F
or Conners’ Continuous Performance T
est-II (CPT
-II) and Groo
v
ed Pe
gboard, a lo
wer score represents better
performance. F
or W
echsler Intelligence Scale for Children -4
th ed (WISC-IV) and Delis- Kaplan Ex
ecuti
v
e Function System (DKEFS), T
o
wer T
est, a higher score represents better performance. All
multi
v
ariate models were adjusted for age, maternal education, household income, African American race, Hispanic ethnicity
, PSQ-SRBD score, se
x, triglyceride le
v
el, and glucose le
v