Transcending the prediction
paradigm: novel applications
of SHAPE to RNA function
and evolution
Katrina M. Kutchko
1,2and Alain Laederach
1,2*
Selective 20-hydroxyl acylation analyzed by primer extension (SHAPE) provides information on RNA structure at single-nucleotide resolution. It is most often used in conjunction with RNA secondary structure prediction algorithms as a probabilistic or thermodynamic restraint. With the recent advent of ultra-high-throughput approaches for collecting SHAPE data, the applications of this tech-nology are extending beyond structure prediction. In this review, we discuss recent applications of SHAPE data in the transcriptomic context and how this new experimental paradigm is changing our understanding of these experiments and RNA folding in general. SHAPE experiments probe both the secondary and tertiary structure of an RNA, suggesting that model-free approaches for within and comparative RNA structure analysis can provide significant structural insight without the need for a full structural model. New methods incorporating SHAPE at different nucleotide resolutions are required to parse these transcrip-tomic data sets to transcend secondary structure modeling with global structural metrics. These ‘multiscale’ approaches provide deeper insights into RNA global structure, evolution, and function in the cell. © 2016 The Authors.WIREs RNApublished by Wiley Periodicals, Inc.
How to cite this article:
WIREs RNA2017, 8:e1374. doi: 10.1002/wrna.1374
INTRODUCTION
A
s more than a mere messenger of information from DNA to protein, RNA molecules adopt structures that have functional biological roles.1–6 Traditionally, secondary structure predictions of RNA molecules from a single sequence minimize a free energy function to obtain a structural model of intramolecular base pairing,7–10 or samplesuboptimal structures from the partition func-tion.11,12 Evolutionary covariation, where two nucleotides vary in sequence across related RNAs while preserving base pairing ability, is particularly powerful for predicting structures, especially for bac-terial and archaeal RNAs or for highly conserved RNA structures.13–15Structure prediction algorithms, however, only predict about half of all base pairs that occur in an RNA,16,17and some alignments may not have enough information for covariation analy-sis.18 For these reasons, an experiment capable of rapidly probing RNA structure is particularly appealing.
Multiple quantitative methods to determine RNA structure experimentally are now available, such as selective 20-hydroxyl acylation analyzed by primer extension (SHAPE),19 quantitative dimethyl *Correspondence to: [email protected]
1Department of Biology, University of North Carolina at Chapel Hill, Chapel Hill, NC, USA
2Curriculum in Bioinformatics and Computational Biology, Uni-versity of North Carolina at Chapel Hill, Chapel Hill, NC, USA
Conflict of interest: The authors have declared no conflicts of inter-est for this article.
Volume 8, January/February 2017 1 of 12
sulfate (DMS) modification,20 and parallel analysis of RNA structure (PARS).5,21Each of these methods
provides information on the conformational fl exibil-ity of nucleotides in an RNA, either through chemical modification (SHAPE and DMS) or through enzy-matic probing (PARS). These quantitative probing techniques present a new paradigm in understanding RNA structure on a transcript-wide or greater scale.
The most common use for SHAPE data is as a restraint (also referred to as a soft constraint) in sec-ondary structure prediction algorithms.18,22–24 The
incorporation of SHAPE data into structure predic-tion algorithms refines the probable structure space of an RNA molecule and greatly improves predic-tions to approximately 90% accuracy.22,25Recently, SHAPE data collected in an ultra-high-throughput manner is increasingly used in a model-free approach as an additional feature for evolutionary analysis. In this review, we discuss these diverse approaches to applying SHAPE data to understand RNA structure. As next-generation sequencing now allows for the rapid quantification of structure probing,5,25–27 the future of SHAPE will involve signal processing tech-niques to understand a transcript’s structure on mul-tiple scales. The speed at which these technologies now provide us with structure information will allow for efficient and accurate analysis of comparative RNA structure.
FIRST-LEVEL APPROACHES
TO INTERPRETING
SHAPE EXPERIMENTS
SHAPE uses the reactivity of the 20-OH of an RNA molecule to understand the structure of that RNA.19,28–31 An electrophile, typically 1M7 or NMIA, covalently bonds with the 20-O to form an adduct; this reaction occurs preferentially at confor-mationallyflexible, or unpaired, nucleotides.28,29The signal is then‘read’by reverse transcription. In most protocols, modified nucleotides block the reverse transcriptase causing it to fall off the transcript. Nucleotides that are more reactive will generate more stops, which, as the experiments are traditionally per-formed with single-hit kinetics, indicates the relative frequency of adduct formation.30 The relative rates of adduct formation are then normalized tofind the SHAPE profile for that RNA, providing information on the reactivity of each nucleotide.19,32
In general, positions in a SHAPE profile with high reactivities are more likely to be unpaired, and positions with low reactivities are more likely to be paired.22 Because the SHAPE reagent can react at
any nucleobase, the SHAPE profile provides high-resolution structural information.33 Indeed,
differ-ences in SHAPE profiles of two sequence variants indicate that an RNA is a riboSNitch, where a single nucleotide variant changes the structure of the RNA.34–36 Thus, the SHAPE profile alone encodes information on an RNA’s structure.
Recently whole-transcriptome probing methods use the power of next-generation sequencing with SHAPE structural profiling for an ultra-high-throughput way of probing RNA structure, such as the techniques in vivo click SHAPE (icSHAPE)37,38 and SHAPE-Seq,26,39,40 both of which utilize reverse transcription stops. Of particular interest, SHAPE with mutational profiling (SHAPE-MaP) uses
modi-fied reverse transcription conditions to induce muta-tions at posimuta-tions with 20 adducts, rather than causing a reverse transcription stop.25This new tech-nique thus allows for high-resolution quantification of RNA structure for whole transcripts at every nucleotide position, without concerns about signal decay or adaptor ligation bias.41–43
What Is SHAPE Really Saying?
SHAPE is a powerful technique for probing the struc-ture of an RNA but the results of a SHAPE experi-ment are not directly interpretable. Although SHAPE reactivities generally correspond to pairing state, the relationship between SHAPE and frequency of base pairing is not linear. Both Cordero et al.44 and Sükösd et al.45 found that the SHAPE reactivities of paired and unpaired nucleotides fall into two differ-ent probability distributions, although the two stud-ies found different distributions of SHAPE reactivities for unpaired nucleotides (Figure 1(a)). While high (over 1.0) SHAPE reactivities generally only occur at unpaired nucleotides, lower SHAPE reactivities frequently correspond to both paired and unpaired nucleotides. Other structural factors such as base stacking may result in an unpaired nucleotide having a low SHAPE reactivity.46 Consequently, the SHAPE reactivity alone is not always predictive of whether a base is paired or unpaired.
underappreciated aspect of the experiment. The SHAPE reactivity profile depends on the overall fold of the molecule being probed. As such, experimental conditions can significantly alter the profile, and any comparative analysis of SHAPE reactivity should carefully consider experimental conditions.
SHAPE and Structure Prediction
Besides reporting a likelihood of base pairing for any given nucleotide, SHAPE data also refine secondary structure predictions of an RNA as an energetic restraint. This method wasfirst introduced by Deigan et al.,22 where an additional energy term to the near-est neighbor rules incorporates SHAPE reactivity as an additional pseudo-free energy term.48 A high SHAPE reactivity makes that nucleotide less likely to base pair, while a low SHAPE reactivity makes base pairing more favorable. The SHAPE reactivities thus refine the structural space tofind a structure or struc-tures compatible with the SHAPE data (Figure 1(b)). As RNAs often adopt multiple structural conforma-tions and as SHAPE is a measurement over the entire structural ensemble, the SHAPE data may not match a single structure but instead represent the average reactivity over the ensemble.
Still, projecting SHAPE reactivities onto a single structure, as is the case in Figure 1(b), is the most common approach for visualizing SHAPE data. Although one structure may appear to agree with the data (as in Figure 1(b)), there are often many other structures in the suboptimal ensemble that appear to
agree with the data just as well. In fact, in the case of theRB150UTR illustrated in Figure 1(b), three alter-native conformations are all compatible with the data.18 Nonetheless, there is value in visualizing
structural models with SHAPE data projected as in Figure 1(b), and these approaches to interpreting SHAPE data will likely remain popular.
The most fitting way of incorporating SHAPE data into structure prediction is a subject of recent debate and thoroughly reviewed in Eddy 2014.49
These methods all attempt to use SHAPE data to con-strain structure prediction of that RNA, based on the likelihood of each nucleotide being paired. These methods treat SHAPE measurements in a variety of ways: as a free energy term,22as a prior probability,50
or as a likelihood of base pairing.24,51 While each
method of incorporating SHAPE into prediction greatly improves the accuracy of the structure predic-tions, they all perform similarly to each other, with accuracies up to 90–95%.22,24,25,44
When given a SHAPE reactivity, it is impossible to know whether that base is paired or unpaired, especially at lower reactivities. Using structural prob-ing as a restraint in structure prediction provides more information on the structure, with approxi-mately the same accuracy over a wide range of para-meters regardless of the method used.22,24,25,44,50,51
The next challenge in SHAPE processing is not opti-mizing these parameters further, but instead evaluat-ing broader structural characteristics that the SHAPE signal can inform us of. Given that the use of SHAPE in structure prediction was very extensively reviewed SHAPE
Probability density
Paired Unpaired Cordero et al. 2012
0 1 2 3 4 5 6 7 0 1 2 3 4 5 6 7
0.0 0.5 1.0 1.5 2.0 0.0 0.5 1.0 1.5 2.0
SHAPE
Probability density
Paired Unpaired Sükösd et al. 2013
μ=0.0947 σ=0.0672 ε=0.2352 μ=0.2198 σ=0.1852 ε=0.5426 μ=0.0523 σ=0.0680 ε=0.8681 λ=1.4638 (a) (b) G C U C A GUU
G C C GG GC GG G G G A G G G C G C G U C C G G U U U U U C U C AG G G G A C G U U G A A A U U AU
UU UU G UA
A C G G G A G U C G G GA G A G G A C G G G G C G U G C C C C G A C G U G C G C G C G C G U C G U C C U C C C C G G C G C U C C U C C A C A G C UC G C U G G C U C C C G C C G C G G A A A G G C GUC
1 10 2030 40 50 60 70 80 90 100 110 120 130 140 150 160 166 < 0.0 0.5 1.0 1.5 > 2.0 SHAPE No data
FIGURE 1 | SHAPE reactivities distinguish between paired and unpaired nucleotides. (a) Distributions of SHAPE reactivities for paired and
unpaired nucleotides recreated from Cordero et al.44(left) and Sükösd et al.45(right; data from Deigan et al.22). SHAPE reactivities for paired
nucleotides follow a generalized extreme value distribution in both data sets. SHAPE reactivities for unpaired nucleotides follow a generalized extreme value distribution in Cordero et al. and an exponential distribution in Sükösd et al. In both data sets, the distributions for paired and unpaired nucleotides differ, signifying that SHAPE reactivities are drawn from multiple probability distributions. (b) Example of RNA structure (the
RB1 50UTR from Kutchko et al.18) overlaid with SHAPE data. Red: high SHAPE; orange: medium SHAPE; black: low SHAPE; gray: no data. Most
recently by Eddy 2014,49we instead decided to focus on recent developments in the analysis of SHAPE sig-nal that attempt to transcend the interpretation of the data as merely informative of a single secondary structure.
RECENT APPLICATIONS
OF THE SHAPE SIGNAL
While SHAPE is certainly useful in refining RNA sec-ondary structure prediction, it also provides additional information when analyzed at different scales, or when used in conjunction with other metrics such as evolu-tionary data. Here, we will discuss recent extensions of SHAPE reactivities beyond structure prediction.
Zooming Out: Regional View of
SHAPE Reactivities
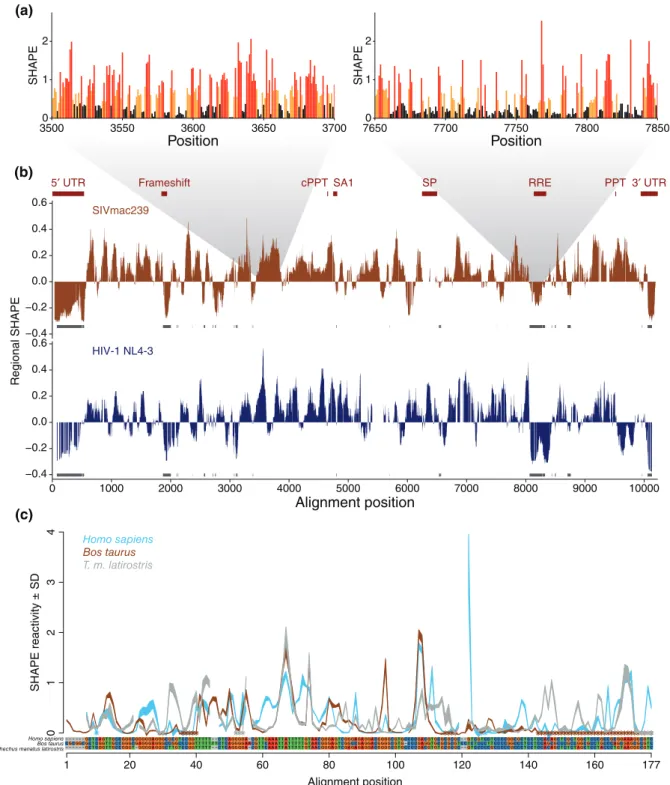
At a single-nucleotide resolution, the traditional con-ceptualization of SHAPE data is that each reactivity provides a likelihood of that base being paired or unpaired (Figure 2(a)). However, the proportions of unreactive (low-SHAPE) and reactive (high-SHAPE) nucleotides are not consistent across larger RNAs because while certain regions within a transcript fold into a well-defined structure, other regions may adopt multiple distinct structures with similar free energies.
It is important to note that a majority of tran-scribed RNAs are long, ranging up to several kilo-bases.54,55 The longest transcripts are often RNA virus genomes, such as the well-studied HIV genome. To quantify these different SHAPE patterns, the median SHAPE reactivity over windows ranging from 50 to 75 nucleotides is a novel way to identify and visualize structured regions in a transcript.25,52 Although SHAPE reactivities are at single-nucleotide resolution, averaging reactivities over many nucleo-tides reveals structured and unstructured regions of an RNA. Such‘multiscale’level analysis of these very large transcripts (often greater than 10 kb) provides a different picture of RNA structure than SHAPE at single-nucleotide resolution (Box 1). Of course, differ-ences in the window size will change the scale at which we are understanding an RNA’s structure, and the choice of window size to date has remained largely empirical. There are significant opportunities for algorithm development using SHAPE data at dif-ferent scales.
Pollom et al.52 compares the windowed SHAPE reactivities of both simian immunodeficiency virus (SIV) and HIV-1 (Figure 2(b)). Regions where both viruses have low median SHAPE correspond to known
RNA structural elements such as the 50 UTR, the gag-pro-pol frameshift, and the Rev response element. Other unannotated regions where both viruses have low median SHAPE reactivities are good targets for identifying new functional RNA elements. This win-dowed picture of SHAPE reactivity provides structural information—identifying regions of the RNA genomes that have well-defined structures—that is difficult to see at single-nucleotide resolution. Median SHAPE helps characterize structure across the transcript, demonstrat-ing that SHAPE profiles have relevance beyond single nucleotide measurements and structure prediction algo-rithms. Future methods of processing these large SHAPE profiles, using this multiscale approach, may uncover more higher-order RNA features. This approach also identifies unstructured regions, which may turn out to be just as functional as structure.18
SHAPE Supplements Weak
Evolutionary Signals
The traditional method of identifying conserved RNA structures is through mutual information or covariation of nucleotide positions.13,14,56 Although covariance is extremely useful for highly conserved RNA structures such as the RNA component of the ribosome,15,57the covariance signal may be weak or nonexistent in other eukaryotic RNAs, making it
dif-ficult to identify conserved RNA structures in these organisms.18 SHAPE represents a new method to help strengthen the evolutionary signal by finding support for conserved RNA structures independent of structure prediction.
Kutchko et al.18 looked at the structure of the 50 UTR of RB1, the transcript that codes for the tumor suppressor Retinoblastoma protein, in three different species. Qualitatively, SHAPE data for the three different UTRs have regions of striking similar-ity (Figure 2(c)). As in reference by Pollom et al.,52 SHAPE data—even in the absence of structure prediction—can indicate structural similarity between different sequences. In addition, SHAPE data can provide insight into observed evolutionary patterns. Watts et al.23used SHAPE tofind that hypervariable regions of the HIV-1 genome are highly unstructured and insulate low-SHAPE, highly structured helices. When used in this manner, SHAPE adds a layer of context to evolutionary patterns (Box 2).
SHAPE-Directed Sequence Alignments
Identify Conserved RNA Structures
5′ UTR Frameshift cPPT SA1 SP RRE PPT 3′ UTR
0 1000 2000 3000 4000 5000 6000 7000 8000 9000 10000
Alignment position
Regional SHAPE
HIV-1 NL4-3
SIVmac239
−0.4 −0.2 0.0 0.2 0.4 0.6 −0.4 −0.2 0.0 0.2 0.4 0.6
01234
SHAPE
reactivity ±
SD
1 20 40 60 80 100 120 140 160 177
Alignment position
Homo sapiens Bos taurus
T. m. latirostris
− − − − − − GC T CAG T T GCCGGGCGGGGGAGGGCGCG T CCGG T T T T T − − C T CAGGGGA − CG T T GAAA T T A T T T T T G T AACGGGAG T CGGGAGAGGACGGGGCG T GCCCCGACG T GCGCGCGC − − G T CG T CC T CCCCGGCGC T CC T CCACAGC T CGC T GGC T CCCGCCGCGGAAAGGCG T C CGCGGCGC T CGG T T GC CGGGCGAGGGAGGGC CGGC C CGG T T T T T T T C T C AGGGGA A CG T T C A A A T T A T T T T T G T A A CGGGAG T CGGC CGAGGA CGGGGCG T G − C C CGAGG T GCGCGCG T C C T C T C C C T T C C C CGGC C C T C C T C C AGCGC C CGC CGGCGC C T GC C C AGCGAGCGCG T C − − − − − − GC T CGG T T GCCGGG T − GGGGAGGGC T T G T CCGG T T T T T − − C T CAGGGGA − CG T T CAAA T T A T T T T T G T AACGGGAG T CGAGAGAGGACGGGGCG T GCCCCGACG T G T GCGCGC − − G T CCCCCGCCCCCGCCC T CC T CCACAGC T C T C T AGC T CC T ACCC T G T AAGGGCG T C Homo sapiens
Bos taurus Trichechus manatus latirostris
0 1 2 (a)
(b)
(c)
3500 3550 3600 3650 3700
Position
SHAPE
0 1 2
7650 7700 7750 7800 7850
Position
SHAPE
FIGURE 2 | SHAPE data for related RNAs follow similar but not identical patterns. (a) Examples of SHAPE data from high-SHAPE regions (left)
and low-SHAPE regions (right) from the SIVmac239 SHAPE data from Pollom et al.52High SHAPE nucleotides are indicated in red, medium in
orange, and low in black. Although both profiles have low- and high-SHAPE nucleotides, the frequencies of each are distinct between the two
regions. (b) SHAPE data for SIVmac239 (top) and HIV-1 (bottom) aligned genomes. SHAPE data are from Pollom et al., annotations are from
Pollom et al. and the Los Alamos HIV database (http://www.hiv.lanl.gov/), and the sequences were aligned using MAFFT.53Regional SHAPE
represents the windowed median SHAPE over a 75-nt window, with respect to the global median SHAPE value for each transcript. Values above the line are regionally unstructured, and below the line are regionally structured. Alignment regions where both viruses are regionally structured are annotated in gray. These regions correspond to known structural elements of the SIVmac virus (above, red). (c) SHAPE reactivities aligned by
sequence for theRB150UTR in human (blue), cow (brown), and manatee (gray) from Kutchko et al.18The SHAPE profiles for each species are
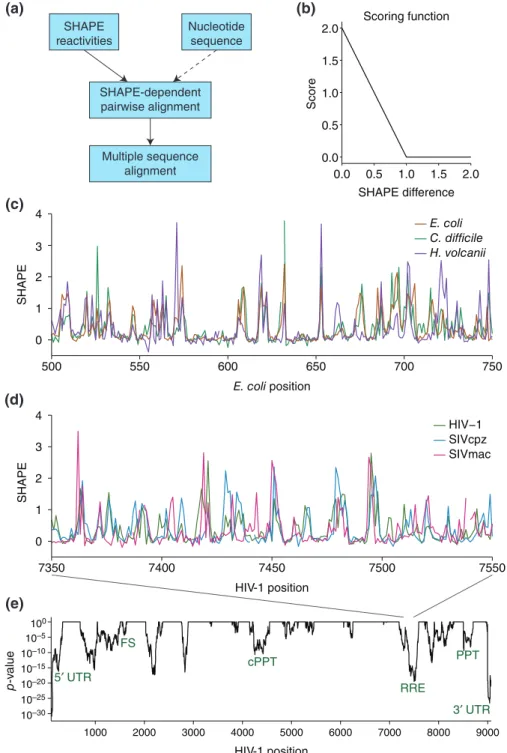
a feature for sequence alignment.58,59 Their algo-rithm aligns two SHAPE profiles to minimize the dif-ference in SHAPE reactivity at each position, optionally including sequence as an alignment parameter (Figure 3(a)). The difference in SHAPE reactivity between two sequence positions becomes a function applied to the Gotoh alignment algorithm60 (Figure 3(b)). This novel method uses SHAPE reactiv-ity as an additional feature for understanding evolu-tionary conservation.
As a proof of concept, they used the method to align ribosomal RNA sequences from Escherichia
coli, Clostridium difficile, and Haloferax volcanii
with only SHAPE data, not taking sequence into account58(Figure 3(c)). It should be noted that align-ing these distantly related rRNAs based on sequence alone is quite challenging.58 The rRNAs aligned with
SHAPE data alone produce an alignment with similar accuracy to the sequence-only alignment, and using both sequence and SHAPE data reproduce the gold standard, manually curated alignment, suggesting that SHAPE data captures evolutionary patterns in RNA structure.
To extend this method further, they aligned three lentivirus genomes (HIV-1, SIVcpz, and SIVmac) using sequence and SHAPE together59 (Figure 3(d)).
Some regions in viral genomes have very robust struc-tures, although unlike rRNA, viral RNAs also have many unstructured or less-structured regions. The application of SHAPE-directed sequence alignments to viral RNAs is thus an important test of this new align-ment method. From the aligned SHAPE data, they used a linear regression model tofind regions where the SHAPE profiles are correlated between the three viruses (Figure 3(e)). Known RNA functional elements have significant correlations between the SHAPE
pro-files (Figure 3(e); green), indicating that SHAPE corre-lation is a signal for structural homology.
SHAPE-directed sequence alignments are there-fore applicable to more divergent RNAs, but most useful for conserved RNA elements where the SHAPE profiles are similar. Systematically using SHAPE as an alignment parameter is a novel approach to identifying conservation of RNA struc-ture, and future extensions of this technique may involve quantifying structural divergence and similar-ity using SHAPE data.
SHAPE Facilitates Discovery of the
Conservation of Multiple RNA Structures
The SHAPE signal does not measure the conforma-tion of a single molecule but instead represents the average reactivities over all copies of that RNA
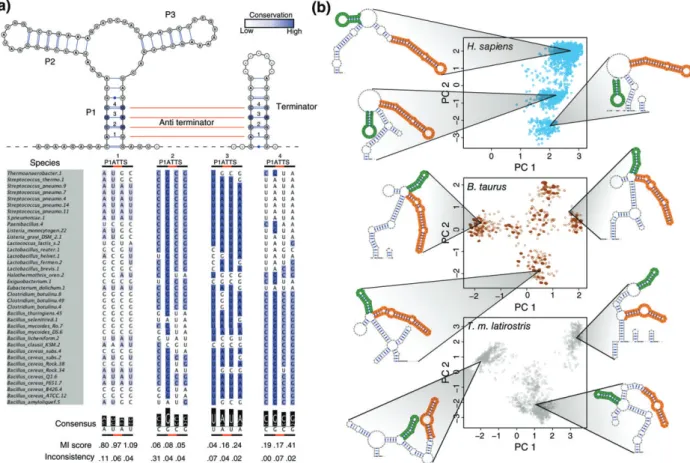
transcript. Indeed the reaction occurs in bulk, and as such the reactivity at any given nucleotide is an ensemble average. As many RNA structures, includ-ing riboswitches, adopt multiple conformations,2,61it is critical to consider the entire structural ensemble of a transcript when interpreting the SHAPE profile. We can therefore compute the SHAPE-directed partition function, which models the entire structural ensemble informed by SHAPE data11,22and allows us to iden-tify the presence of multiple structural conformations. As comparative structure analysis now incorpo-rates SHAPE data as additional information, the next step in this direction is using SHAPE to compare multiple structural conformations of an RNA. Our laboratory recently showed that multiple conforma-tions of a purine riboswitch are conserved in sequence62 (Figure 4(a)). However, the covariation
signal is much weaker in eukaryotic RNAs than bac-terial or archaeal. SHAPE data thus provide us with more information, helping us identify the conserva-tion of multiple structures.
To incorporate SHAPE into conservation analy-sis, we used SHAPE to probe the 50 UTR of the human RB1 transcript.18 As SHAPE data greatly improve the accuracy of RNA secondary structure prediction22,25we can be confident in our subsequent
computational analysis. Using SHAPE-directed Boltz-mann sampling,10,22,63 we found that the 50 UTR adopts three distinct conformations (Figure 4(b)). We applied the same analysis to the homologous UTRs
inBos taurus andTrichechus manatus latirostrisand
found that they also adopt multiple, similar confor-mations to the UTR in humans (Figure 4(c)). Here, in conjunction with structure prediction, SHAPE helps uncover the conservation of multiple structures in an RNA. As whole-transcriptome probing technologies improve, we anticipate further discovery of this type of structural conservation and we encourage others investigating RNA structure to also investigate the conservation of multiple conformations as an impor-tant functional consideration.
THE FUTURE OF SHAPE IN
THE NEXT-GENERATION
SEQUENCING ERA
(a)
(c)
(d)
(e)
(b)
0.0 0.5 1.0 1.5 2.0
0.0 0.5 1.0 1.5 2.0 SHAPE difference
Score
Scoring function
10–30
10–25
10–20
10–15
10–10
10–5
100
1000 2000 3000 4000 5000 6000 7000 8000 9000
HIV-1 position
p
-v
alue
5′ UTR
3′ UTR FS
cPPT
RRE
PPT SHAPE
reactivities
Nucleotide sequence
SHAPE-dependent pairwise alignment
Multiple sequence alignment
0 1 2 3 4
7350 7400 7450 7500 7550
HIV-1 position
SHAPE
HIV−1 SIVcpz SIVmac 0
1 2 3 4
500 550 600 650 700 750
E. coli position
SHAPE
E. coli C. difficile H. volcanii
FIGURE 3 | SHAPE data of homologous RNAs can facilitate sequence alignments. (a) Schematic of SHAPE-directed sequence alignment used
in Lavender et al. (1)58SHAPE reactivities, and optionally nucleotide identity, can be used as parameters in the Gotoh alignment algorithm for
pairwise alignment. Pairwise alignments can then be combined to create a SHAPE-informed multiple sequence alignment. (b) Scoring function from Lavender et al. (1) used to align SHAPE reactivities for two sequences. More similar SHAPE reactivities have a higher score for alignment. If SHAPE reactivities differ by more than 1, the scoring function treats them as unrelated. (c) SHAPE-only alignment of a section from three 16S rRNA
sequences. Data from Lavender et al. (1) The aligned SHAPE reactivities are very similar, reflecting structural homology. (d) SHAPE-directed
multiple sequence alignment of three lentivirus sequences. The aligned SHAPE profiles of each virus have similar patterns. (e) Significance of the
correlation of SHAPE between the three viruses, determined by linear regression. Lowerp-values indicate more similarity in SHAPE profiles. The
SHAPE profiles have regions of significant correlation across the alignment, particularly in regions known to have functional RNA structures.
are much faster and more efficient than in the past, and public databases such as the RNA Mapping Database64 allow for large-scale comparisons of SHAPE data. Several studies recently applied next-generation sequencing to analyze RNA structure at the whole transcriptome level.5,27,36,65,66 With this unprecedented amount of RNA structural probing data, the next steps in computational analysis of RNA structure will incorporate methods beyond structure prediction into read alignment, motif analy-sis, and signal processing.
In this new era of ‘next-generation structural probing,’ the SHAPE signal is now one of multiple available features to inform us about an RNA. SHAPE represents a model-free approach to RNA structure analysis and provides information at
multiple levels, from single nucleotides to 50-nt win-dows to whole transcripts. This multiscale approach to SHAPE structural probing gives us a wealth of information on the structure of a transcript, and combined with other methods such as Shannon entropy25,67,68 or mutual information,14 provides us with great detail on the transcript’s structure.
Using SHAPE at this whole-transcriptome, mul-tiscale level will facilitate the application of signal processing methods to these SHAPE profiles of inter-est and uncover RNA structural features. The use of Fourier transforms to detect periodicity in (aggre-gated) SHAPE data is the first example of applying signal processing to SHAPE.27,69 As new model-free
methods are applied to SHAPE profiles, we will gain detailed information on RNA structure at a
whole-FIGURE 4| SHAPE reactivities can help identify conservation of multiple RNA structures. (a) Figure from Ritz et al.62Multiple conformations of an RNA are evolutionarily conserved. Top: Purine riboswitch consensus structure with the anti-terminator pairs in red lines. Both the P1/terminator conformation and the anti-terminator conformation must be conserved. Bottom: Evolutionary analysis of bases involved in the P1, terminator, and anti-terminator stems. Blue indicates conservation of each base. Mutual information shows that the pairs involved in the anti-terminator stem preserve their ability to base pair, but also to pair with their partners in the P1 and terminator stems. (Reprinted with permission from Ref 62.
Copyright 2013 Ritz et al.; PLOS Computational Biology) (b) The 50UTR ofRB1forms multiple distinct structures in humans (blue), cow (brown),
and manatee (gray), with SHAPE-directed Boltzmann sampled structures indicated by blue dots. Structures and arc diagrams on the side show representative structures from each conformation. Green and orange stems are conserved across all three organisms. Thus, SHAPE-directed
structure prediction allows us to confidently identify the conservation of multiple RNA structures. (Reprinted with permission from Ref 18.
transcriptome level and likely discover new levels of structural conservation.
In addition, these new high-throughput probing technologies allow us to generate SHAPE data for related RNAs very quickly, facilitating the compari-son of SHAPE data and structural preservation between homologous sequences. As with HIV and
SIV genomes,59 correlations of SHAPE data will identify regions with conserved RNA structure. We live in exciting times for RNA structural biology as these next-generation structural probing techniques are being developed, refined, and applied to large data sets. The next few years will involve a huge expansion of information regarding the conservation of RNA structure.
ACKNOWLEDGMENTS
We would like to thank Sean Eddy for sharing data and advice regarding the SHAPE distributions in Figure 1(a), and the Weeks lab for sharing code to plot the structure in Figure 1(b). This work is supported by U.S. National Institutes of Health grants NHLBI R01 HL111527, NIGMS R01 GM101237, and NHGRI HG008133 to A.L., and the National Science Foundation Graduate Research Fellowship under grant num-ber DGE-1144081 to K.M.K.
REFERENCES
1. Sharp PA. The centrality of RNA. Cell 2009,
136:577–580. doi:10.1016/j.cell.2009.02.007.
2. Tucker BJ, Breaker RR. Riboswitches as versatile gene
control elements. Curr Opin Struct Biol 2005,
15:342–348. doi:10.1016/j.sbi.2005.05.003.
3. Chen C, Zhang H, Broitman SL, Reiche M, Farrell I, Cooperman BS, Goldman YE. Dynamics of translation by single ribosomes through mRNA secondary struc-tures. Nat Struct Mol Biol 2013, 20:582–588. doi:10.1038/nsmb.2544.
4. Heaphy S, Dingwall C, Ernberg I, Gait MJ, Green SM, Kern J, Lowe AD, Singh M, Skinner MA. HIV-1 regu-lator of virion expression (Rev) protein binds to an RNA stem-loop structure located within the Rev response element region. Cell 1990, 60:685–693. doi:10.1016/0092-8674(90)90671-Z.
5. Kertesz M, Wan Y, Mazor E, Rinn JL, Nutter RC, Chang HY, Segal E. Genome-wide measurement of RNA secondary structure in yeast. Nature 2010, 467:103–107. doi:10.1038/nature09322.
BOX 1
NEW INTERPRETATIONS OF SHAPE FOR NEXT-GENERATION PROBING
Traditionally, researchers have used SHAPE to understand the structure of a single RNA. Recently, though, developments such as SHAPE-Seq, icSHAPE, and SHAPE-MaP now make SHAPE structural probing a next-generation technology. Now, SHAPE has more applications than just as a measure of whether a single nucleotide is paired or unpaired—it can indi-cate structuredness at multiple resolutions. SHAPE is now one of multiple metrics— including base pairing probability, Shannon entropy, and nucleotide content—for interpret-ing both local and broad structure of an RNA. The future of SHAPE as a genome-wide (for viruses) or transcriptome-wide (for bacteria and eukaryotes) measurement technique relies on signal processing of this large-scale data.
BOX 2
MEASURING RNA STRUCTURE CONSERVATION WITH SHAPE
As SHAPE is a model-free measure of RNA struc-ture, correlations between SHAPE profiles can
6. Solem AC, Halvorsen M, Ramos SBV, Laederach A. The potential of the riboSNitch in personalized medi-cine. Wiley Interdiscip Rev RNA 2015, 6:517–532. doi:10.1002/wrna.1291.
7. Nussinov R, Jacobson A. Fast algorithm for predicting the secondary structure of single-stranded RNA. Proc Natl Acad Sci USA1980, 77:6309–6313.
8. Zuker M, Stiegler P. Optimal computer folding of large RNA sequences using thermodynamics and auxiliary information.Nucleic Acids Res1981, 9:133–148. 9. Zuker M, Sankoff D. RNA secondary structures and
their prediction.Bull Math Biol1984, 46:591–621. 10. Mathews DH, Disney MD, Childs JL, Schroeder SJ,
Zuker M, Turner DH. Incorporating chemical modifi -cation constraints into a dynamic programming algo-rithm for prediction of RNA secondary structure.Proc
Natl Acad Sci USA 2004, 101:7287–7292.
doi:10.1073/pnas.0401799101.
11. McCaskill JS. The equilibrium partition function and base pair binding probabilities for RNA secondary
structure. Biopolymers 1990, 29:1105–1119.
doi:10.1002/bip.360290621.
12. Ding Y, Lawrence CE. A statistical sampling algorithm for RNA secondary structure prediction.Nucleic Acids Res2003, 31:7280–7301. doi:10.1093/nar/gkg938. 13. Hofacker IL, Fekete M, Stadler PF. Secondary
struc-ture prediction for aligned RNA sequences.J Mol Biol 2002, 319:1059–1066. doi:10.1016/S0022-2836(02) 00308-X.
14. Freyhult E, Moulton V, Gardner P. Predicting RNA structure using mutual information.Appl Bioinformat-ics2005, 4:53–59.
15. Gutell R, Larsen N, Woese C. Lessons from an evol-ving rRNA: 16S and 23S rRNA structures from a com-parative perspective.Microbiol Rev1994, 58:10–26. 16. Gardner PP, Giegerich R. A comprehensive
compari-son of comparative RNA structure prediction
approaches. BMC Bioinformatics 2004, 5:140.
doi:10.1186/1471-2105-5-140.
17. Mathews DH, Moss WN, Turner DH. Folding and finding RNA secondary structure. Cold Spring Harb Perspect Biol 2010, 2:a003665. doi:10.1101/cshper-spect.a003665.
18. Kutchko KM, Sanders W, Ziehr B, Phillips G, Solem A, Halvorsen M, Weeks KM, Moorman N, Laederach A. Multiple conformations are a conserved and regulatory feature of the RB1 50UTR.RNA2015, 21:1–12. doi:10.1261/rna.049221.114.
19. Merino EJ, Wilkinson KA, Coughlan JL, Weeks KM. RNA structure analysis at single nucleotide resolution by selective 2’-hydroxyl acylation and primer extension
(SHAPE). J Am Chem Soc 2005, 127:4223–4231.
doi:10.1021/ja043822v.
20. Tijerina P, Mohr S, Russell R. DMS footprinting of structured RNAs and RNA-protein complexes. Nat
Protoc 2007, 2:2608–2623. doi:10.1038/nprot. 2007.380.
21. Corley M, Solem A, Qu K, Chang HY, Laederach A. Detecting riboSNitches with RNA folding algorithms: a genome-wide benchmark. Nucleic Acids Res 2015, 43:1859–1868. doi:10.1093/nar/gkv010.
22. Deigan K, Li T, Mathews D, Weeks K. Accurate SHAPE-directed RNA structure determination. Proc Natl Acad Sci2009, 106:97–102.
23. Watts JM, Dang KK, Gorelick RJ, Leonard CW, Bess JW, Swanstrom R, Burch CL, Weeks KM. Archi-tecture and secondary structure of an entire HIV-1
RNA genome. Nature 2009, 460:711–716.
doi:10.1038/nature08237.
24. Zarringhalam K, Meyer MM, Dotu I, Chuang JH, Clote P. Integrating chemical footprinting data into RNA secondary structure prediction.PLoS One2012, 7:e45160. doi:10.1371/journal.pone.0045160.
25. Siegfried NA, Busan S, Rice GM, Nelson JAE, Weeks KM. RNA motif discovery by SHAPE and mutational profiling (SHAPE-MaP). Nat Methods 2014, 11:959–965. doi:10.1038/nmeth.3029.
26. Mortimer SA, Trapnell C, Aviran S, Pachter L, Lucks JB. SHAPE–Seq: high-throughput RNA
struc-ture analysis. Curr Protoc Chem Biol 2012,
4:275–297. doi:10.1002/9780470559277.ch120019.
27. Ding Y, Tang Y, Kwok CK, Zhang Y, Bevilacqua PC, Assmann SM. In vivo genome-wide profiling of RNA secondary structure reveals novel regulatory features. Nature2014, 505:696–700. doi:10.1038/nature12756.
28. Mortimer SA, Weeks KM. A fast-acting reagent for accurate analysis of RNA secondary and tertiary
struc-ture by SHAPE chemistry. J Am Chem Soc 2007,
129:4144–4145. doi:10.1021/ja0704028.
29. Wilkinson KA, Merino EJ, Weeks KM. Selective 2’ -hydroxyl acylation analyzed by primer extension (SHAPE): quantitative RNA structure analysis at single nucleotide resolution.Nat Protoc 2006, 1:1610–1616. doi:10.1038/nprot.2006.249.
30. McGinnis JL, Duncan CDS, Weeks KM. High-throughput SHAPE and hydroxyl radical analysis of RNA structure and ribonucleoprotein assembly. Meth-ods Enzymol 2009, 468:67–89. doi:10.1016/S0076-6879(09)68004-6.
31. Spitale RC, Flynn RA, Torre EA, Kool ET, Chang HY. RNA structural analysis by evolving SHAPE chemistry. Wiley Interdiscip Rev RNA 2014, 5:867–881. doi:10.1002/wrna.1253.
33. Wilkinson K, Vasa S, Deigan K. Influence of nucleotide identity on ribose 2’-hydroxyl reactivity in RNA.RNA 2009, 15:1314–1321. doi:10.1261/rna.1536209. structure.
34. Halvorsen M, Martin JS, Broadaway S, Laederach A. Disease-associated mutations that alter the RNA
struc-tural ensemble. PLoS Genet 2010, 6:e1001074.
doi:10.1371/journal.pgen.1001074.
35. Ritz J, Martin JS, Laederach A. Evaluating our ability to predict the structural disruption of RNA by SNPs. BMC Genomics2012, 13:S6. doi:10.1186/1471-2164-13-S4-S6.
36. Wan Y, Qu K, Zhang QC, Flynn RA, Manor O, Ouyang Z, Zhang J, Spitale RC, Snyder MP, Segal E, et al. Landscape and variation of RNA secondary structure across the human transcriptome. Nature 2014, 505:706–709. doi:10.1038/nature12946. 37. Spitale RC, Flynn RA, Zhang QC, Crisalli P, Lee B,
Jung J-W, Kuchelmeister HY, Batista PJ, Torre EA, Kool ET, et al. Structural imprints in vivo decode
RNA regulatory mechanisms. Nature 2015,
519:486–490. doi:10.1038/nature14263.
38. Flynn RA, Zhang QC, Spitale RC, Lee B,
Mumbach MR, Chang HY. Transcriptome-wide inter-rogation of RNA secondary structure in living cells
with icSHAPE. Nat Protoc 2016, 11:273–290.
doi:10.1038/nprot.2016.011.
39. Aviran S, Trapnell C, Lucks JB, Mortimer SA, Luo S, Schroth GP, Doudna JA, Arkin AP, Pachter L. Model-ing and automation of sequencModel-ing-based characteriza-tion of RNA structure.Proc Natl Acad Sci USA2011, 108:11069–11074. doi:10.1073/pnas.1106541108.
40. Loughrey D, Watters KE, Settle AH, Lucks JB. SHAPE-Seq 2.0: systematic optimization and extension of high-throughput chemical probing of RNA second-ary structure with next generation sequencing.Nucleic Acids Res2014, 42:e165. doi:10.1093/nar/gku909.
41. Pelechano V, Wei W, Steinmetz LM. Widespread co-translational RNA decay reveals ribosome dynamics. Cell 2015, 161:1400–1412. doi:10.1016/j.cell.2015. 05.008.
42. Leonard CW, Hajdin CE, Karabiber F, Mathews DH, Favorov OV, Dokholyan NV, Weeks KM. Principles for understanding the accuracy of SHAPE-directed
RNA structure modeling. Biochemistry 2013,
52:596–599. doi:10.1021/bi300756s.
43. Aviran S, Pachter L. Rational experiment design for
sequencing-based RNA structure mapping. RNA
2014, 20:1864–1877. doi:10.1261/rna.043844.113.
44. Cordero P, Kladwang W, VanLang C, Das R. Quanti-tative dimethyl sulfate mapping for automated RNA
secondary structure inference. Biochemistry
2012, 51:3–5.
45. Sükösd Z, Swenson MS, Kjems J, Heitsch CE. Evaluat-ing the accuracy of SHAPE-directed RNA secondary
structure predictions. Nucleic Acids Res 2013, 41:2807–2816. doi:10.1093/nar/gks1283.
46. Bindewald E, Wendeler M, Legiewicz M, Bona MK, Wang Y, Pritt MJ, Le Grice SFJ, Shapiro BA. Correlat-ing SHAPE signatures with three-dimensional RNA structures. RNA 2011, 17:1688–1696. doi:10.1261/ rna.2640111.
47. Kladwang W, VanLang CC, Cordero P, Das R. Under-standing the errors of SHAPE-directed RNA structure
modeling. Biochemistry 2011, 50:8049–8056.
doi:10.1021/bi200524n.
48. Xia T, SantaLucia J, Burkard ME, Kierzek R, Schroeder SJ, Jiao X, Cox C, Turner DH. Thermody-namic parameters for an expanded nearest-neighbor model for formation of RNA duplexes with
Watson-Crick base pairs. Biochemistry 1998,
37:14719–14735. doi:10.1021/bi9809425.
49. Eddy SR. Computational analysis of conserved RNA secondary structure in transcriptomes and genomes. Annu Rev Biophys 2014, 43:433–456. doi:10.1146/ annurev-biophys-051013-022950.
50. Quarrier S, Martin JS, Davis-Neulander L,
Beauregard A, Laederach A. Evaluation of the infor-mation content of RNA structure mapping data for
secondary structure prediction. RNA 2010, 16:
1108–1117. doi:10.1261/rna.1988510.experimental.
51. Washietl S, Hofacker IL, Stadler PF, Kellis M. RNA folding with soft constraints: reconciliation of probing data and thermodynamic secondary structure
predic-tion. Nucleic Acids Res 2012, 40:4261–4272.
doi:10.1093/nar/gks009.
52. Pollom E, Dang KK, Potter EL, Gorelick RJ, Burch CL, Weeks KM, Swanstrom R. Comparison of SIV and HIV-1 genomic RNA structures reveals impact of sequence evolution on conserved and non-conserved structural motifs. PLoS Pathog 2013, 9: e1003294. doi:10.1371/journal.ppat.1003294.
53. Katoh K, Standley DM. MAFFT multiple sequence alignment software version 7: improvements in
perfor-mance and usability. Mol Biol Evol 2013,
30:772–780. doi:10.1093/molbev/mst010.
54. Ramsköld D, Wang ET, Burge CB, Sandberg R. An abundance of ubiquitously expressed genes revealed by tissue transcriptome sequence data.PLoS Comput Biol 2009, 5:1–11. doi:10.1371/journal.pcbi.1000598. 55. Lackey L, McArthur E, Laederach A. Increased
tran-script complexity in genes associated with chronic
obstructive pulmonary disease. PLoS One 2015,
10:1–25. doi:10.1371/journal.pone.0140885.
56. Nawrocki EP, Eddy SR. Computational identification of functional RNA homologs in metagenomic data.
RNA Biol 2013, 10:1170–1179. doi:10.4161/
rna.25038.
Struct Biol 2002, 12:301–310. doi:10.1016/S0959-440X(02)00339-1.
58. Lavender CA, Lorenz R, Zhang G, Tamayo R, Hofacker IL, Weeks KM. Model-free RNA sequence and structure alignment informed by SHAPE probing reveals a conserved alternate secondary structure for
16S rRNA. PLoS Comput Biol 2015, 11:e1004126.
doi:10.1371/journal.pcbi.1004126.
59. Lavender CA, Gorelick RJ, Weeks KM. Structure-based alignment and consensus secondary structures for three HIV-related RNA genomes. PLoS Comput
Biol 2015, 11:e1004230. doi:10.1371/journal.
pcbi.1004230.
60. Gotoh O. An improved algorithm for matching biolog-ical sequences.J Mol Biol1982, 162:705–708.
61. Montange RK, Batey RT. Riboswitches: emerging themes in RNA structure and function.Annu Rev
Bio-phys 2008, 37:117–133. doi:10.1146/annurev.
biophys.37.032807.130000.
62. Ritz J, Martin JS, Laederach A. Evolutionary evidence for alternative structure in RNA sequence co-variation. PLoS Comput Biol 2013, 9:e1003152. doi:10.1371/ journal.pcbi.1003152.
63. Reuter JS, Mathews DH. RNAstructure: software for RNA secondary structure prediction and analysis.
BMC Bioinformatics2010, 11:129. doi:10.1186/1471-2105-11-129.
64. Cordero P, Lucks JB, Das R. An RNA mapping data base for curating RNA structure mapping experiments. Bioinformatics 2012, 28:3006–3008. doi:10.1093/bio-informatics/bts554.
65. Underwood JG, Uzilov AV, Katzman S, Onodera CS, Mainzer JE, Mathews DH, Lowe TM, Salama SR, Haussler D. FragSeq: transcriptome-wide RNA struc-ture probing using high-throughput sequencing. Nat Methods2010, 7:995–1001. doi:10.1038/nmeth.1529. 66. Rouskin S, Zubradt M, Washietl S, Kellis M,
Weissman JS. Genome-wide probing of RNA structure reveals active unfolding of mRNA structures in vivo. Nature2014, 505:701–705. doi:10.1038/nature12894. 67. Shannon C. A mathematical theory of communiction.
Bell Syst Tech J1948, 27:379–423.
68. Huynen M, Gutell R, Konings D. Assessing the relia-bility of RNA folding using statistical mechanics. J Mol Biol 1997, 267:1104–1112. doi:10.1006/ jmbi.1997.0889.
69. Del Campo C, Bartholomäus A, Fedyunin I,