A coupled-oscillator model of olfactory bulb
gamma oscillations
Guoshi Li¤, Thomas A. Cleland*
Dept. Psychology, Cornell University, Ithaca, NY United States of America
¤ Current address: Dept. Psychiatry, University of North Carolina at Chapel Hill, Chapel Hill, NC, United States of America.
Abstract
The olfactory bulb transforms not only the information content of the primary sensory repre-sentation, but also its underlying coding metric. High-variance, slow-timescale primary odor representations are transformed by bulbar circuitry into secondary representations based on principal neuron spike patterns that are tightly regulated in time. This emergent fast timescale for signaling is reflected in gamma-band local field potentials, presumably serving to efficiently integrate olfactory sensory information into the temporally regulated information networks of the central nervous system. To understand this transformation and its integration with interareal coordination mechanisms requires that we understand its fundamental dynamical principles. Using a biophysically explicit, multiscale model of olfactory bulb circuitry, we here demonstrate that an inhibition-coupled intrinsic oscillator framework, pyramidal resonance interneuron net-work gamma (PRING), best captures the diversity of physiological properties exhibited by the olfactory bulb. Most importantly, these properties include global zero-phase synchronization in the gamma band, the phase-restriction of informative spikes in principal neurons with respect to this common clock, and the robustness of this synchronous oscillatory regime to multiple challenging conditions observed in the biological system. These conditions include substantial heterogeneities in afferent activation levels and excitatory synaptic weights, high levels of uncorrelated background activity among principal neurons, and spike frequencies in both prin-cipal neurons and interneurons that are irregular in time and much lower than the gamma fre-quency. This coupled cellular oscillator architecture permits stable and replicable ensemble responses to diverse sensory stimuli under various external conditions as well as to changes in network parameters arising from learning-dependent synaptic plasticity.
Author summary
The mammalian olfactory bulb responds to odor stimulation by generating fast oscilla-tions in its electrical field potential. Such oscillaoscilla-tions are indicaoscilla-tions that a substantial number of principal neurons in the olfactory bulb are coordinating their activities in time, which often means that their action potentials are synchronized, or partly synchronized, such that the pattern of small differences in their spike times contains olfactory sensory a1111111111 a1111111111 a1111111111 a1111111111 a1111111111 OPEN ACCESS
Citation: Li G, Cleland TA (2017) A
coupled-oscillator model of olfactory bulb gamma oscillations. PLoS Comput Biol 13(11): e1005760.
https://doi.org/10.1371/journal.pcbi.1005760
Editor: Bard Ermentrout, University of Pittsburgh,
UNITED STATES
Received: May 22, 2017
Accepted: September 1, 2017
Published: November 15, 2017
Copyright:©2017 Li, Cleland. This is an open access article distributed under the terms of the
Creative Commons Attribution License, which permits unrestricted use, distribution, and reproduction in any medium, provided the original author and source are credited.
Data Availability Statement: All relevant data are
contained within the paper. Simulation code is
available from the ModelDB database (http://
modeldb.yale.edu/232097).
Funding: This work was supported by National
Institute on Deafness and Other Communication Disorders R01 grants DC014367 and DC014701 to TAC and R03 grant DC013872 to GL. The funders had no role in study design, data collection and analysis, decision to publish, or preparation of the manuscript.
Competing interests: The authors have declared
information. We are interested in the mechanisms by which olfactory bulb circuitry can transform sensory information from the temporally unsophisticated spike rates of pri-mary sensory neurons into this sophisticated cortical format. We present a biophysically explicit, multiscale dynamical model of the olfactory bulb network that generates these oscillations. The elements of this model are designed to adhere to experimental findings from individual neurons, membrane currents, and synapses as well as the functional net-work. Together, these elements generate gamma oscillations exhibiting the full range of properties of those in the biological system. We show that these dynamics arise from an inhibition-coupled oscillator framework, a type of dynamical system with some estab-lished mathematical properties. This finding enables us to understand how the olfactory system translates sensory information for distribution in the central nervous system, and how different areas of the brain can mechanistically coordinate with one another so as to regulate the flow of sensory information to appropriate target structures.
Introduction
The mammalian main olfactory bulb (OB) plays a central role in processing and relaying olfac-tory information from the primary sensory epithelium to subcortical and cortical areas [1]. This processing transforms the information content of the primary representation, but also has been proposed to transform the underlying physical metric by which this information is encoded, from rate-coded population activity organized on a respiration timescale to a spike timing-based representation aligned to a faster timescale that is determined by the intrinsic dynamics of cortical neural ensembles [2]. Odor stimulus-evoked activation of the OB gener-ates fast, gamma-band (30–80 Hz) local field potential (LFP) oscillations that are thought to be largely synchronous across the extent of the OB [3]. Such oscillations reflect the tightly con-strained synchronization of a large neural assembly, which in the OB (and its arthropod ana-logues) has long been believed to play some role in the encoding and processing of olfactory information [4–14].
It is generally accepted that OB gamma oscillations are intrinsic, and mediated by a fast negative feedback loop formed between principal output neurons (mitral and projecting tufted cells; MCs) and a class of inhibitory GABAergic interneurons (granule cells; GCs), interacting via dendrodendritic synapses in the external plexiform layer (EPL) of the OB (Fig 1A; [15–
afferent drive). However, this model required substantially higher-frequency MC STOs than have been experimentally described, and also was not clearly compatible with the sparse spiking behavior of GCs [34]. Fourth, a hybrid network based on inhibition-coupled intrinsic cellular oscillators has been proposed [35], in which the intrinsic STOs of MCs are transiently coupled during afferent acti-vation into a coherent oscillatory network [36] paced by GC-mediated inhibitory synaptic inputs that periodically reset the slower MC STOs. (Pulsed inhibitory inputs, including shunting inhibition, have been demonstrated to effectively reset MC STOs [28,37–39]). During these active epochs, the network dynamics exhibit key PING-like properties (e.g., the population oscillation frequency depends on the decay time constant of the GABA(A) receptor conductance), but they also retain a dependence on the slower STO dynamics of mitral cells even when the STO frequency itself is superseded by the network oscillation. This dynamical mechanism, pyramidal resonance interneu-ron network gamma (PRING), is consistent with a broad range of experimental data and is modeled here.
It is important to clearly understand the specific dynamical mechanisms underlying OB field oscillations, for several reasons. These oscillations are likely to reflect the re-encoding of afferent odor information into timing-based representations for distribution to multiple post-bulbar cortical and subcortical structures [40]. Therefore, in order to understand the forma-tion and informaforma-tion content of these secondary representaforma-tions, the dynamics of their creation must be clear. Moreover, ascending inputs from the anterior olfactory nucleus and piriform cortex, among other structures, must be integrated into this dynamical framework. Piriform cortical inputs, in particular, are understood to alter bulbar dynamics, transiently transforming the OB’s intrinsic gamma oscillations into slower beta-band oscillations coherent with those of the piriform cortex [13,41–44]. To understand how these ascending inputs are
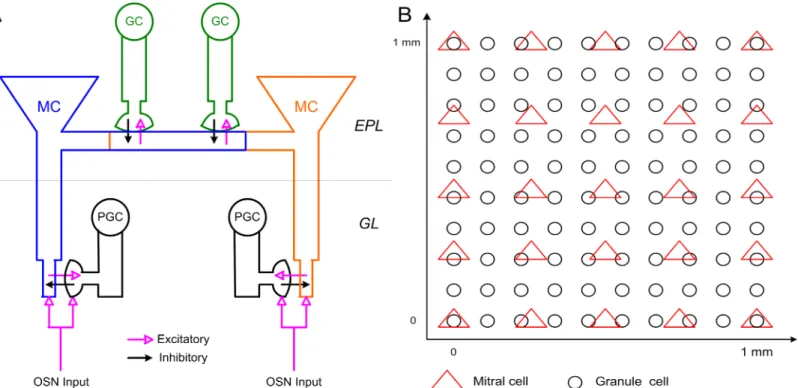
Fig 1. Schematic representation of OB network connectivity and model structure. A: Schematic representation of dendrodendritic synaptic connectivity
among MCs, PGCs, and GCs. Reciprocal dendrodendritic synaptic connections exist between the MC tuft and PGC spines, and between the MC lateral dendrite and GC spines. GL: glomerular layer; EPL: external plexiform layer. B: Spatial localization of MCs and GCs across the two-dimensional toroidal surface of the model OB (1 mm×1 mm).
integrated into the secondary odor representation requires a correct, mechanistic model of bulbar gamma oscillogenesis and its subversion by piriform cortical activity. Finally, field potential oscillations at many different characteristic frequencies are found all over the brain, often interacting within particular neural structures [45] and potentially serving to select and route specific information between coherently activated brain regions [46]. Elucidation of the detailed mechanics of oscillations and their transitions in the OB and its associated networks hence also will pertain to broader questions surrounding interareal communication mecha-nisms in the brain.
To address this question, we developed a conductance-based, dynamically detailed biophys-ical model of the OB network. The present model is based on our earlier two-layer model of cholinergic neuromodulation in the OB [25], but embeds these glomerular layer and interco-lumnar EPL computations within an explicit spatial framework. The results from this model favor the PRING mechanism described above [35], and demonstrate that this inhibition-cou-pled cellular oscillator architecture supports the diverse phenomena observed in OB neuro-physiological recordings. These phenomena include (1) patterned spiking activity in MCs and GCs that both is broadly heterogeneous and occurs at lower frequencies than the population rhythm, (2) tolerance to a wide range of afferent MC excitation levels, which is important for mediating the representation of different odor qualities, (3) tolerance for substantial changes in MC-GC synaptic weights, which underlie intrinsic odor learning within the OB [47–49], (4) the broad coherence of gamma-band oscillations across a physically extensive network despite the incoherent activity of some neurons within that network, (5) the phase-constraining of spikes within each cycle of the gamma oscillation [10,13], and (6) the persistence of LFP gamma oscillations at consistent frequencies despite sparse network connectivity (connection probabilityp= 0.3 between MCs and GCs) and sharply heterogeneous afferent activation lev-els. The explicit, multiscale nature of this dynamical model further enables the elaboration, explanation, and experimental testing of the underlying mechanistic details that may underlie these observed physiological phenomena.
Results
Odor stimulation induces broadly coherent gamma oscillations across
the OB network
Fig 2. Odor stimulation induces gamma oscillation in the 2D OB model. A: Steady-state OSN input intensities (top) and odor-evoked firing rates
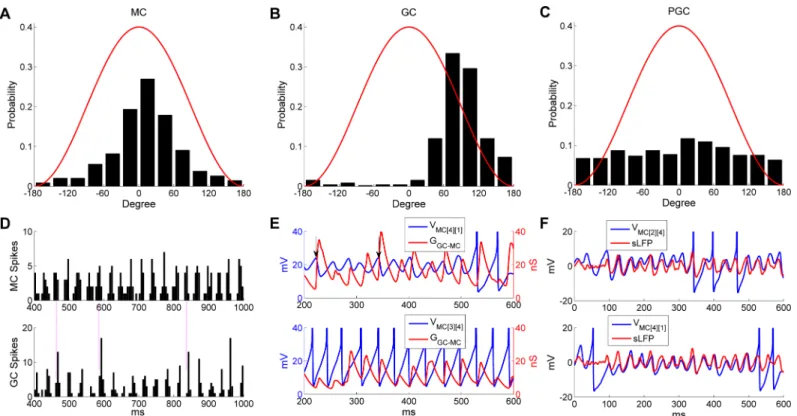
observed in the subthreshold voltage fluctuations (Fig 2F1) or spiking activity of PGCs (Fig 2F2). Population spike histograms of MCs, GCs and PGCs with corresponding frequency power spectra are shown inFig 2D3, 2E3 and 2F3respectively. The population spiking activi-ties of both MCs and GCs exhibited gamma rhythmicity, and the frequency was the same as that measured from the sLFP (32.4 Hz;Fig 2D3 and 2E3). By comparison, no rhythmicity was observed in the PGC population spike histogram, and the frequency power spectrum was flat (Fig 2F3).
Examined in aggregate, MC spikes were phase-constrained within the common, coherent gamma cycle of the OB network. The majority of MC spikes were evoked near the crest of the oscillatory sLFP (Fig 3A). GC spikes also were phase-constrained within the gamma cycle, occurring predominantly during the descending phase of the sLFP (Fig 3B). In contrast, PGC spikes were not phase-constrained, but were distributed uniformly across the gamma oscilla-tion cycle (Fig 3C).
Because of the tight phase-locking between MC/GC spikes and the sLFP cycle, the gamma rhythm also was evident in MC/GC population spiking activities (Fig 3D). The tightly alternat-ing relationship between MC and GC population spikalternat-ing, but not PGC spikalternat-ing, suggested that this temporal delimiting of MC activity arose from effective feedback inhibition delivered by granule cells. To illustrate this point, we plotted the voltage traces of a weakly-activated MC and a strongly-activated MC against their respective cumulative GC-mediated GABAA con-ductances (Fig 3E). The weakly-activated MC STO depolarized directly as its inhibitory con-ductance decayed (Fig 3E,upper panel) and the strongly-activated MC fired only after release from inhibition (Fig 3E,lower panel). Moreover, the inhibitory conductance increased again directly following the evocation of MC spikes, initiating the next excitation-inhibition cycle. Sufficiently strong inhibitory GC input also effectively reset the phase of MC STOs (Fig 3E, upper panel,arrows), consistent with experimental observation and earlier cellular models [28,
37–39]. In principle, such resets erase the history imposed by longer-timescale internal dynam-ics, thereby enabling afferent input levels across the MC population to determine the depolari-zation rates in each MC from a common starting state, potentially governing MC spike phase as well as spike probability [39,50]. Moreover, recurrent resets also serve to supersede the intrinsic frequency of MC STOs, enabling the network to oscillate at a frequency faster than that generated by intrinsic STO dynamics [35]. In aggregate, these reciprocal interactions between MCs and GCs synchronized MC internal dynamics and MC spikes, incorporating them into a coherent gamma oscillation in which MC spikes were reliably phase-constrained with respect to the common oscillatory sLFP of the network (Fig 3F; [10,13]).
Functional computations in the olfactory bulb are generally independent of the physical distance between columns [2,51–54], though their underlying biophysical mechanisms often have proximity-dependent properties. We therefore asked whether the distance-dependent spike propagation delays along MC lateral dendrites were sufficiently heterogeneous to impair the global coherence of gamma oscillations across the OB circuit. To visualize the propagation delay as a function of distance, the membrane potentials of a representative MC (MC[2][2]) were recorded from the soma and from the locations of three reciprocal synapses distributed along the lateral dendrite (at 80μm, 235 μm, and 500 μm from the soma;Fig 4). These three synapses connected, respectively, to an adjacent GC (GC[5][4]), a GC connecting near the middle of the lateral dendrite (GC[6][3]), and a GC connecting at the end of the lateral
(top) with frequency power spectrum (bottom). Bin width as in D. F: PGC population spikes do not exhibit gamma synchrony. F1: Voltage responses of two typical pairs of PGCs during odor presentation. F2: Spike raster plot of PGC population activity. The red arrow designates the onset of odor input. F3: PGC population activity (top) with frequency power spectrum (bottom). Bin width as in D.
Fig 3. MC and GC spikes, but not PGC spikes, are phase-constrained within common gamma cycles. A: Distribution of MC spike phases with
respect to sLFP oscillations. B: Distribution of GC spike phases with respect to sLFP oscillations. C: Distribution of PGC spike phases with respect to sLFP oscillations. D: Spike timing histograms of MCs (upper) and GCs (bottom). Bin width is 5 ms and all MC/GC spikes are summed in each bin. Vertical lines accentuate the alignment of spike time distributions. E: MC STOs with associated cumulative GC-mediated GABAAsynaptic conductance (top) and
MC spikes with associated cumulative GC-mediated GABAAsynaptic conductance (bottom), during an odor presentation. The vertical black arrows
indicate STO phase resets generated by GABAergic input. F: Synchronization of MC STOs with the sLFP. The MC voltage was raised by 80 mV in E and 60 mV in F for display purposes.
https://doi.org/10.1371/journal.pcbi.1005760.g003
Fig 4. Propagation delay of MC action potentials along the lateral dendrite. A: MC membrane voltages recorded at the soma and three different
locations on the lateral dendrite (80μm, 235μm and 500μm from the soma). B: Expanded view of the spike propagation delay along the lateral dendrite.
dendrite (GC[0][1]). Subthreshold activity in the MC dendrite was slightly hyperpolarized as the recording site progressed away from the soma, but spikes propagated at essentially full amplitude (Fig 4A). Spike propagation was rapid, with less than 1 ms delay from the soma to the end of the 500μm dendrite (Fig 4B), suggesting that heterogeneous spike propagation delays would have little effect on network synchronization. This reflects the experimental observation that spikes fully propagate along a MC lateral dendrite with little delay (Fig 2 in [55]), and is consistent with previous computational work in which spike backpropagation along MC lateral dendrites activates granule cells independently of distance [56].
Mitral cell STOs enhance network synchronization
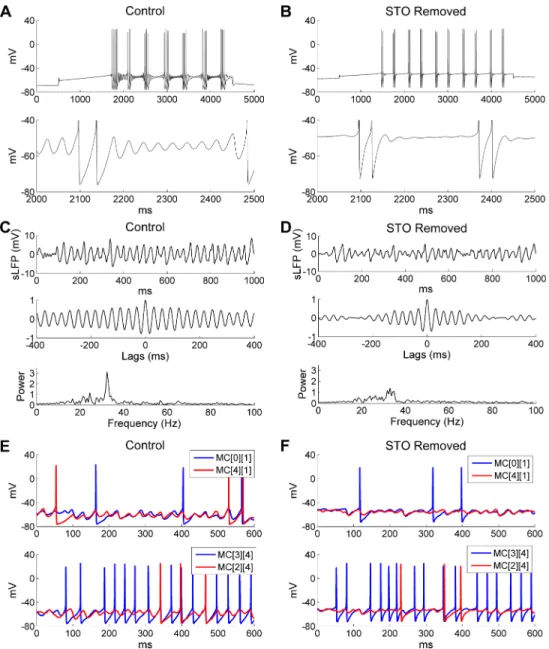
It has been proposed that gamma oscillations in the OB depend on MC STOs [28,33]; how-ever, in the PING framework, the pyramidal (excitatory) neurons generally do not exhibit res-onance. We therefore asked whether and how MC STOs contribute to the robustness, power, and regularity of gamma coherence and spike synchronization in the active OB network. To investigate this, we first removed STOs from model MCs and examined the effect of this change on network dynamics. Specifically, STOs were eliminated by replacing the persistent sodium current (INaP) in all MCs of the network with ohmic cation currents scaled to maintain the same MC firing rates under the same current injection levels (Fig 5A and 5B; [39]). The cation current was modeled asICAT=gCAT(v−ECAT), wheregCAT= 0.26mS/cm2andECAT= 0 mV. Under this manipulation, the power and regularity of odor stimulus-induced network gamma were substantially reduced and sLFP oscillations became less coherent, as evidenced by reduced persistence in the autocorrelogram and a lower, flatter peak in the power spectrum (compareFig 5CwithFig 5D). An examination of membrane potential timeseries from two pairs of MCs revealed that, although MCs without intrinsic STOs could still display subthresh-old voltage fluctuations owing to phasic inhibition from granule cells, these fluctuations had smaller amplitudes and were much less regular compared with intact STOs in control cells (compareFig 5EwithFig 5F). MC spikes also became less synchronized with one another in the absence of intrinsic STOs (compareFig 5EwithFig 5F,bottom panels), although the mean odor-evoked MC firing rates were essentially identical (Control: 14 Hz;STO removed: 13.2 Hz). Finally, the synchronization index (SI) was reduced from 0.64 in controls to 0.53 when STOs were removed. Hence, MC resonance contributed substantially to the integrity and regularity of coherent gamma oscillations in the active OB network, even when the intrinsic STO fre-quency was superseded by the PING-like mechanisms of the network frefre-quency (see below). The added stability and robustness of OB gamma oscillations contributed by these MC reso-nance properties resembles the advantages of resoreso-nance-induced gamma (RING) oscillations [57], with the important distinction that RING is described for resonant inhibitory interneu-rons, whereas in the OB network it is the excitatory principal neurons that are resonant. The mechanism of OB oscillations can be described as pyramidal resonance interneuron network gamma (PRING), thereby acknowledging the PING-like properties of the activated gamma oscillation as well as the additional properties afforded by MC resonance.
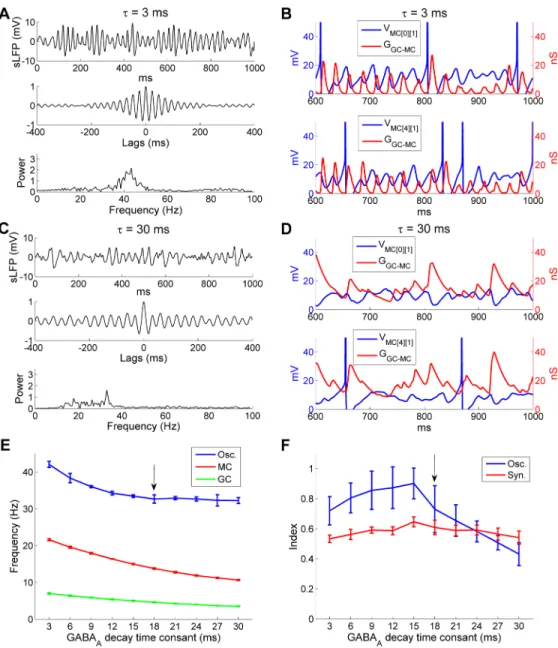
Faster network time constants supersede intrinsic STO frequencies
during sensory activation
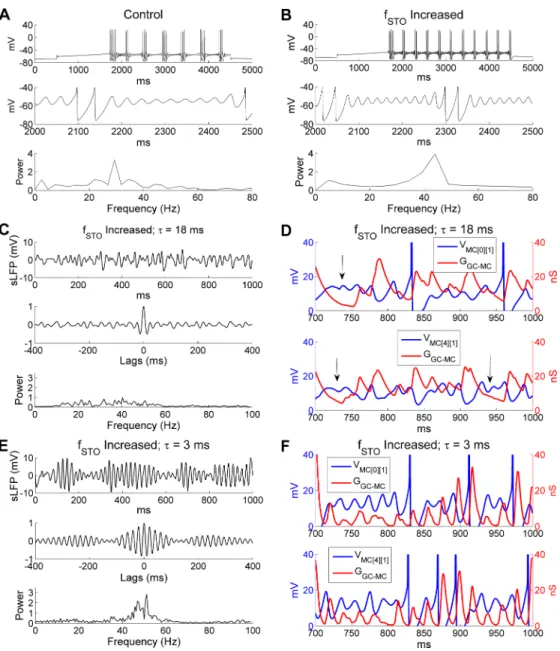
oscillation. To test this, we increased the intrinsic MC STO frequency by reducing the time constant of the activation variable of the slow potassium current (IKS) [33]. Specifically, we reduced the activation time constant ofIKSfrom 10 ms to 5 ms, and increased the conductance densities of theIKSandINaPcurrents by factors of 1.6 and 1.3 respectively to maintain approxi-mately the same STO amplitudes and MC firing rates. These modifications increased the STO frequency in an isolated MC model cell from 29 Hz (in controls) to 44 Hz in response to a 200 pA depolarizing current injection (Fig 6A and 6B). Without altering any other model
Fig 5. Removing MC STOs impairs OB gamma oscillations. A: Voltage response of an isolated MC model
cell to a 0.2 nA current injection (top) and an expanded view of the STOs (bottom) under control conditions. B: As in A, but after MC STOs were removed. C: Simulated LFP (top) during odor presentation, with autocorrelation (middle) and frequency power spectrum (bottom) under control conditions (same asFig 2B). D: As in C, but after MC STOs were removed. E: Voltage responses of two pairs of MCs under control conditions. F: As in E, but after MC STOs were removed. The MC STOs were removed by replacing the persistent sodium current (INaP) with an
ohmic cation current; the conductance of this current was tuned to maintain the same firing frequency.
parameters, this change in the intrinsic STO frequency seriously disrupted the sLFP gamma rhythm and sharply reduced gamma power in the OB network (compareFig 6CwithFig 5C).
Fig 6. Higher intrinsic MC STO frequencies require faster GABAergic synaptic decay to synchronize activity. A: Voltage response of an isolated MC model cell to a 0.2 nA current injection (top), an expanded view
of the STOs (middle), and the STO frequency power spectrum (bottom) under control conditions. B: As in A, but with a higher intrinsic STO frequency. C: Simulated LFP (top) during odor presentation, with autocorrelation (middle) and frequency power spectrum (bottom) under conditions in which the STO frequency was increased while the decay time constant of the GC-mediated GABAAsynaptic conductance remained unchanged (18 ms).
D: Plot of MC STOs with associated cumulative GC-mediated GABAAsynaptic conductance when STO
frequency was increased. The vertical black arrows indicate multiple STO cycles during one single GABAA
conductance decay. E: As in C, but when the decay time constant of the GC-mediated GABAAconductance was
reduced to 3 ms (from 18 ms) in the presence of the higher intrinsic STO frequency. F: As in D, but when the decay time constant of the GC-mediated GABAAconductance was reduced to 3 ms in the presence of the
higher intrinsic STO frequency. The MC STO frequency was increased by reducing the activation time constant of the slow-inactivating potassium current (IKS) while increasing the maximal conductances of INaPand IKSto
maintain the same firing frequency. The MC voltage was raised by 70 mV in D and F for display purposes.
A comparison of STO voltage timeseries with the aggregated GABAAconductances in the same MCs confirmed that GC inhibition could no longer effectively regulate MC STOs, which became irregular (Fig 6D). Phase locking between MC spikes and sLFP oscillations also was significantly reduced (SI, controls: 0.64;increased STO frequency: 0.38), although the average odor-evoked MC firing rate was virtually unchanged (controls: 14 Hz;increased STO fre-quency: 14.4 Hz).
If this disruption was due to a mismatch between intrinsic STO frequency and the natural frequency of the network oscillation, as predicted, rather than to some separate effect of the changes made to the model MCs, then the coherence of OB gamma oscillations should be restored if the natural frequency of the network oscillation was also increased so as to again be faster than those of the MC STOs. In PING and ING networks, the natural frequency of net-work oscillations depends strongly on the decay time constant of the inhibitory synapse [32,
58]. Indeed, when the GABAAreceptor decay time constant of the GC!MC synapses was reduced to 3 ms (from the default 18 ms), in a network populated with MCs exhibiting the higher intrinsic STO frequency, a strong gamma oscillation re-emerged at 51.3 Hz (Fig 6E)– considerably faster than the 32.4 Hz frequency exhibited by control networks. Under these conditions, MC STOs again displayed rhythmicity and were entrained effectively by GC-medi-ated GABAAsynaptic conductances (Fig 6F); network synchrony also was substantially restored (SI, controls: 0.64; increased STO frequency alone: 0.38; increased STO frequency + 3 ms synaptic decay time constant: 0.56). These simulations indicate that the decay rate of GC-mediated GABAAinhibition must be faster than the intrinsic MC STO frequency in order to be able to synchronize MC dynamics.
by the intrinsic frequency of MC STOs. However, there also was a clear peak (15 ms;Fig 7F), indicating that the strongest network oscillatory power could be achieved by an optimal matching of the synaptic and STO timescales. Additionally, these results demonstrated that
Fig 7. The OB gamma oscillation frequency is responsive to faster, but not slower, GABAAdecay time
constants. A: Simulated LFP (top) during odor presentation, with autocorrelation (middle) and frequency
power spectrum (bottom), when the decay time constant of the GC-mediated GABAAconductance was
reduced from 18 ms to 3 ms. B: Plot of MC STOs with associated cumulative GC-mediated GABAAsynaptic
conductance when the latter had a decay time constant of 3 ms. C: As in A, but when the decay time constant of the GC-mediated GABAAconductance was increased from 18 ms to 30 ms. D: As in B, but when the decay
time constant of the GC-mediated GABAAconductance was increased from 18 ms to 30 ms. E: Average
odor-evoked MC and GC firing rates and sLFP oscillation frequency as functions of the decay time constant of the GC-medicated GABAAconductance. F: Synchronization and oscillation indices as functions of the decay
time constant of the GC-medicated GABAAconductance. The default (control) decay time constant in this
study was 18 ms (indicated by black arrows in E, F). Error bars denote standard deviations (SD). The MC voltage was raised by 70 mV in B and D for display purposes.
the network oscillation frequency was robust to substantial changes in mean spike frequencies in both MCs and GCs.
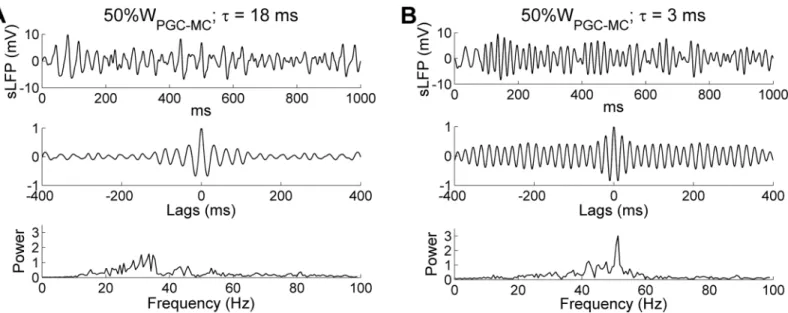
Finally, we decided to increase the intrinsic MC STO frequency by increasing the excitation levels of all MCs, rather than by altering theirIKSandINaPconductance parameters as above, in order to test whether similar dynamical effects resulted. Depolarizing MCs increases their intrin-sic STO frequencies both experimentally [28] and in the present model. To broadly increase MC excitation while retaining the same heterogeneous odor inputs, we decreased the level of PGC-mediated inhibition on MCs by reducing the PGC!MC synaptic weight to half of the control value (from 4 to 2). The results largely conformed to those observed when STO frequencies were increased by adjusting cellular conductance parameters (Fig 6). Under default parameters (with an 18 ms GABAAdecay time constant), reducing PGC inhibitory weights by half had no effect on the network oscillation frequency (controls: 32.4 Hz; 50%WPGC-MC: 33.6 Hz), but did impair the coherence and stability of field potential oscillations and reduce the oscillation index (peak spectral power; compareFig 8AwithFig 2B). In contrast, when using a faster GC synaptic decay time constant of 3 ms, this reduced PGC inhibition produced a coherent gamma oscillation at a higher peak frequency (controls: 32.4 Hz; 3 ms decay time constant only: 43.4 Hz; 3 ms decay time constant + 50%WPGC-MC: 51.3 Hz;Fig 8B), because the faster synaptic decay was again able to effectively reset the intrinsic MC STOs on every cycle. This result further suggests that higher overall levels of MC excitation, which generate faster intrinsic STO dynamics, would require correspondingly faster synaptic inhibition kinetics in order to maintain network stability, and thereby demonstrates the importance of maintaining a limited range of mean MC activity levels via global afferent activity normalization ([59]; corrected mechanism in [54]).
Optimal inhibitory synaptic weights are required for strong and coherent
OB gamma oscillations
The synaptic weight of GC!MC inhibition also is an important factor in determining the sta-bility of network gamma oscillations. To assess this effect, we varied the GC!MC synaptic
Fig 8. Gamma oscillation frequency is determined by the decay time constant of the GC-mediated GABAAsynaptic conductance. A: Simulated LFP (top) during odor presentation, with autocorrelation (middle) and frequency power spectrum (bottom), when PGC!MC synaptic weights were reduced by 50% while maintaining the same decay time constant (18 ms). B: As A, but with a reduced decay time constant of the GC-mediated GABAAconductance
(3 ms) in addition to a 50% reduction in PGC!MC synaptic weights.
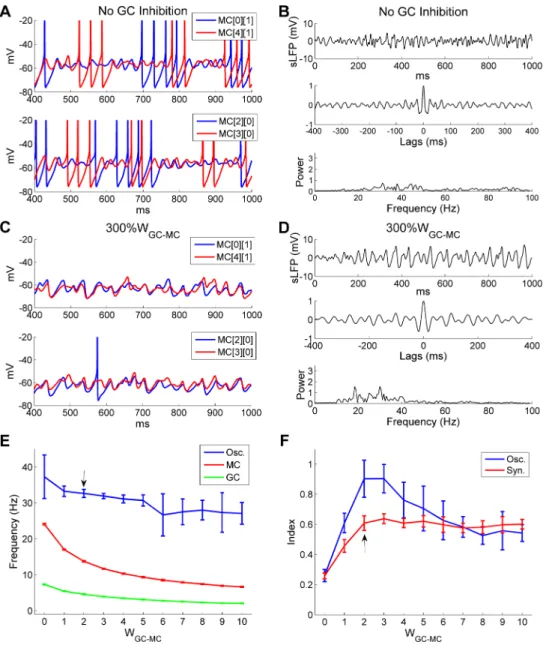
weight (WGC!MC) from zero (full blockade) up to five times the default value. Under full blockade conditions, MC spikes and STOs were desynchronized (Fig 9A) and network sLFP oscillations were dramatically reduced (compareFig 9BwithFig 2B). Whereas overall spike rates increased substantially (average odor-evoked spike rate, controls: 14 Hz; no GC inhibi-tion: 24 Hz), synchronization among MC spikes was sharply reduced (SI, controls: 0.63; no GC inhibition: 0.30). These results further confirm that GC-mediated feedback inhibition is necessary for the synchronization of mitral cells into a coherent gamma rhythm in the OB.
Fig 9. There is an optimal GC!MC synaptic strength for strong and coherent OB gamma oscillation.
A: Membrane potential timeseries of two pairs of MCs during odor presentation without GC inhibition. B: Simulated LFP (top) during odor presentation, with autocorrelation (middle) and frequency power spectrum (bottom), in the absence of GC inhibition. C: As in A, but with a 3-fold increase of the GC!MC synaptic weight (300%WGC-MC). D: As in B, but with 300%WGC-MC. E: Average odor-evoked MC and GC firing rates
and sLFP oscillation frequency as functions of GC!MC synaptic weights. F: Synchronization and oscillation indices as functions of GC!MC synaptic weights. The default GC!MC synaptic weight in this study was 2 (indicated by black arrows in E, F). Error bars denote standard deviations (SD).
In contrast, whenWGC!MCwas increased threefold (from 2 to 6), MC spiking activity was reduced substantially (controls: 14.0 Hz; 300%WGC!MC: 8.4 Hz) and STOs were corrupted by an irregular mixture of shorter and longer oscillation periods, though MC membrane potential fluctuations were still moderately well-coordinated (Fig 9C). The frequency power spectrum reflected this disruption, presenting a number of low-power peaks (Fig 9D); two of these (at 18.3 Hz and 29.9 Hz) were somewhat more distinct, though both remained well below control amplitudes (compareFig 9DwithFig 2B). These results indicate that excessive inhibition of MCs by large GC!MC synaptic weights impairs network gamma oscillations by disrupting STO periodicity.
The frequency of the network sLFP oscillation and the mean spike rates of both MCs and GCs declined asWGC!MCincreased from 0 to 6 and remained stable thereafter (Fig 9E). In contrast, the synchronization index rose substantially asWGC!MCincreased from 0 to 2 and maintained this level for all larger synaptic weights measured (Fig 9F). The oscillation index (spectral peak amplitude) also increased greatly asWGC!MCgrew from 0 to 2, but then pro-gressively decreased onceWGC!MCexceeded 3 (Fig 9F). This pattern of results indicates that the degradation of gamma oscillatory power at larger GC!MC weights was not a result of reduced phase coupling, but of disrupted STO periodicity (Fig 9C). In sum, while sufficient GC inhibition is required to reset and synchronize MC STOs, excessive GC synaptic weights are detrimental to the stability of the gamma rhythm; an optimal level of GC inhibition is required to sustain a strong and coherent gamma oscillation.
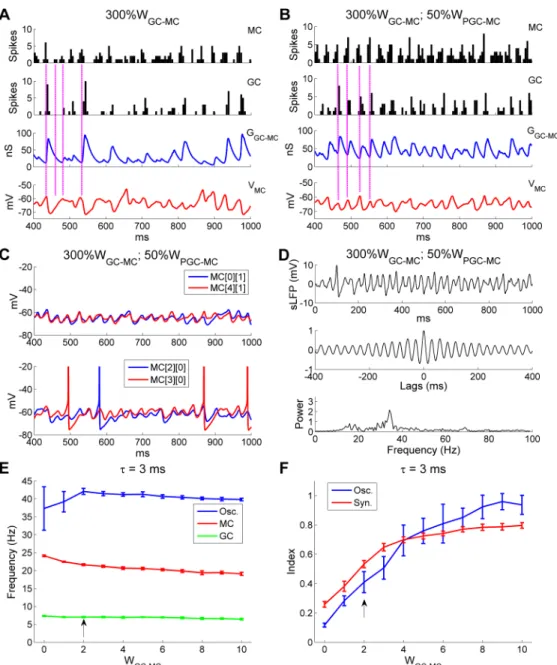
To understand in detail why larger GC!MC synaptic weights impaired gamma rhyth-micity, we plotted spike time histograms for both MCs and GCs alongside the membrane potential timeseries of a representative MC and the aggregate GC-mediated GABAA conduc-tance of that MC, all under the disruptive conditions of a 3-fold increase inWGC!MC(Fig
10A; same parameters asFig 9C and 9D). At a timepoint marking a surge of synchronous MC spiking activity, GCs responded in turn with higher-than-average activity (Fig 10A,top and second panels,leftmost vertical line). Because of the largeWGC!MC, this surge in GC activity evoked a particularly enlarged (and correspondingly persistent) GABAergic chloride conductance in MCs (Fig 10A,third panel,leftmost vertical line), which substantially hyper-polarized MC membrane potentials (Fig 10A,bottom panel,leftmost vertical line) and, in aggregate, noticeably suppressed MC firing across the network (Fig 10A,top panel,second vertical line). This reduced level of MC activity, in turn, did not induce any GC spiking in that cycle (Fig 10A,second panel,second vertical line). As the GABAergic chloride conduc-tance continued to decay (Fig 10A,third panel,second vertical line), marginally increased numbers of spikes were generated from the MC population (Fig 10A,top panel,third vertical line), which evoked weak responses in GCs (Fig 10A,second panel,third vertical line) and hence much smaller GABAergic conductances that only minimally hyperpolarized MC membrane potentials (Fig 10A,third and bottom panels,third vertical line). After a few such “small” cycles, the MCs recovered from the effects of accumulated inhibition and a high-activity cycle occurred again (Fig 10A,all panels,rightmost vertical line). The irregularity of this recurrent process substantially distorted MC subthreshold activity and gamma rhyth-micity (Fig 9D;Fig 10A,bottom panel).
spikes again reliably drove substantial GC responses in every gamma cycle, the GABAergic synaptic conductance changes became more regular, and the periodicity of MC subthreshold activity was substantially improved (compareFig 10BwithFig 10A). Moreover, MC STOs
Fig 10. OB gamma oscillation impairments arising from excessive GC!MC synaptic weights can be counteracted by reducing PGC inhibition of MCs. A: Spike timing histograms of MCs (top panel) and GCs
(second panel) with associated cumulative GC-mediated GABAAsynaptic conductance (third panel) and MC
STOs (bottom panel) when the GC!MC synaptic weight was increased threefold (300%WGC-MC). B: As in A,
but with an additional 50% reduction in the PGC!MC synaptic weight (50%WPGC-MC). C: Membrane potential
timeseries of two pairs of MCs during odor presentation with 300%WGC-MCand 50%WPGC-MC. D: Simulated
LFP (top) during odor presentation, with autocorrelation (middle) and frequency power spectrum (bottom), with 300%WGC-MCand 50%WPGC-MC. E: Average odor-evoked MC and GC firing rates and sLFP oscillation
frequency as functions of GC!MC synaptic weight when the decay time constant of the GC-mediated GABAA
conductance was reduced to 3 ms (from 18 ms). F: Synchronization and oscillation indices as functions of GC!MC synaptic weight when the decay time constant of the GC-mediated GABAAconductance was reduced
to 3 ms (from 18 ms). The default GC!MC synaptic weight in this study was 2 (indicated by black arrows in E, F). Error bars denote standard deviations (SD).
were again well synchronized, and exhibited greater stability and regularity than under condi-tions of elevated GC inhibition but default PGC inhibition (compareFig 10CwithFig 9C). As a result, the second spectral peak observed inFig 9Dwas eliminated and a single coherent gamma peak again appeared at 34.2 Hz, comparable to the control value of 32.4 Hz (compare
Fig 10DwithFig 2B). The above simulation demonstrates that the detrimental effect of exces-sive GC inhibition on gamma rhythmicity can be ameliorated by reduced PGC inhibition, indicating that an overall balance of excitation and inhibition is required for coherent, stable network gamma oscillations.
Finally, the synaptic weights and decay time constants of GABAAsynapses are not function-ally independent of one another; shorter decay time constants generate less total MC inhibi-tion and a weaker and shorter suppressive effect, all else being equal. We therefore asked whether the optimal inhibitory synaptic weights for robust oscillations and synchronization would differ depending on the synaptic time constant. We generated a network in which the GABAergic decay time constant was reduced from 18 ms (in controls) to 3 ms (as depicted in Fig7A and 7B), and measured network oscillation and spike frequencies and the oscillation and synchronization indices as functions of GC!MC synaptic weight. As predicted, the oscil-lation index (OI) peak and theSIplateau both occurred at substantially higher inhibitory syn-aptic weights when using the faster decay time constants (compareFig 10E and 10FtoFig 9E and 9F). The inhibitory synaptic decay time constant therefore also must be factored into the balance between excitation and inhibition that enables stable and coherent gamma oscillations across the OB network.
Oscillatory dynamics are tolerant of increased excitatory synaptic
weights
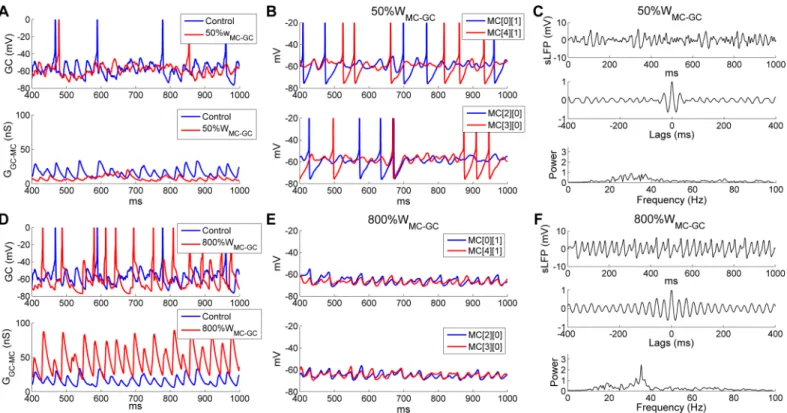
The functional efficacy of feedback inhibition in the OB EPL depends on the synaptic weights of both the inhibitory GC!MC and the excitatory MC!GC synapses. If a balance between excitation and inhibition is required for strong and stable gamma oscillations across the OB, then an optimal range of excitatory MC!GC synaptic weights may also exist. However, because MC!GC synapses onto adult-born GCs are plastic [47,48], the EPL network would be expected to tolerate a substantial range and heterogeneity among these synaptic weights. To examine the functional range of synaptic weights for the excitatory MC!GC synapses in this network, we varied the MC!GC synaptic weight (WMC!GC) from 0 up to 8 times the default value. When these synapses were blocked (i.e.,WMC!GC= 0), GCs were largely inactive (0.9 Hz spontaneous background activity); other simulation results were similar to those obtained when blocking GABAergic synaptic transmission (i.e.,WGC!MC= 0;Fig 9A and 9B) and are not separately reported here. WhenWMC!GCwas reduced to 50% of the default value (from 1 to 0.5), the GC subthreshold potential was substantially hyperpolarized and lost much of its rhythmicity compared with controls (Fig 11A,upper panel), leading to significantly smaller and arrhythmic GABAergic chloride currents in MCs (Fig 11A,lower panel). Because of this reduced phasic GC inhibition, MC activity increased, but both MC spikes and STOs were rela-tively desynchronized (Fig 11B), and gamma oscillations were greatly impaired (compareFig 11CwithFig 2B).
8-fold increase in the MC!GC synaptic weight, with little change in frequency (controls: 32.4 Hz; 800%WMC!GC: 35.4 Hz;Fig 11F).
To break this effect down further, we generated raster plots of MC and GC firing under these two conditions. WhenWMC!GCwas reduced by 50%, the mean odor-evoked GC firing rate was reduced from 4.6 Hz (in controls) to 2.6 Hz, resulting in a slight increase in the mean MC firing rate from 14 Hz (in controls) to 17.7 Hz. As noted above, network synchrony was reduced substantially (SI, controls: 0.63;50%WMC!GC: 0.40), because neither MC nor GC spike trains were well coordinated (Fig 12A and 12B). In contrast, with an eightfold increase in WMC!GC, GC firing rates were greatly increased (controls: 4.6 Hz;800%WMC!GC: 12.8 Hz) and GC spikes became remarkably well synchronized; this strong GC activation substantially suppressed MC firing (controls: 14 Hz; 800%WMC!GC: 3.3 Hz;Fig 12C and 12D). This sub-stantially different balance of MC and GC activity was stable because one MC input was strong enough to produce correlated discharges in many postsynaptic GCs. Notably, under these con-ditions the mean MC firing rate (3.3 Hz across all MCs) was much lower than the oscillation frequency (35.4 Hz) and a majority of MCs exhibited no odor-evoked spikes (Fig 12C). The spikes of the remaining active MCs were effectively entrained by the highly synchronous GC activity, and exhibited elevated levels of synchrony (SI, controls: 0.63;800%WMC!GC: 0.92); i.e., coherent gamma oscillations persisted despite substantial increases in lateral excitatory synaptic weights. This is a particularly important stabilizing property given that the intrinsic OB synaptic plasticity underlying odor learning relies on the potentiation of excitatory synap-ses [47,48].
Fig 11. OB gamma oscillations are robust to strongly increased, but not reduced, MC!GC synaptic weights. A: Voltage timeseries of representative
GCs (top) and GC-mediated GABAAsynaptic conductances on MCs (bottom), under control conditions and following a 50% reduction of MC!GC synaptic
weights (50%WMC-GC). B: Membrane potential timeseries of two pairs of MCs with 50%WMC-GC. C: Simulated LFP (top) during odor presentation, with
autocorrelation (middle) and frequency power spectrum (bottom), with 50%WMC-GC. D: As in A, but under control conditions compared with an eightfold
increase in the MC!GC synaptic weight (800%WMC-GC). E: As in B, but with 800%WMC-GC. F: As in C, but with 800%WMC-GC.
The average odor-evoked MC/GC firing rates and sLFP oscillation frequencies across a range of MC!GC synaptic weights are depicted inFig 12E. AsWMC!GCwas increased, MC firing rates decreased while GC firing rates increased, eventually crossing. In contrast, the sLFP oscillation frequency remained stable (though unreliable at weights below 1 owing to very low spectral power;Fig 12E). TheOIgrew rapidly from its arrhythmic values at MC!GC synaptic weights below 1 up to a strong peak value that persisted across a fourfold range of excitatory synaptic weights, decreasing moderately thereafter (Fig 12F). This eventual decline
Fig 12. Gamma oscillations and spike synchronization persist under a wide range of MC!GC synaptic weights. A: Raster plot of MC spikes after MC!GC synaptic weights were reduced by 50% (50%
WMC-GC). The red arrow designates the onset of odor input. B: Raster plot of GC spikes with 50%WMC-GC. C:
Raster plot of MC spikes after MC!GC synaptic weights were increased eightfold (800%WMC-GC). D: Raster
plot of GC spikes with 800%WMC-GC. E: Average odor-evoked MC and GC firing rates and sLFP oscillation
frequency as functions of MC!GC synaptic weight. F: Synchronization and oscillation indices as functions of MC!GC synaptic weight. The default MC!GC synaptic weight was 1 (indicated by black arrows in E, F). Error bars denote standard deviations (SD).
arose as the increased activation of GCs began to impose tonic, as well as phasic, feedback inhi-bition that further reduced MC activation levels. In contrast, theSIincreased steadily as WMC!GCincreased, gradually approaching unity at higher synaptic weights (Fig 12F).
Gamma oscillations are robust to heterogeneity in afferent input intensity
Heterogeneity in population activity levels, whether across the neurons of an active ensemble or within a given population over time, poses a challenge to the stability and consistency of dynamical systems [60–65]. For example, the frequencies of gamma oscillations driven by pure PING mechanics vary directly with the activation levels of the excitatory neurons [58], which in the olfactory bulb are strongly heterogeneous (indeed, heterogeneity in MC activa-tion levels is the fundamental basis of olfactory sensory representaactiva-tions). Notably, systems of coupled oscillators often are robust to reasonable heterogeneities in excitation levels [66]; indeed, the essence of coupled oscillator systems is a dynamics by which intrinsic differences in the natural frequencies of constituent oscillators are drawn together into a common limit cycle.
To assess the robustness of the OB network gamma oscillation to variance across the affer-ent input levels of MCs, we altered the ranges of excitation generated across the MC popula-tion by simulated odorant stimuli. By default, steady-state odor input intensitiesus(nA) were drawn from a uniform distribution within a bounded range (US1, US2). We first varied the upper input bound US2from 0.4 nA to 1.0 nA with increments of 0.2 nA, with the lower input bound US1fixed at 0.2 nA (Fig 13). When the upper input bound was reduced from 1.0 nA (in controls) to 0.4 nA, the odor-evoked MC firing rate dropped from 14 Hz to 8.8 Hz and the MC firing rate variance was markedly reduced (SD,us2(0.2, 1.0): 9.8 Hz,us2(0.2, 0.4): 1.6 Hz;Fig 13A). Because of the reduced MC drive, the odor-evoked GC firing rate also declined from 4.6 Hz to 2.4 Hz, and the reduction in GC excitation generated much smaller GABAA conductance fluctuations on MCs (Fig 13B); this feedback response limited the overall change in the balance of excitation and inhibition. Despite these changes in firing rates and the ampli-tudes of synaptic interactions, MC oscillations remained highly synchronized under both con-ditions (Fig 13C), and the synchronization index was essentially unchanged (SI,us2(0.2, 1.0): 0.63;us2(0.2, 0.4): 0.62), and the frequency of the dominant sLFP spectral peak was only slightly reduced (us2(0.2, 1.0): 32.4 Hz;us2(0.2, 0.4): 28.7 Hz; compareFig 13DwithFig
2B).
The mean odor-evoked neuronal firing rates and sLFP oscillation frequencies across a range of upper input bounds are depicted inFig 13E. As the upper input bound increased from 0.4 nA to 1.0 nA, the mean MC firing rate increased 58.6% (from 8.7 Hz to 13.8 Hz) and that of GCs increased 76.9% (from 2.6 Hz to 4.6 Hz). In contrast, there was only a 14.3% increase in oscillation frequency (from 28.6 Hz to 32.7 Hz), demonstrating the relative robust-ness of OB gamma frequency to input variance. The synchronization and oscillation indices for the same range of upper input bounds are shown inFig 13F. Both indices also demon-strated considerable stability in response to changes in the upper input bound.
(Fig 14D; also compareFig 14BwithFig 2B). However, despite this large increase in the mean MC firing rate, the sLFP oscillation frequency remained remarkably stable (us2(0.2, 1.0): 32.4 Hz;us2(0.8, 1.0): 31.1 Hz;Fig 14C).
Fig 13. OB gamma oscillations are robust to variation in the steady-state upper bound of afferent input. A: Odor-evoked firing rates of all 25 MCs under control conditions (top) and following a reduction in the
steady-state upper input bound (US2) from 1.0 nA to 0.4 nA (bottom). B: Timeseries of cumulative
GC-mediated GABAAsynaptic conductances in two representative MCs under control conditions (top) and
following a reduction in the steady-state upper input bound from 1.0 nA to 0.4 nA (bottom). C: Membrane potential timeseries in two representative MCs under control conditions (top) and following a reduction in the steady-state upper input bound from 1.0 nA to 0.4 nA (bottom). D: Simulated LFP (top) during odor presentation, with autocorrelation (middle) and frequency power spectrum (bottom), after the steady-state upper input bound was lowered to 0.4 nA. E: Average odor-evoked MC and GC firing rates and sLFP oscillation frequency as functions of the steady-state upper bound of afferent input (US2). F: Synchronization
and oscillation indices as functions of the steady-state upper input bound (US2). In these simulations, the
steady-state lower input bound was maintained at its default (0.2 nA). The default upper input bound was 1.0 nA (indicated by black arrows in E, F). Error bars denote standard deviations (SD).
Glomerular-layer inhibition enables gamma oscillations by limiting MC
excitation and firing rate heterogeneity
Coupled-oscillator networks are able to synchronize oscillators with nonuniform natural fre-quencies, but this robustness has limitations [61,62,66]. The large differences in input activa-tion that can be generated by primary sensory receptor populaactiva-tions (responding to stimuli varying by orders of magnitude in physical intensity and receptive-field optimality) require regulation if they are to be constrained within the limited permissive range of the EPL’s oscil-latory regime. Specifically, the range of absolute physiological variability generated in primary sensor populations must be compressed into a dynamic range that does not disrupt the func-tional dynamics of subsequent sensory system computations. This need is met in the early olfactory system by a series of concentration tolerance mechanisms (reviewed in [67]), culmi-nating in a global normalization computation in the deep glomerular layer ([59]; corrected mechanism in [54]); this computation is mediated by the heterogeneous periglomerular/short-axon cell population [68,69] and modeled herein by PGCs. To demonstrate the importance of these intensity compression mechanisms and examine the role of PGC-mediated inhibition in enabling OB gamma oscillations, we varied the PGC!MC synaptic weight (WPGC!MC) from 0 to 250% of its default value.
Fig 14. OB gamma oscillations are robust to variation in the steady-state lower bound of afferent input. A: Raster plot of MC spikes when the steady-state lower input bound (US1) was increased fourfold,
from 0.2 nA to 0.8 nA. The red arrow designates the onset of odor input. B: Simulated LFP (top) during odor presentation, with autocorrelation (middle) and frequency power spectrum (bottom), after the steady-state lower input bound (US1) was increased to 0.8 nA. C: Average odor-evoked MC and GC firing rates and sLFP
frequency as functions of the steady-state lower input bound (US1). D: Synchronization and oscillation indices
as functions of the steady-state lower input bound (US1). In these simulations, the steady-state upper input
bound was maintained at its default (1.0 nA). The default lower input bound was 0.2 nA (indicated by black arrows in C, D). Error bars denote standard deviations (SD).
When PGC inhibition was entirely removed (WPGC!MC= 0), the average odor-evoked MC firing rate increased markedly, from 14 Hz (in controls) to 32.2 Hz, inducing a concomitant increase in the mean GC firing rate (from 4.6 Hz to 9.5 Hz; compareFig 15AwithFig 3D). Fir-ing rates within the MC ensemble also displayed a much larger variance when PGC inhibition was removed (SD, controls: 9.8 Hz; No PGC inhibition: 19.3 Hz; compareFig 15BwithFig 2A). Importantly, the removal of PGC inhibition significantly degraded MC spike synchrony (SI, controls: 0.64; No PGC inhibition: 0.39); this reduction inSIarose because of the substan-tial increase in asynchronous background or noisy spiking in MCs (compareFig 15A,upper panel, withFig 3D,upper panel). Nevertheless, GC population activity still retained a high level of rhythmicity comparable to controls (compareFig 15A,lower panel, withFig 3D,lower panel), and imposed strong phasic inhibition on MCs. Examination of MC and GC population activities indicates that GCs spiked only in response to peak MC spike rates (Fig 15A,dashed vertical lines), and the resulting phasic inhibition from GCs only partially suppressed MC spikes (i.e., MC spikes persisted during peak phasic inhibition), in contrast to the complete periodic suppression of MC spikes by GC inhibition in controls (compareFig 15AwithFig 3D). Moreover, spike rates in the most strongly driven MCs exceeded the frequency of the underlying STOs, violating the restrictions of coupled oscillator-derived synchrony and conse-quently wholly desynchronizing with the remainder of the MC population (Fig 15C,lower panel;Fig 15J). Because of the loss of these highly-activated MCs from the synchronous popu-lation, the oscillatory power was considerably reduced in the absence of PGC inhibition (com-pareFig 15DwithFig 2B), although a sizable spectral peak arising from the less-active MC population still persisted, exhibiting little change in frequency (controls: 32.4 Hz;No PGC inhi-bition: 34.2 Hz). This result supports two important points: First, although PGC inhibition improves global synchrony–specifically, it improves global participation in the synchronous ensemble by limiting the absolute activation levels of MCs to within a permissive range–it is not required for the generation of the OB gamma rhythm (Fig 15D), whereas GC inhibition is clearly required for OB gamma oscillogenesis (Fig 9B). Second, and critically, these results make clear that this coupled-oscillator mechanism is capable of sustaining coherent oscilla-tions among participating MCs–i.e., those that are both within the permissive band of afferent activation levels and adequately coupled via MC/GC synaptic weights–irrespective of the addi-tional presence of substantial numbers of active MCs that are non-participants in the coherent assembly (Fig 15C). As MCs are known for high levels of background spiking activity, bothin vitroandin vivobut especially in awake/behaving animals [70], it is critical to determine the extent to which this activity is likely to interfere with the transmission of neural information. Experimental studies and theoretical models of gamma-timescale coincidence detection in the piriform cortex have suggested that such postsynaptic temporal selectivity will naturally exclude most uncorrelated background activity in MCs from affecting third-order neuronal representations of odor information [71,72]. However, the present model is the first to dem-onstrate that timing-based odor representations in the OB can persist in the presence of high levels of uncorrelated background spiking.
Fig 15. PGC inhibition enables OB gamma oscillations by limiting MC excitation and firing rate heterogeneity. A: Spike timing histograms of MCs (top) and GCs (bottom) without PGC inhibition (0%
Both the MC and GC mean firing rates decreased rapidly asWPGC!MCincreased further, whereas the sLFP oscillation frequency was stable below the control value and declined mod-estly at higher levels of PGC inhibition (Fig 15I), from 34.5 Hz atWPGC!MC= 0 to 24.2 Hz at WPGC!MC= 10. The synchronization index increased along with the strength of PGC inhibi-tion up until the control value, and remained largely stable under stronger PGC!MC inhibi-tory weights (Fig 15J). In contrast, the oscillation index peaked around the control value and declined rapidly at higher PGC weights (Fig 15J). The discrepancy betweenSIandOIat large WPGC!MCvalues arises largely from the fact that decreasing the numbers of spiking MCs does not reduce theSI, whereas theOIis sensitive to the desynchronization of driver currents and other subthreshold activity occurring among less strongly activated neurons. This highlights the fact that a correspondence between MC spikes and LFP deflections alone does not suffice to ensure coherent gamma oscillations.
These results show that PGC-mediated inhibition can serve to constrain the majority of MCs within a permissive range of activation. This constraint both protects the relational acti-vation differences among MCs that underlie odor quality encoding and enables these odor-activated MCs to participate in a globally coherent gamma-oscillatory ensemble that constrains MC spike timing. Moreover, this globally coordinated oscillation, and the underlying phase-constraint of STOs and spikes in a majority of MCs, is robust to the potentially disruptive impact of highly active but uncorrelated MCs, whether uncorrelated owing to overstimulation or to inadequate coupling.
Gamma oscillations are robust to network size
Our OB network model contained 25 MCs, 25 PGCs and 100 GCs, a small fraction of the num-ber of neurons in the biological OB; additionally, the ratio between the numnum-bers of GCs and the numbers of MCs and PGCs is far greater than is represented in the model [1]. To test whether gamma oscillation in our model was robust to variations in this ratio, we increased the number of GCs (NGC) from 100 to 225 (1515 array inFig 1B) and 400 (2020) respec-tively, while maintaining the number of MCs and PGCs at 25 each. To correct for the increased total inhibition that would be delivered onto MCs, we scaled down the maximal conductance of individual GC!MC synapses by the same factor such that the total GABAAconductance received by each MC remained relatively constant. When NGCwas increased to 225, the mean odor-evoked MC and GC firing rates remained relatively unchanged (controls, MC: 14 Hz, GC: 4.6 Hz;NGC= 225, MC: 13 Hz, GC: 4.2 Hz). Both MC and GC spikes displayed clear syn-chronization, and MCs displayed appropriately sparse spiking activity (Fig 16A and 16B). A dominant spectral peak in the sLFP power spectrum persisted at almost the same frequency and power as controls (controls: 32. 4 Hz;NGC= 225: 33.6 Hz; compareFig 16CwithFig 2B).
When NGCwas increased to 400, the mean odor-evoked MC and GC firing rates also
remained stable (controls, MC: 14 Hz, GC: 4.6 Hz;NGC= 400, MC: 14.2 Hz, GC: 5.2 Hz), and MC activity remained reasonably sparse (Fig 16D and 16E). A strong coherent gamma oscillation
intensities (top) and the odor-evoked firing rates of all 25 mitral cells (bottom) after PGC-mediated inhibition was blocked. C: Membrane potential timeseries of two example pairs of MCs during odor presentation in the absence of PGC inhibition. D: Simulated LFP (top) during odor presentation, with autocorrelation (middle) and frequency power spectrum (bottom), in the absence of PGC inhibition. E: As in A, but with a twofold increase in PGC!MC synaptic weights (200%WPGC-MC). F: As in B, but with a twofold increase in PGC!MC synaptic
weights. G: As in C, but with a twofold increase in PGC!MC synaptic weights. H: As in D, but with a twofold increase in PGC!MC synaptic weights. I: Average odor-evoked MC and GC firing rates and sLFP oscillation frequency as functions of PGC!MC synaptic weight. J: Synchronization and oscillation indices as functions of PGC!MC synaptic weight. The default PGC!MC synaptic weight was 4 (indicated by black arrows in I, J). Error bars denote standard deviations (SD).
again persisted at approximately the same frequency and power as in controls (controls: 32.4 Hz; NGC= 400: 33 Hz; compareFig 16FwithFig 2B). While this variance does not encompass either the absolute size or the MC-GC ratio of the biological system, it does indicate that gamma oscilla-tions are not highly sensitive to variaoscilla-tions in network size.
Discussion
The olfactory bulb transforms not only the information content of the primary sensory recep-tor input that it receives, but also its underlying coding metric. Large variance in absolute input amplitudes across receptor populations, varying on a slow respiratory timescale of encoding, are transformed by OB neural circuitry into patterns of ensemble spiking activity among OB principal neurons (mitral cells and projecting tufted cells) that are constrained in their amplitude variance and regulated on a fast gamma-band timescale. This emergent fast timescale for signaling is reflected in the gamma-band sLFP oscillations across the OB that are evoked by afferent activation of OB principal neurons, and presumably serves to efficiently integrate olfactory sensory information into the temporally regulated information networks of the central nervous system.
However, the physiological mechanism underlying this transformation has not been clear. Field potential oscillations at many frequencies are ubiquitous across the brain, and have been attributed to several different underlying dynamical frameworks. Each such theoretical frame-work imposes predictable relationships and limitations upon the activities of its constituent neurons, and defines the capacities and vulnerabilities of the network to changes in input
Fig 16. OB gamma oscillation is robust to variation in network size. A: Raster plot of MC spikes after increasing the number of granule cells in the
model (NGC) to 225. The red arrow designates the onset of odor input. B: Raster plot of GC spikes with NGC= 225. C: Simulated LFP (top) during odor
presentation, with autocorrelation (middle) and frequency power spectrum (bottom), with NGC= 225. D: Raster plot of MC spikes after increasing the
number of granule cells (NGC) to 400. E: Raster plot of GC spikes with NGC= 400. F: As in C, but with NGC= 400. The default network size was NGC= 100.
statistics or internal parameter values. Multiple such frameworks–including PING, ING, STO-driven gamma oscillations, and the PRING hybrid mechanism described herein–have been proposed to underlie OB dynamics; among these, the PRING framework best corresponds to experimental observations of OB circuit neurophysiology [28,35,38]. The diagnostic elements of this PRING framework are (1) resonant principal neurons that receive external excitation (unpatterned on the gamma timescale) and exhibit intrinsic STOs, (2) reciprocal connectivity of these principal neurons with spiking inhibitory interneurons that do not separately receive afferent input, (3) a PING-like network oscillation that emerges under afferent activation; its frequency is determined principally by the decay time constant of the GABA(A) receptor con-ductance and must be higher than that of the STOs, thereby enabling a recurrent reset of STO phase in participating principal neurons, and (4) a continued dependence on principal neuron resonance properties during these network oscillations. In the present simulations, excitatory synapses were spike-mediated; inhibitory synapses were realistically graded but also compati-ble with GC spiking. Using a biophysically elaborated multiscale computational model of the OB, we here assessed the capacities and limitations of this PRING framework with respect to the observed properties of the OB circuit and the requirements of the olfactory sensory modality.
First, MCs converge onto piriform cortical pyramidal neurons from positions dispersed across the OB; there is no topographical organization to their projection patterns [73]. Coinci-dence detection in piriform pyramidal neurons [71,72] requires that spike timing relation-ships among converging MCs be regulated by a common clock, so that incoming information is not dominated by random variance. Therefore, even physically distant MCs must be regu-lated by this common clock, indicating that EPL oscillations would need to be coherent across the entire layer, with negligible phase differences among regions. Such spatially extensive zero-phase coherent networks are nontrivial to construct, particularly in the presence of heteroge-neous levels of activity among principal neurons. Coupled-oscillator networks in general, and our model here in particular, can yield robust coherence among excitatory neurons with negli-gible phase drift and across a wide range of physical scales, provided that there is sufficient direct long-distance synaptic coupling between distant columns (as provided here by the long MC lateral dendrites). When long-distance synaptic coupling is reduced in density, the spatial extent of coherence regions in the OB is correspondingly reduced [35], consistent with theo-retical predictions [74–76].
Second, the mechanisms generating gamma oscillations should serve to phase-constrain informative MC spike timing, presumably with respect to a timescale appropriate for the syn-aptic integration time constants of postsynsyn-aptic follower neurons. Indeed, MC spikes are phase-constrained at the gamma/beta timescale [10,13], and their follower neurons in piri-form cortex exhibit key properties of coincidence detectors [71]. However, MCs also exhibit high levels of uninformative background spiking, and are particularly active in awake/behav-ing animals [70]. It is therefore equally important that the oscillogenic mechanism of the OB be robust to high levels of uncorrelated MC spiking. In our model, MC spikes are phase-con-strained by virtue of intrinsic STO dynamics [28], which are periodically reset by GABA(A)-ergic synaptic inputs. The dynamical coordination and synchronization of these STOs and spikes across the full OB model is remarkably robust to the impact of high levels of uncoordi-nated MC spiking input (Fig 15; see also [77]). This robustness, together with the need for mul-tiple convergent inputs to activate piriform pyramidal neurons [78], enables postsynaptic coincidence detectors to selectively respond to informative, temporally-coordinated MC inputs while disregarding MC background activity.
networks are a challenge to synchronize [63–65], and, under many mechanisms, differentially-activated local regions of a heterogeneously-differentially-activated, spatially extensive network will exhibit different preferred frequencies [28,33,35]. Weak coupling has the capacity to pull such regions into a common oscillation, though it is generally effective only across a limited range of preferred frequencies and typically requires several, sometimes many, cycles to achieve syn-chronization [66,79–81]. Stronger coupling, such as the STO phase-reset phenomenon of our coupled-oscillator model, enables a rapid, history-independent coordination among diverse local (columnar) oscillators across a range of activation levels [79]. The afferent activation-dependent differences among MCs in the rate of their recovery from synchronous GC-medi-ated synaptic inhibition have been proposed to generate the spike phase code exported from the OB [49,72]; however, for present purposes, the important factor is that this coupling mode renders global sLFP synchronization robust to the large differences in afferent activation levels that together constitute the primary sensory representation (Figs2,13and14). Some dynam-ical frameworks also are not robust to inhibitory neurons that spike, or to networks in which excitatory or inhibitory neurons fire at dissimilar rates, or at rates far below the common oscil-latory frequency. All of these phenomena are features of the OB network, and are robustly sup-ported by the present model. Finally, global synchronization across the OB must also be robust to sparse network connectivity, and to substantial differences in synaptic weights across the EPL, particularly the excitatory synaptic weights that are modified during the process of odor learning [47,48]. The present model maintains stable oscillations and global synchronization with sparse connections and a wide range of excitatory synaptic weights (Figs11D–11Fand
12).
Fourth, notwithstanding the above, there clearly are limits to the range of absolute input amplitudes that a dynamical system can withstand. The effects of afferent input intensity (con-centration) are mitigated in animals by a series of compensatory mechanisms [67] capped by a global normalization network embedded in the OB glomerular layer, essentially feeding back a global average of input intensity as inhibition onto all MCs. This global normalization function was proposed a decade ago [51,59], but the underlying circuit mechanism has only recently been determined [54]. In the model, as predicted, reduction of this circuit-based concentration tolerance by modifying PGC inhibition increased mean activity and variance across the MC population and disrupted spike synchronization (Figs8and15).
model. In principle, these high-frequency STOs could prevent the slower synaptic inhibition from determining the population frequency of the active network, as illustrated above (Fig 7E); however, in the Brea model, the STOs directly determined network frequency even when slowed to 35 Hz (Fig S5 in [33]). Differences in the properties of synaptic inhibition and GC spiking are more likely to be the main differentiating factors. Second, synaptic inhibition in the Brea model was activated at relatively hyperpolarized potentials (-66 mV), exhibited a rela-tively hard threshold (activated between -66.5 mV and -65.5 mV; Fig 1A of [33]), and was delivered directly to the single somatic compartment of the model cell. In contrast, in the pres-ent model, half-activation of the graded inhibitory synapses occurred at -40 mV, the threshold was much softer (activated between -50 mV and -30 mV), and incoming inhibitory synapses were distributed along an electrotonically extensive lateral dendrite. Third, the Brea model was not readily compatible with sparse GC spiking (i.e., GCs that spike at substantially lower fre-quencies than the population oscillation); in contrast, the present PRING model robustly sup-ports sparse GC spiking during population oscillations.
In sum, the present model demonstrates that the PRING mechanism elucidated in the OB network by [35], when embedded in a multiscale, dynamical biophysical model of MC circuit function, exhibits the full set of dynamical properties that either have been experimentally demonstrated in the OB or are critical theoretical predictions based on experimental data. These experiments demonstrate that OB dynamics can be best described as independent columnar oscillators, coupled by pulsed inhibition, with a network topology based on long-dis-tance, non-topographically organized connections. This elucidation of the essential dynamics of OB oscillogenesis will substantially constrain the plausible mechanistic hypotheses for inter-areal dynamics, such as the transient coherence in the beta band between OB and piriform cor-tex that characterizes particular phases of olfactory investigation.
Methods
The OB network model
The “default” OB network model contained 25 mitral cells (MCs), 25 periglomerular cells (PGCs) cells and 100 granule cells (GCs; [25]). Each MC, together with an associated PGC, represented a separate OB column, each of which was associated with a particular glomerulus and hence a distinct olfactory receptor type. The number of GCs in the model was increased substantially in certain simulations. The MC, PGC and GC single-cell models were Hodgkin-Huxley type conductance-based compartmental models based on those in [25]. In contrast to the 2013 model, the present OB network incorporated physical locations for each OB column in order to model the problems of distance-dependent lateral interactions, such as the differing propagation delays of spikes along MC lateral dendrites [50]. Specifically, the OB surface was modeled as a two-dimensional (2D) space (1 mm x 1 mm), upon which MCs and PGCs (together) and GCs (separately) were arranged in grid arrays with equal spacing in the hori-zontal and vertical directions (Fig 1B). To avoid edge effects, the 2D network was mapped onto a torus. Each neuron was labeled with its column and row numbers in the 2D space start-ing from 0 (i.e., MC[i][j] denoted the MC in theith column and thejth row). In some figures, model neurons were denoted by a single index to enable their distribution along a single axis (e.g., in raster plots). In such cases, that single indexzwas related to the two indicesiandjas follows:z=Ni+j+ 1, where N was 5 for MCs and PGCs and 10 for GCs.