The Evolution of Communication in
a Complex Acoustic Environment
David A. Luther
A dissertation submitted to the faculty of the University of
North Carolina at Chapel Hill in partial fulfillment of the
requirements for the degree of Doctor of Philosophy in the
Curriculum of Ecology
Chapel Hill
2008
ii Abstract
DAVID A. LUTHER: The Evolution of Communication in a Complex Acoustic Environment
(Under the direction of Haven Wiley)
Animals use communicatory signals for species recognition, mate choice, and territory defense. In many cases, communication occurs in the presence of other species with similar signals, which can make it difficult to discriminate conspecific from
heterospecific signals. To avoid interference from syntopic signals, species should partition communication space. I studied partitioning of acoustic space in the dawn chorus of birds in the Amazon basin, an example of communication in high levels of heterospecific background noise.
My research analyzed bird songs to determine whether the timing of signal transmission, the structure of signals, or both, serve to partition the acoustic space among different species. I used a combination of acoustic censuses and field experiments to investigate acoustic partitioning. With the censuses, I documented the times and places at which species sing, and I measured the features of each species’ song to determine their locations in acoustic space. Playback experiments in the field enabled me to test
second experiment revealed that, although the partitioning of acoustic signal space was disjunct, with gaps between nearest species’ signals, the partitioning of acoustic
perceptual space was saturated. Since signals are degraded as they travel through the environment, receivers must respond to degraded signals mixed with background noise. As a consequence, receivers should allow for more variation in signals than signalers include at the source.
iv
DEDICATION
TABLE OF CONTENTS
LIST OF TABLES……….vii
LIST OF FIGURES………..viii
Chapter I. Sources of Background Noise and Animal Communication………. 1
Introduction………. 1
Sources of background noise……….. 4
Signaler adaptations to background noise………. 10
Adaptations to environmental structure……… 15
References………. 19
II. The acoustic community and its influence on signal evolution: bird song in the neotropics……… 24
Introduction……….. 25
Methods………. 27
Results……….. 36
Discussion………. 38
References………. 47
III. Experimental evidence of temporal partitioning in the perception and production of songs in a neotropical dawn chorus……… 61
Introduction……….. 62
Methods………. 66
vi
Discussion………. 71
References………. 75
IV. Acoustic signal space and perceptual space: A comparison in a complex neotropical avifauna………. 82
Introduction……….. 83
Methods………. 85
Results……….. 91
Discussion………. 94
References………. 99
V. Conclusion………... 111
LIST OF TABLES Table
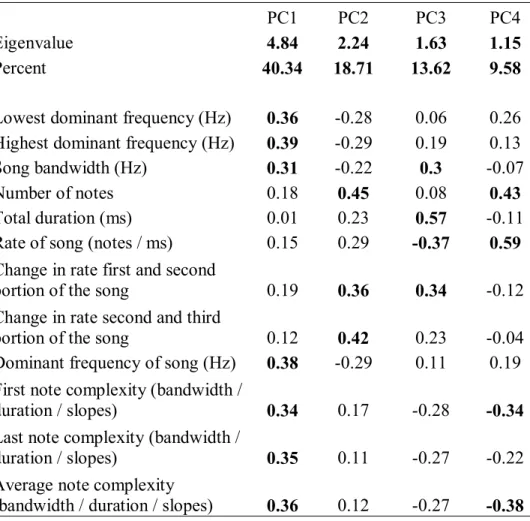
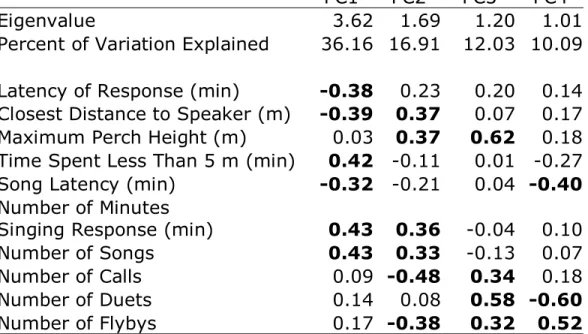
2.1 Principal component loadings for acoustic properties of avian songs……... 52 3.1 Principal component loadings for behavioral responses to playback
experiments……….... 79 4.1 Parameters of synthesized songs………... 102 4.2 Principal component loadings for behavioral responses to playback
viii
LIST OF FIGURES Figure
2.1 Spectrogram of Piprites chloris song………. 53
2.2 Songs of 83 species in two dimensional acoustic space………. 54
2.3 Dispersion of songs in acoustic space……… 55
2.4 Euclidean distance between songs of congeners and random species……... 56
2.5 Euclidean distance between songs of family members and random species..57
2.6 Songs in the same and different stratum……….... 58
2.7 Songs in the inner and outer quartiles of the community acoustic space….. 59
2.8 Vocal activity and distance from the center of acoustic space………... 60
3.1 Mean responses to playback treatments………..…... 80
3.2 Strength of response to playback treatments………... 81
4.1 Sonogram of synthesized songs………. 105
4.2 Mean responses to playback treatments……… 106
4.3 Strength of response to playback treatments………. 107
4.4 Mean species responses to different song morphs……….………...… 108
4.5 Logistic regression of behavioral responses………. 109
SOURCES OF BACKGROUND NOISE
AND ANIMAL COMMUNICATION
ABSTRACT
Animals rely on long-range communication for species recognition, mate selection, and territorial defense, but background noise from the environment can constrain their communication. Background noise from both biotic and abiotic sources is ubiquitous. In
general, noise from abiotic sources has energy mostly below 1 kHz while arthropods tend to produce sounds in the 4 – 10 kHz range. In contrast, most birds and mammals in forests have vocalizations with frequencies between 1 and 4 kHz. There are several ways that signalers could improve the efficiency of their signals to counteract the constraints of background noise. Signalers could make long-term and short-term signal adjustments to increase the detectability of their signals. These adjustments can include increases in contrast between signals and noise or increases in redundancy or intensity of signals. This study reviews the sources of background noise and their influence on animal
communication in terrestrial environments.
INTRODUCTION
2
Vehrencamp 1998; Brenowitz 1982; Ryan & Brenowitz 1985; Wollerman 1999). The maximum distance at which a receiver can separate a signal from noise limits the
possibility of communication to a particular area around the signal. This area, in which a signal can be detected and discriminated by the receiver, is the active space of the signal (Brenowitz 1982).
Many of the factors that determine the active space of a signal have been well studied in the acoustic communication of birds. There have been comprehensive reviews of the physical influences on acoustic signal transmission, including attenuation with increasing distance from the signaler (Morton 1975; Naguib & Wiley 2001; Richards & Wiley 1980; Wiley & Richards 1982). It is clear that when a signal’s amplitude is reduced to a level equal to the sensory threshold of the receiver, the maximum transmission distance has been reached (Klump 1996). However, the physical environment, amplitude of a signal, and sensory thresholds are not the only factors that influence the distance at which a signal can be detected. Background noise is another major determinant of the active space of a signal.
Background noise affects the active space of a signal because it influences both the detection and discrimination of a signal by the receiver (Wiley 1994; Wiley 2006; Wiley & Richards 1982). Detectability is a measure of a receiver’s ability to separate a signal from background noise, whereas discriminability is the ability to separate two signals. Background noise is any energy in the environment that is irrelevant to the
communication between a signaler and a particular receiver. Background noise is
The intensity and nature of background noise have important consequences for signal discrimination. For example, background noise that is loud, near the receiver, and similar to the signal creates greater problems than noise that is quiet, distant and dissimilar (Bradbury & Vehrencamp 1998).
To avoid the negative effects of acoustic interference, signalers should evolve signals that contrast with the background noise of their environment (Endler 1993; Miller 1982; Wiley 1994; Wiley 2006). Since the ability to communicate is limited by the distance over which a signal can be detected by a receiver, and background noise can constrain this distance, background noise has the potential to produce strong selection on the evolution of animal communication. Thus background noise is expected to impose selection on acoustic signals that could lead to evolutionary changes in the structure of signal features (Bradbury & Vehrencamp 1998; Brenowitz 1982; Klump 1996; Ryan & Brenowitz 1985; Wollerman 1999; Wollerman & Wiley 2002b).
4 SOURCES OF BACKGROUND NOISE Physical environment
The physical environment provides many sources of background noise. Wind, rivers, and rain produce relatively continuous background energy over a wide band of
frequencies. All of these sources generate relatively low frequency sound that can present a substantial source of interference with acoustic signals. Rivers and waterfalls usually produce constant sound with peak frequencies below 1 kHz (Brumm & Slabbekoorn 2005) but noise above 1 kHz can be substantial (Brumm & Slater 2006). Animals that vocalize near these sources of noise face the constant challenge of transmitting their signals in the presence of potentially high-amplitude noise.
Wind and air turbulence passing over vegetation are also major sources of
background noise. Wind-generated noise is greatest at low frequencies. Generally the most intense frequencies are under 200 Hz, and wind does not usually contribute much noise at frequencies above 2 kHz (Ellinger & Hodl 2003). In general there is less wind in forests than over open grasslands. Consequently there are lower intensities of wind-generated noise within a forest and higher intensities over grasslands (Morton 1975; Ryan & Brenowitz 1985). Ellinger and Hodl (2003) measured background noise at 5 heights in a Venezuelan tropical rainforest and found that wind-generated noise was most
Rain occurs regularly in all habitats, except deserts, and is another source of
background noise that is likely to constrain acoustic communication. Lengagne and Slater (2002) studied the background noise caused by rain in a European broadleaf forest, during the winter, and found that rain produced noise with frequencies primarily between 0 and 5 kHz. These frequencies overlap the acoustic signals used by 94% of European bird species and most amphibian and mammal species as well. Thus rain provides a significant source of background noise that can interfere with the acoustic
communication of most species of terrestrial vertebrates. On the other hand, rain is usually most prevalent during the middle of the day and during afternoons (Waser & Waser 1977; Wiley & Richards 1982), so communication at night and during the morning are less likely to be interfered with by rain.
Insect noise
The primary sources of continuous high-frequency noise in terrestrial habitats are insects. Major contributors include orthopterans and cicadas, which tend to produce signals with frequencies of 4 kHz or higher. Different habitats are likely to have different insect communities, which in turn have distinct assemblages of vocalizations.
6
of the day. In east African gallery forest, Waser and Brown (1986) found similar patterns of background noise, with insects producing sounds primarily between 6 kHz and 8 kHz. In comparison, Slabbekoorn’s (2004) rainforest sites had insect noise in the 4 – 8 kHz range with higher amplitudes than those found in the adjacent gallery forest. In addition, rainforest sites had 2 frequency bands dominated by insects. Large cicadas occupied the lower frequencies, between 3.0 kHz and 4.5 kHz, while noise from other insect species occupied the frequencies between 5 kHz and 7 kHz. In lowland rainforest of Venezuela Ellinger and Hodl (2003) measured background noise for 24 hour periods at 3 different sites during 5 different months. The insect chorus at these sites occupied frequencies between 3.15 kHz and 12.5 kHz, with the highest amplitudes between 5 and 7 kHz.
Researchers have also investigated insect noise at different heights in a forest. Ryan and Brenowitz (1985) recorded background noise in Panama both near the ground and 1.5 m above the ground for several minutes at 0600 h, 0700 h, and 0800 h. They determined that noise levels on the ground and at 1.5 m above the ground were indistinguishable. Ellinger and Hodl (2003) recorded background noise at 5 different heights between ground level and the canopy (0.45 m, 2.5 m, 5 m, 12.5 m, and 21 m) and found that insect noise tended to decrease with height but did not differ significantly with height. From these few studies it appears that insect noise is often equally loud at
different heights in a forest.
There can be large amounts of variation in the amplitudes and frequencies of the background noise during different times of day (Ellinger and Hodl 2003). Ellinger and Hodl (2003) found that insects reached their highest intensities during dusk between 1830 and 2000 h at frequencies between 3.15 kHz and 12.5 kHz. Cicadas also had a
morning, also described by Young (1981). Canopy insects in a Bornean lowland rainforest also produced an intense insect dusk chorus (Reide 1998). In addition Reide observed that the dusk chorus between 1800 h and 1900 h was temporally organized with cicadas (Cicadae) calling during the first 30 min and crickets (Grylloidea) and frogs (Anura) vocalizing during the second 30 min. While the dusk chorus of insects and frogs seemed to be temporally synchronized, diurnal and nocturnal species exhibited less precise temporal synchronization. Slaberkoorn (2004) observed that large cicadas called primarily between 0900 and 1200 in the morning and again just before dusk. He also noted that other diurnal insects at rainforest sites started calling early in the morning and that the frequency of the noise increased throughout the morning until it leveled off at midday. Ellinger and Hodl (2003) observed that during the night there was a continuous level of noise from insects in the frequencies between 5 – 6.3 kHz. In addition crickets produced short peaks of low intensity at 3.15 kHz during dawn and dusk.
Although so far we have limited information about the hourly and daily patterns of insect noise, we have even less information about seasonal variation. Studies in Ecuador and Cameroon have anecdotally described greater background noise from insects in the wet season as opposed to the dry season (De la Torre & Snowdon 2002; Slabbekoorn 2004), but details of the differences were not provided.
8
hourly, daily, and seasonal variation in background noise from insects, and future studies are sure to find interesting results.
Heterospecific and conspecific acoustic signals
One result of communicating in the presence of background noise from another species can be acoustic interference, in which similar heterospecific signals reduce the detectability and discriminability of both species’ signals. Furthermore many animals communicate in situations, such as frog choruses and avian dawn choruses, that make it especially difficult to discriminate conspecific from similar heterospecific signals (Bremond 1978; Brumm & Slabbekoorn 2005; Gerhardt & Huber 2002; Pfennig 2000; Wiley 1994; Wollerman & Wiley 2002b). In addition to the problem of detecting a conspecific signal among sounds of different species, some species, such as birds that breed in colonies, also face the challenge of detecting individual signals in the presence of a multitude of conspecific signals (Jouventin & Aubin 2002; Jouventin et al. 1999). Thus background noise from heterospecific species and conspecific individuals can present problems for the correct detection and discrimination of signals.
In temperate habitats many species have denser populations than those in species-rich tropical habitats. As a consequence acoustic interference from conspecific signals might be greater in temperate communities than in tropical communities. Since songs of the same species share the same spectral features, they can be especially effective at causing acoustic interference. As a result many species exhibit a variety of tactics such as
between species other than those of interest to a particular receiver. A consequence might be more stereotyped signals of birds in tropical forests.
Receivers face different problems of signal detection and discrimination in the presence of continuous background noise as compared to episodic noise. For example, the avian dawn chorus consists of brief discontinuous events of high intensity. The majority of diurnal avian species vocalize during the avian dawn chorus, which makes it an excellent example acoustic communication in the presence of high levels of
heterospecific background noise. It usually begins 15 to 30 minutes before sunrise and continues for 2 to 3 hours after sunrise. During the dawn chorus, species differ in the timing of their singing (Allard 1930; Allen 1913), and in the tropics many species only vocalize at specific times in the morning. For example, many species of tinamou
(Tinamidae), puffbird (Bucconidae), and woodcreeper (Dendrocolaptidae) only sing at or before sunrise, while other species begin their vocal activity later in the morning (Blake 1992; Parker 1991). One potential explanation for these differences in singing times is the avoidance of acoustic interference from spectrally similar signals.
Summary
In summary abiotic sources of noise produce background noise predominantly at low frequencies. Rivers provide a relatively constant source of noise whereas noise from wind and rain are generally greatest at certain times of day. In general, noise from wind and vegetation increases around midday and can remain high during the afternoon and dusk (Ellinger & Hodl 2003; Henwood & Fabrick 1979).
10
relatively quiet window between 1 and 4 kHz in many terrestrial environments. This window could explain why many birds and mammals in forests have vocalizations with frequencies between 1 and 4 kHz (Morton 1975; Ryan and Brenowitz 1985; Waser and Waser 1977). Ellinger and Hodl (2003) found 3 periods of relatively intense background noise in the course of a day: the dawn chorus of birds, air turbulence at midday, and the dusk and night chorus of Orthoptera and Cicadidae.
Insects that call persistently during dusk and the first half of the night produce nearly constant sound. In contrast, the dawn chorus of birds consists of sporadic sounds.
Previous studies suggest that dawn choruses in primates (Waser and Brown 1986), cicadas (Young 1981), and birds (Brenowitz 1982; Henwood and Frabrick 1979) might take advantage of lower background noise from other sources at dawn. Other hypotheses for the timing of the avian dawn chorus include optimal conditions for sound
transmission, poor feeding conditions (Catchpole & Slater 1995; Kacelnik & Krebs 1983).
SIGNALER ADAPTATIONS TO BACKGROUND NOISE
improve detection and discrimination by receivers. An increase in signal amplitude could usually increase contrast with background noise (Wiley 2006).
Contrast
To increase the contrast between a signal and background noise, signalers can adjust the frequency of a signal, their spatial location, or the time of signal transmission (Klump 1996; Brumm and Slabbekoorn 2005). An increase in the contrast with background noise is especially important when signals share the same frequency range (Bremond 1978; Lohr et al. 2003). For example animals that live in particularly noisy environments, such as those near rushing rivers and waterfalls, have acoustic signals in frequency ranges that reduce masking interference from the background noise. Dubois and Martens (1984) found that frogs and birds living near waterfalls and torrents produced high-pitched vocalizations in narrow frequency bands that contrast with the background noise of the rushing water. These adjustments increase the active space of a species’ signal thus opportunities for correct detection and discrimination of their signals.
12
They concluded that background noise in different spectra in the two habitats most likely led to song divergence in the little greenbul in each habitat.
Heterospecific signals, another common source of background noise, also have the potential to disrupt intraspecific communication (Schwartz & Wells 1983; Wollerman & Wiley 2002a). Since signals can interfere with each other, features of signal structure that differ distinctly from those of other species should have advantages for conspecific recognition (Emlen 1972; Falls 1963; Marler 1960; Nelson 1988; Nelson & Marler 1990). Since species-specific signals are important for species recognition and mate choice, species should partition acoustic space to avoid acoustic interference from syntopic signals. Theory predicts that the competition for acoustic space should result in signal divergence, which would increase signal distinctiveness and opportunities for correct signal discrimination (Marler 1960; Miller 1982). To date there has been no direct
evidence of signal partitioning of the spectral features of signals.
Because sound intensity attenuates with increased distance from the source signalers can reduce interference from background noise by moving away from its source. Spatial separation can result in a spatial release from acoustic interference and in an improved signal-to-noise ratio for the receiver (Klump 1996). If two syntopic species have similar vocalizations, spatial separation could reduce confusion. If separation is large enough, one species could be competitively excluded from the community. If species separate spatially, receivers in effect have an extra recognition cue to correctly identify
conspecific signals. Therefore vertical separation could facilitate coexistence through the avoidance of direct competition.
the contrast of their signals with background noise and reduce or avoid acoustic interference from heterospecific signals (Ficken et al. 1974; Greenfield 1988; Narins 1992; Popp et al. 1985). A few studies have provided evidence that birds actively avoid acoustic interference by short-term temporal changes in delivery of songs, over seconds and minutes (Cody & Brown 1969; Ficken et al. 1974; Popp et al. 1985).
There is some evidence to suggest that singing by birds is affected by other species in their habitat. Cody and Brown (1969) studied the Wrentit, Chamaea fasciata, and
Bewick’s Wren, Thryomanes bewickii, two abundant species in chaparrel habitat in California, and found that birds adjusted their diurnal rhythm of song production to avoid singing at the same time. Ficken et al. (1974) confirmed this observation in 2 forest species, the Red-Eyed Vireo, Vireo olivaceus, and Least Flycatcher, Empidonax minimus. The flycatchers avoided starting songs while red-eyed vireos were singing, then sang between red-eyed vireo songs. Popp et al. (1985) studied 4 forest species and found that they also avoided starting songs while other species were singing and confirmed this observation with playback experiments with Ovenbirds, Seiurus aurocapillas. The ovenbirds adjusted their singing pattern by singing immediately after the playback song ended and thus avoided overlap with other species’ songs. This phenomenon has also been studied among conspecific individuals. Wasserman (1977) demonstrated that male White-Throated Sparrows, Zonotrichia albicollis, did not start songs when other male White-Throated Sparrows were singing. Instead they waited to sing until the other males were quiet. In further playbacks ovenbirds also waited until neighboring individuals of the same species were quiet before they started singing (Ficken 1985).
14
interference from other species (Greenfield 1988). In a study of calling by Tawny Owls,
Strix aluco, during rain, Lengagne and Slater (2002) found the active space was reduced
from 118 ha during dry weather to 1.7 ha during rain, a 69-fold decrease. Presumably as a result, tawny owls did not call during nights with heavy rain.
Signal redundancy
Redundancy is a common feature of animal signals. Signal detection theory predicts that increased redundancy can increase information transfer in the presence of noise (Wiley 1994). Potash (1972) tested this prediction by exposing Japanese Quails, Coturnix
japonica, to increased levels of noise in the laboratory. He found that these quail
increased the number of syllables with increased noise levels. Increased signal redundancy in the presence of background noise has also been demonstrated in King Penguins, Aptenodytes patagonica, (Jouventin et al. 1999) and Chaffinches, Fringilla
coelebs, (Brumm and Slater 2006) in the field. In each case signalers extended the length
of signals in the presence of environmental noise.
Amplitude
studies have documented this phenomenon in relation to background noise in the
laboratory, but recently it has also been documented in natural conditions. Brumm (2004) found that male Nightingales (Luscinia megarhynchos) in noisier territories with more traffic noise sang louder songs than birds at less noisy locations. Males adjusted the amplitude of their songs depending on the amplitude of the background noise.
ACOUSTIC ADAPTATIONS TO ENVIRONMENTAL STRUCTURE
Acoustic signals used for long-range communication are adapted to optimize their transmission distance under the environmental pressures that act on sound transmission in their native habitat (Morton 1975). As a consequence species and populations that live in habitats with different acoustic properties should exhibit predictable differences in their song structures. Important factors that drive song structure adaptations are signal attenuation and degradation during sound transmission. Attenuation refers to a decrease in a signal’s amplitude, which is caused in part by sound absorption and scattering by air and vegetation. Signal degradation refers to changes in spectral and temporal
characteristics that affect the signal between the time that the sender transmits the signal and the receiver receives the signal.
16
they travel from signaler to receiver: overall attenuation, frequency-dependent
attenuation, reverberation, and fluctuation in amplitude. Frequency-dependent attenuation occurs when higher frequencies attenuate faster than lower frequencies. The physics of frequency-dependent attenuation suggest that for communication more than a meter above the ground, low frequencies, minimize attenuation regardless of habitat structure.
Reverberations result from sound scattered by reflective surfaces such as foliage, tree limbs and trunks and they are strongly associated with closed habitats (Wiley and
Richards 1982). Reverberations blur the distinction between notes separated by short intervals, since the interval becomes filled with echoes that obscure rapid amplitude modulation. Amplitude modulations result from refraction as sound passes through pockets of air of differing temperature and velocity. They are associated with open habitats, which are less sheltered from wind and temperature changes than closed habitats. Since reverberations have stronger effects in forests and amplitude fluctuations have stronger effects in open areas, such as grasslands, we expect song structure to diverge in these different habitats.
relatively high frequencies, wider frequency ranges, complex notes, and short inter-note intervals compared with songs in forests.
Acoustic adaptation to different habitats can lead to song divergence and reproductive isolation between populations in different habitats. Patten et al. (2004) studied two
subspecies of Song Sparrow, Melospiza melodia, in adjacent but structurally different riparian habitats. They found that habitat structure was a good predictor of song structure. Songs in more open habitat had higher frequencies and more rapidly repeated notes than songs produced in denser riparian vegetation. Playback experiments with females from each habitat revealed that females preferred songs from their same habitat. Analysis of genetic variation in microsatellite loci confirmed that there was little gene flow between the two subspecies.
Acoustic adaptation to habitats can also apply to variation within major habitats. Sound attenuation and reverberations are greatest in the densely vegetated understory and canopy as opposed to the relatively open midstory (Marten & Marler 1977).
18
correcting for body size, bill morphology, and phylogenetic relatedness, Seddon (2005) found that antbirds in densely vegetated strata produced lower-pitched songs than species in the more open midstory.
In summary song features correlate with differences in habitat acoustics. Songs are selected for traits that increase the active space of a signal in a species’ habitat. The selection on species’ signals to match the transmission characteristics of their physical environment leads to convergence among sympatric species. The different effects of reverberations and amplitude modulations from the physical environment primarily affect the timing and complexity of notes. These differences can lead to divergent song
structures in different habitats. If selection on song is strong enough it can lead to
REFERENCES
Allard, H. A. 1930 The first morning song of some birds of Washington, D.C.: its relation to light. American Naturalist 64, 436-469.
Allen, F. H. 1913 More notes on the morning awakening. Auk 30, 229-235.
Blake, J. 1992 Temporal variation in point counts of birds in a lowland wet forest in Costa Rica. Condor 94, 265-275.
Bradbury, J. W. & Vehrencamp, S. L. 1998 Principles of animal communication: Sunderland, Mass. : Sinauer Associates.
Bremond, J. C. 1978 Acoustic competition between the song of the wren (Troglodytes
troglodytes) and the songs of other species. Behaviour 65, 89-98.
Brenowitz, E. A. 1982 The active space of red-winged blackbird song. Journal of
Comparative Physiology 147, 511 - 522.
Brumm, H. 2004 The impact of environmental noise on song amplitude in a territorial bird. Journal of Animal Ecology 73, 434-440.
Brumm, H. & Slabbekoorn, H. 2005 Acoustic communication in noise. In Advances in
the Study of Behavior, pp. 151-209.
Brumm, H. & Slater, P. J. B. 2006 Ambient noise, motor fatigue, and serial redundancy in chaffinch song. Behavioral Ecology and Sociobiology 60, 475-481.
Catchpole, C. K. & Slater, P. J. B. 1995 Bird Song: Biological Themes and Variations. Cambridge: Cambridge University Press.
Cody, M. L. & Brown, J. H. 1969 Song asynchrony in neighboring bird species. Nature 222, 778-780.
De la Torre, S. & Snowdon, C. T. 2002 Environmental correlates of vocal
communication of wild pygmy marmosets, Cebeulla pygmaea. Animal Behaviour 63, 847-856.
Dubois, A. & Martens, J. 1984 A case of possible vocal convergence between frogs and a bird in Himalayan torrents. Journal fur Ornithologie 125, 455-463.
Ellinger, N. & Hodl, W. 2003 Habitat acoustics of a neotropical lowland rainforest.
20
Emlen, S. T. 1972 An experimental analysis of the parameters of bird song eliciting species recognition. Behaviour 41, 130-171.
Endler, J. A. 1993 The color of light in forests and its implications. Ecological
Monographs 63, 1-27.
Falls, J. B. 1963 Properties of bird song eliciting response from territorial males. In
Proceedings of the International Ornithological Congress, vol. 13, pp. 259-271.
Ficken, R. W., Ficken, M. S. & Hailman, J. P. 1974 Temporal pattern shifts to avoid acoustic interference in singing birds. Science 183, 762 - 763.
Gerhardt, H. C. & Huber, F. 2002 Acoustic communication in insects and anurans :
common problems and diverse solutions: Chicago : University of Chicago Press.
Greenfield, M. D. 1988 Interspecific acoustic interactions among katydids
Neoconocephalus: inhibition-induced shifts in diel periodicity. Animal Behaviour
36, 684-695.
Henwood, K. & Fabrick, A. 1979 A quantitative analysis of the dawn chorus: temporal selection for communicatory optimization. American Naturalist 114, 260-274. Jouventin, P. & Aubin, T. 2002 Acoustic systems are adapted to breeding ecologies:
Individual recognition in nesting penguins. Animal Behaviour 64, 747-757. Jouventin, P., Aubin, T. & Lengagne, T. 1999 Finding a parent in a king penguin colony:
The acoustic system of individual recognition. Animal Behaviour 57, 1175-1183. Kacelnik, A. & Krebs, J. R. 1983 The dawn chorus in the great tit (Parus major):
proximate and ultimate causes. Behaviour 83, 287-309.
Klump, G. M. 1996 Bird communication in the noisy world. In Ecology and evolution of
acoustic communication in birds (ed. D. E. Kroodsma & E. H. Miller), pp. 321 -
338. Ithaca, NY: Cornell University Press.
Lengagne, T. & Slater, P. J. B. 2002 The effects of rain on acoustic communication: Tawny owls have good reason for calling less in wet weather. Proceedings of the
Royal Society Biological Sciences Series B 269, 2121-2125.
Lohr, B., Wright, T. F. & Dooling, R. J. 2003 Detection and discrimination of natural calls in masking noise by birds: estimating the active space of a signal. Animal
Behaviour 65, 763 - 777.
Lombard, E. 1911 Le signe de l'elevation de la voix. Annales de Maladies de L'oreille et
Lopez, P. T., Narins, P. M., Lewis, E. R. & Moore, S. W. 1988 Acoustically induced modification in the white-lipped frog, Leptodactylus albilabris. Animal Behaviour 36, 1295-1308.
Marler, P. 1960 Bird songs and mate selection. In Animal sounds and communication, vol. 7 (ed. W. E. Lanyon & W. N. Tavolga), pp. 348-367. Washington D.C.: American Institute of Biological Sciences.
Marten, K. & Marler, P. 1977 Sound transmission and its significance for animal vocalization. Behavioral Ecology and Sociobiology 2, 271-290.
Miller, E. H. 1982 Character and variance shift in acoustic signals of birds. In Acoustic
communication in birds, vol. 1 (ed. D. E. Kroodsma & E. H. Miller), pp. 253-295.
New York: Academic Press.
Morton, E. S. 1975 Ecological sources of selection on avian sounds. American Naturalist 109, 17-34.
Naguib, M. & Wiley, R. H. 2001 Estimating the distance to a source of sound:
mechanisms and adaptations for long-range communication. Animal Behaviour 62, 825-837.
Narins, P. M. 1992 Evolution of anuran chorus behavior neural and behavioral constraints. American Naturalist 139, S90-S104.
Nelson, D. A. 1988 Feature weighting in species song recognition by the field sparrow (Spizella pusilla). Behaviour 106, 158-182.
Nelson, D. A. & Marler, P. 1990 The perception of bird song and an ecological concept of signal space. In Comparative perception, Vol. 2, Complex signals, vol. 2 (ed. W. C. a. B. Stebbins, M.A.), pp. 443-78. New York: Wiley.
Nemeth, E., Winkler, H. & Dabelsteen, T. 2001 Differential degradation of antbird songs in a Neotropical rainforest: Adaptation to perch height? Journal of the Acoustical
Society of America 110, 3263-3274.
Parker, T. A. 1991 On the use of tape recorders in avifaunal surveys. Auk 108, 443-444. Patten, M. A., Rotenberry, J. T. & Zuk, M. 2004 Habitat selection, acoustic adaptation,
and the evolution of reproductive isolation. Evolution 58, 2144-2155. Pfennig, K. S. 2000 Female spadefoot toads compromise on mate quality to ensure
conspecific matings. Behavioral Ecology 11, 220-227.
22
Potash, L. M. 1972 A signal detection problem and possible solution in Japanese quail
Coturnix japonica. Animal Behaviour 20, 192-195.
Pytte, C. L., Rusch, K. M. & Ficken, M. S. 2003 Regulation of vocal amplitude by the blue-throated hummingbird, Lampornis clemenciae. Animal Behaviour 66, 703-710.
Richards, D. G. & Wiley, R. H. 1980 Reverberations and amplitude fluctuations in the propagation of sound in a forest - implications for animal communication.
American Naturalist 115, 381-399.
Ryan, M. J. & Brenowitz, E. A. 1985 The role of body size, phylogeny, and ambient noise in the evolution of bird song. American Naturalist 126, 87-100.
Schwartz, J. J. & Wells, K. D. 1983 An experimental study of acoustic interference between 2 species of neotropical tree frogs. Animal Behaviour 31, 181-190. Seddon, N. 2005 Ecological adaptation and species recognition drives vocal evolution in
neotropical suboscine birds. Evolution 59, 200-215.
Sinnott, J. M., Stebbins, W. C. a. B., M.A. & Moody, D. B. 1975 Regulation of voice amplitude by the monkey. Journal of the Acoustical Society of America 58, 412-414.
Slabbekoorn, H. 2004 Habitat-dependent ambient noise: Consistent spectral profiles in two African forest types. Journal of the Acoustical Society of America 116, 3727-3733.
Slabbekoorn, H. & Smith, T. B. 2002 Habitat-dependent song divergence in the little greenbul: An analysis of environmental selection pressures on acoustic signals.
Evolution 56, 1849-1858.
Waser, P. M. & Brown, C. H. 1986 Habitat acoustics and primate communication.
American Journal of Primatology 10, 135-154.
Waser, P. M. & Waser, M. S. 1977 Experimental studies of primate vocalization specializations for long-distance propagation. Z. Tierpsychol 43, 239-263.
Wasserman, F. E. 1977 Intraspecific acoustical interference in the white-throated sparrow
Zonotrichia albicollis. Animal Behaviour 25, 949-952.
Wiley, R. H. 1991 Associations of song properties with habitats for territorial oscine birds of eastern North-America. American Naturalist 138, 973-993.
Wiley, R. H. 1994 Errors, exaggeration, and deception in animal communication. In
Behavioral mechanisms in evolutionary ecology (ed. L. A. Real), pp. 157-189.
Wiley, R. H. 2006 Signal detection and animal communication. Advances in the Study of
Behavior 36, 217-247.
Wiley, R. H. & Richards, D. G. 1982 Adaptations for acoustic communication in birds: sound transmission and signal detection. In Acoustic communication in birds (ed. D. E. Kroodsma & E. H. Miller), pp. 131-181. New York & London: Academic Press.
Wollerman, L. 1999 Acoustic interference limits call detection in a Neotropical frog Hyla
ebraccata. Animal Behaviour 57, 529-536.
Wollerman, L. & Wiley, R. H. 2002a Background noise from a natural chorus alters female discrimination of male calls in a Neotropical frog. Animal Behaviour 63, 15-22.
Wollerman, L. & Wiley, R. H. 2002b Possibilities for error during communication by neotropical frogs in a complex acoustic environment. Behavioral Ecology and
Sociobiology 52, 465-473.
THE ACOUSTIC COMMUNITY AND ITS INFLUENCE ON SIGNAL
EVOLUTION: BIRD SONG IN THE NEOTROPICS
ABSTRACT
Animals use species-specific communicatory signals for species recognition, mate choice, and territory defense. In many cases, communication occurs in the presence of other species with similar signals, which can make it difficult to discriminate conspecific from heterospecific signals. Because heterospecific signals have the potential to disrupt intraspecific communication, species should partition acoustic space to avoid acoustic interference. To investigate acoustic partitioning in an environment with high levels of heterospecific background noise I studied the dawn chorus of birds in the tropics.
To characterize the acoustic community I replicated acoustic censuses during 2 hrs of the dawn chorus at both small (100 m) and medium (1 km) spatial scales and at short-term (1 hr), medium-short-term (2 day), and long-short-term (seasonal) temporal scales. I detected 82 sedentary species of birds that sang consistently throughout the censuses. 11 features from each species’ song were measured and analyzed to quantify the acoustic space occupied by each species in the community. The Euclidean distances between species’ songs in acoustic space were used to examine the dispersion of species’ songs, the
Songs near the center of the acoustic space were more crowded than songs near the periphery. Species near the center also sang more frequently than species farther from the center. Songs of congeners and family members were not more dispersed than songs of random species. This study is a first attempt to characterize dispersion of birds’ songs in a complex acoustic community and to investigate some spatial, temporal, and phylogenetic factors that influence the evolution of divergent songs.
INTRODUCTION
Species-specific signals convey important information to conspecifics that enable them to recognize each other, to make appropriate mate choice decisions, and to settle territorial disputes (Bradbury & Vehrencamp 1998). Acoustic interference from background noise should decrease the efficacy of intraspecific communication by affecting the detectability and discriminability of conspecific signals (Endler 1992). Detectability is a receiver’s ability to separate a signal from background noise, whereas discriminability is the ability to separate two signals. Background noise, from both biotic and abiotic sources, is ubiquitous in natural environments. In addition, many animals communicate in aggregations, such as frog choruses and avian dawn choruses, that make it especially difficult to discriminate conspecific from similar heterospecific signals (Bremond 1978; Brumm & Slabbekoorn 2005; Gerhardt & Huber 2002; Pfennig 2000; Wiley 1994; Wollerman & Wiley 2002b). To avoid the negative effects of acoustic interference, signalers should evolve signals that contrast with the background noise of their environment (Endler 1993; Miller 1982; Wiley 1994; Wiley 2006).
26
greatest chance of interfering with each other and creating receiver errors. Such errors include responses to signals from different species, which could lead individuals to respond to inappropriate rivals or mates, or lack of responses to appropriate signals, which could result in additional time and risks in finding a mate or confronting a rival (Wiley 1994). Features of signal structure that differ distinctly from those of other species should have advantages for conspecific recognition (Emlen 1972; Falls 1963; Marler 1960; Nelson 1988; Nelson & Marler 1990). Thus signals might diverge in
multidimensional acoustic space as defined by acoustic features, such as dominant frequency duration, number of notes, and other features that characterize the structure of a signal (Marler 1960, Miller 1982).
Nelson and Marler (1990) studied the acoustic space of a community of birds in New York and found that songs with similar song features were in close proximity in acoustic space. They also noted that the center of the community’s acoustic space seemed to have
more species in close proximity than the periphery. The species with songs in the center required more cues to identify conspecific songs than species with songs on the periphery of the acoustic space (Nelson and Marler 1990).
Because heterospecific signals have the potential to disrupt intraspecific
communication, species should partition acoustic space to avoid acoustic interference from syntopic signals. Therefore the competition for acoustic space should result in divergence of signals (Marler 1960; Miller 1982). In addition, closely related species
Dawn choruses of birds in the tropics provide an example of communication in the presence of high levels of heterospecific background noise. The combination of high species diversity and a narrow window of time in which the majority of species sing increases opportunities for acoustic competition and limits possibilities for song
divergence. In addition, many Amazonian forest species live in conditions with dim light and dense foliage, which obscure lines of sight. Consequently, they usually rely on acoustic signals for long-range communication. Beyond the basic species-specificity of their songs, we know little about how these songs are distributed in acoustic space and perceived in noisy acoustic environments.
In this study, I examine (1) the dispersion of species’ songs in acoustic space, (2) the dispersion of phylogenetically related species in comparison to other pairs of species, (3) the dispersion of songs from the same location compared to different locations, and (4) the degree of crowding in the center of occupied acoustic space in comparison to the periphery. Overdispersed signals would indicate that selection for unambiguous species recognition has promoted coevolution of song features to improve intraspecific
communication.
METHODS
Study location and acosutic censuses
28
1997). The censuses were conducted at three sites, separated by 500 m to 1 km, in terra firma habitat. Each site included two points 100 m apart, and each census consisted of continuous simultaneous tape-recordings at both points. Censuses at all 3 sites were conducted three times during the wet season and four times during the dry season of 2004. Each census began 30 min before sunrise and continued for one hr. After a pause, recording resumed at 0700 and again at 0800 for 30 min (total time recorded during each census = 2 hr). The recordings were made with Sony TC D5 Pro II and Marantz PMD 222 tape recorders and Shure 33-1070D omnidirectional microphones placed 2 ± 0.1 m above ground. In this sampling design, recordings were replicated at both small (100 m) and medium (1 km) spatial scales and at short-term (1 hr), medium-term (2 day), and long-term (seasonal) temporal scales.
Acoustic community
if they were two species for a total of 83 different song patterns. For the mean mass of each species, I followed Terborgh et al. (1990) and Dunning (1993).
Acoustic analysis
In order to obtain examples of each species’ songs that were as clean as possible for analyses of their acoustic features, examples were recorded with a Sennheiser ME66-K3U directional microphone and a Sony TC-D5 Pro II tape recorder in 2004 and a Marantz PMD660 digital recorder in 2006. For species detected on the acoustic censuses, but not recorded with the directional microphone, I analyzed the examples from the censuses. The tape recordings were digitized (16-bit accuracy, 22.05 kHz sampling rate, WAV format) with WildSpectra2 (version 050415,
http://www.unc.edu/~rhwiley/wildspectra.html). One song from each of three different individuals (or when necessary from an individual at the same location but different seasons or years) was analyzed with Wildspectra1 (version 051027) (sampling rate of 22.05 kHz, frequency resolution 172 Hz, temporal resolution 5.8ms). Using the
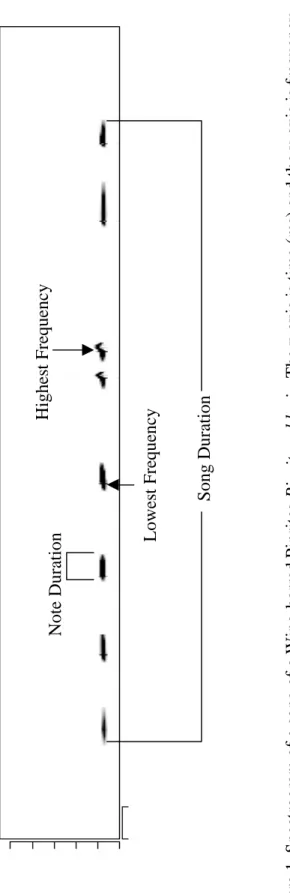
SongSignature feature of Wildspectra1, the following measures were obtained from each song (time, in milliseconds, and frequency, in Hz) (Fig. 1): (1) lowest dominant
30
the last note, (11) complexity of the average note averaged (measurements from three successive notes in the first, middle, and last third of each song). The number of inflections in a note was determined from spectrograms by eye. To verify the
measurements obtained with the SongSignature function of WildSpectra1, a subset of songs was also measured with traditional point-and-click methods.
Principal components analysis
Some of the acoustic features of songs were correlated with each other. To generate independent variables for the axes of acoustic space, I subjected the original acoustic features of songs to principal component analysis (PCA). Since this analysis requires variables with values for all individuals, when songs included only one note the
Quantifying acoustic space and nearest-neighbor distance
To measure the separation of different species' songs in acoustic space, I calculated the Euclidean distance between species’ songs in this four-dimensional acoustic space. The nearest-neighbor distance (NND) for each species was the distance to the closest neighbor in this acoustic space (Fig. 2). Because PCA normalizes the resultant PCs, it
eliminates differences in scale that result from different units of measurement. The normalized PCs might not reflect the emphases that the different species of birds place on acoustic features during perception of sounds, but, in the absence of any information about how the various species might weight these features, there was no biological justification for a different measure of distance.
To determine whether the acoustic community was clustered, random, or
overdispersed in acoustic space, I used the Clark and Evans’ (1954) R as a measure of dispersion in K dimensions. The test compares observed NNDs in a population, Ra, to that in a randomly distributed population, Re, of the same density, thus R = Ra/Re. If R = 1.0, the distribution is random. Scores approaching 0 indicate increasingly clumped distributions, and those above 1.0 indicate increasingly uniform distributions. I followed Clark and Evans (1979) to calculate the expected NND in 4 dimensions, re =
0.60813/rho^1/4, and the standard error of the mean distance to the nearest-neighbor, rσ
32
centroid. Outliers were not removed so the hypersphere in effect incorporated a buffer strip around the occupied volume, as recommended by Donnelly (1978).
Preliminary examination of the distribution of the song patterns in acoustic space revealed that species near the center were more clustered than those near the periphery. This pattern resulted in NND scores that were extremely clustered overall. Consequently I calculated the centroid of the acoustic community and then selected the inner quartile of species in the acoustic community for the final NND analyses. Species in the inner quartile of the acoustic community are presumably most likely to create acoustic interference for each other (Nelson & Marler 1990).
Acoustic community at multiple temporal scales
To investigate how acoustic partitioning might be expressed, NNDs were calculated for multiple spatio-temporal scales: 1) all species from all census points across all days and seasons, 2) species at one point during one morning, and 3) species within a one half hour period at one point. To see if there were differences in dispersion between species that sang early and late in the morning I investigated species that sang during 30-min periods at 2 different times, starting at approximately sunrise (0600) and at 0800. An index of community similarity (Jaccard’s Index) between the four 30-min periods of the acoustic censuses revealed that these two time periods had a similarity value of 0.24, lower than those between the other 30-min periods. A one-way Analysis of Variance (ANOVA) compared the song activity of each species during each of the four 30-min periods of the acoustic censuses.
focused on the midlevel stratum, which had more species than the other strata. Likewise I focused on the suborder Tyranni (suboscines), which had more species than the other orders or suborders. I used suborder to group related species because the quantitative phylogenetic relationships between many of the species in Amazonia are still unknown. For all temporal scales, except all species across all days and seasons, all
nearest-neighbor values were calculated and then averaged for an overall R dispersion value at each spatio-temporal scale.
To investigate whether or not smaller temporal scales had greater song dispersion than larger temporal scales, I compared R for species detected during the same 30-min period at one point to species detected at a point throughout the morning. To ensure independent samples, I randomly divided the different days of the acoustic censuses into 2 groups, each consisting of 20 point-days. The first group was used for the species during 30-min at a point and the second for all of the species at a point throughout a morning. A one-way ANOVA compared the R dispersion values of these 2 temporal scales.
Phylogenetic distance, singing strata, and acoustic space
34
distances between nearest-neighbors, family members, and random species. In this analysis pairs of species in the same family always excluded congeners. In the analysis by genera, an assessment of the residuals showed one genus (Xiphorynchus) as an outlier (greater than 2 standard deviations from the mean). This genus was removed before the final analysis, although this adjustment did not affect the statistical significance of the results.
Comparison of the center and periphery of the acoustic community
To measure changes in NND with distance from the center of the acoustic space, species were separated into the inner quartile and the outer quartile based on their Euclidean distance from the centroid of the acoustic community. A one-way ANOVA compared NNDs of species on the periphery and near the center of the acoustic space. In an assessment of the residuals, one point in the outer quartile was an outlier and was removed before the final analysis, although the removal of this outlier did not affect the statistical significance of the results.
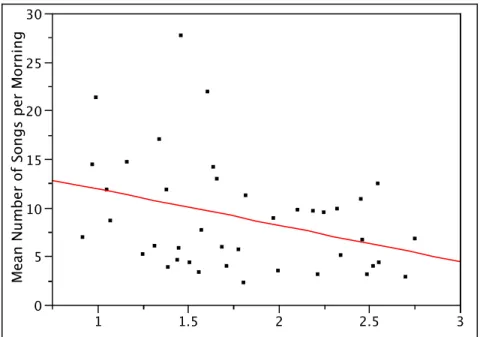
To investigate if species near the center of acoustic space sing more frequently than species in the periphery of acoustic space, I compared each species’ Euclidean distance from the centroid of the acoustic community with its mean amount of singing during the dawn chorus. The amount of singing in a morning was calculated for each species on each acoustic census and divided by the number of days and points at which it sang, for an average amount of singing per morning for each species. In general only one
individual per species was recorded at each census point, but occasionally the census point was on the boundary of 2 individuals of a species so in some cases there might be 2 individuals per point. This analysis included the 50% of the species closest to the
36
RESULTS
Acoustic community at multiple spatio-temporal scales
Of the 137 species that sang during at least one acoustic census, 82 sang during more than 1% of the total time (Appendix A). These species included 51 suboscines (Order Passeriformes; Suborder Tyranni), 7 oscines (Order Passeriformes; Suborder Passeres), and 24 non-passerines (Orders Tinamiformes; Galliformes; Columbiformes;
Strigiformes; Caprimulgiformes; Trogoniformes; Coraciiformes; Piciformes). Similar numbers of species were detected during the wet and dry seasons, 81 and 73 respectively. The average number of species detected at each spatio-temporal scale revealed a nested structure with larger scales having more species and smaller scales having fewer species. For example the average number of species detected at any one site across all sampling days was 73, during one season 59, during one week 52, and during one day 41.
Meanwhile the average number of species detected at a point per season, per week, and per day were, 52, 43, and 38, respectively. The average number of species detected at any one point in the 30 min starting at sunrise was 19 and the 30 min starting at 0800 was 16 species. ANOVAs revealed that 47 out of 82 species preferentially sang in certain 30-min periods of the dawn chorus. After a Bonferroni correction for multiple tests, only 18 species sang preferentially in certain 30 min periods.
= 1.19, z = 0.21, p = 0.84). There was only a slight difference between the 30 min period starting at sunrise and the 30-min period starting at 0800 (R = 1.20, z = 0.21, p = 0.84). Species that sang in the same 30-min period as well as in the same stratum showed even more dispersion (R = 1.28, z = 0.3, p = 0.76). Phylogenetically related species singing in the same 30-min period showed the greatest dispersion (R = 1.32, z = 0.35, p = 0.73). In an ANOVA of dispersion among species singing in the same 30-min period, at sunrise, and species singing at any one point during one morning, the 30-min period was more dispersed than all of the species at the point (Fig. 3) (F (1,38) = 4.61, p = 0.038).
Phylogenetic distance, singing strata, and acoustic space
The acoustic censuses detected 11 genera with more than one species. In 9 of these genera congeners were not nearest-neighbors in acoustic space. The two exceptions were nearest-neighbors in acoustic space were Columba and Trogon. The mean within-genera Euclidean distance between species was 2.31 while the mean NND for all species was 0.81 (F (1,20) = 16.57, p = 0.0006). There was no significant difference between the within-genera Euclidean distance and the Euclidean distance to a randomly chosen species (Fig. 4).
38
82 species were grouped into the 5 strata (14 ground, 11 understory, 37 midlevel, 10 subcanopy, and 10 canopy species). Species had mean NND within strata of 1.41 and mean NND between strata of 1.03 (Fig. 6) (F (1,164) = 13.18, p < 0.0004).
Comparison of center and periphery of the acoustic community
The quartile closest to the centroid consisted of 20 species (12 suboscines, 5 oscines, and 3 nonpasserines) with an average mass of 71.4 grams. The species in the quartile farthest from the centroid consisted of 21 species (14 suboscines, 1 oscine, and 6
nonpasserines) with an average mass of 60.8 grams. The mean NND of species near the center and near the periphery of acoustic space was 0.67 and 1.44, respectively (Fig. 7). ANOVA revealed that species closer to the centroid of the acoustic community had smaller NND than species near the periphery (F(1,39) = 20.29, p < 0.0001). There were 40 species in the 50% closest to the centroid. There was a strong relationship between distance from the centroid of acoustic space and a species’ mean amount of singing during the dawn chorus (Fig. 8) (R2 = 0.12, m = -3.73, p = 0.027).
DISCUSSION
showed greater dispersion in acoustic space than did species from different strata and those that sing at different times in the morning. Thus problems of communication seem to be associated with relatively small-scale temporal and spatial interactions between immediate acoustic neighbors, rather than with the whole avian community. These results suggest that the need to recognize conspecific signals against background noise
composed of similar heterospecific signals can lead to the divergence of song features in birds.
Species in the center of the community acoustic space have closer nearest-neighbors than species on the periphery of the community acoustic space. Because the center is more crowded than the periphery, central species have a greater chance of acoustic interference from heterospecific signals. In addition centrally located species sang more frequently than species further from the center, perhaps to compensate for their crowding in acoustic space.
Acoustic community at multiple spatio-temporal scales
Few studies have shown community-wide character displacement (Dayan &
40
signal features has been more difficult. Results from studies that have investigated temporal (Sueur 2002), spectral (Chek et al. 2003; Hodl 1977; Littlejohn 1959) or spatial (Chek et al. 2003; Drewry & Rand 1983; Duellman & Pyles 1983) acoustic dispersion have found differences in syntopic species’ signals but have not conclusively supported acoustic competition as the cause of signal divergence. Most of these studies described the differences in acoustic signal features, spatial separation of signalers, and timing of signaling among species living in the same community but did not conduct statistical community-wide comparisons of signal dispersion. In neotropical frog communities Check et al. (2003) used null models to test for overdispersion among species-specific acoustic signals and found evidence for overdispersion of signals in 3 out of 11 communities, but after correcting for multiple tests none of the communities was statistically significant for overdispersion. However their study showed that the communities with the highest diversity also exhibited the most dispersion in acoustic space.
avoid signal confusion (see Chapter 3). Thus it can be difficult to determine which axes should reflect signal divergence.
This study investigated acoustic partitioning along multiple acoustic axes. Despite the analysis of multiple song features and temporal scales, it did not document an
overdispersed pattern of signals in acoustic space overall. The distribution of species in acoustic space was clustered with many species in the center and fewer species dispersed around the periphery (see discussion below). This distribution could be a result of
commonalities in the mechanisms of sound production across the majority of the species in the community. Most species were medium-sized insectivorous birds with more or less similar bill shapes, which are both important factors to the types of song features that a bird can produce (Podos 1996; Ryan & Brenowitz 1985). In addition, bird songs are adapted to optimize their transmission distance under the environmental pressures that act on sound transmission in their native habitats (Morton 1975; Wiley & Richards 1982; Marten & Marler 1977; Naguib & Wiley 2001). Since all of the species in this study live in the same habitat there should be convergence among the features of their songs.
42
among syntopic species. Thus, species with similar signals that interact most frequently should have the greatest need for signal divergence.
When different species with similar signals interact, selection should favor divergence of these signals to minimize interference as well as to reduce the risk of interspecific hybridization (Coyne & Orr 2004), a process called reproductive character displacement (Servedio & Noor 2003). Knowledge of the conditions that facilitate this divergence can aid our understanding of the role of competition in adaptive radiation (Schluter 2000) and the role of selection in creating reproductive isolation and speciation (Gerhardt & Huber 2002).
If reproductive character displacement leads to mating behaviors that diverge between conspecific populations, individuals might fail to recognize signals of conspecifics from different populations. Pfennig and Ryan (2006) used artificial neural networks to
determine whether or not signals and signal reception would diverge in 2 different populations that were exposed to different types of background noise. In their models, signals and signal recognition diverged as a result of increased contrast to the background noise in each population. Their study provides evidence that background noise can be a source of signal divergence in different populations. If mating behaviors diverge between conspecific populations, individuals could fail to accept conspecifics from the alternative populations as mates. As a result these conspecific populations might become
reproductively isolated and ultimately undergo speciation. Thus reproductive character displacement could potentially initiate speciation (Hoskin et al. 2005; Howard 1993).
Phylogenetic distance, singing strata, and acoustic space
In this study I found that the songs of syntopic species in the same genus or family have songs that are less similar than many species that are not closely related. In fact the distance between songs of species in the same genus was almost equal to the distance to random species’ songs. Signal divergence among closely related syntopic species is thought to reduce potential mating errors and provide reinforcement for recently separated species (Hobel & Gerhardt 2003). However, this study provided no evidence that recognition of signals from congeners face greater consequences than from the signals of distantly related species. Possibly congeners are using other discriminatory cues, such as the time of day when signals are broadcast (see Chapter 3), or the strata from which a signal is broadcast, or visual cues to avoid mating errors.
While the overall result of this study showed that songs of congeners and family members were not nearest-neighbors, there were 2 genera, Trogon and Columba, for which acoustic nearest-neighbors were in the same genus. In both cases the species were in the same stratum and the similarity of their signals could result from convergence of songs for heterospecific recognition. Convergence of signals in sympatry (de Kort et al. 2002) could be a result of interspecific territoriality and should favor a recognition of heterospecific competitors for the defense of resources (Cody 1969). In such cases species might use cues other than song, such as visual cues, to avoid mating errors.
Songs of species in the same stratum are thought to converge on similar song
44
have acoustic nearest-neighbors in the same stratum, presumably in order to avoid acoustic interference. Spatial separation, such as singing from different stratum, should provide receivers with an additional cue for correct conspecific recognition (Klump 1996). Therefore we should consider the importance of species recognition and acoustic competition as well as effects from habitat structure when considering the evolution of acoustic signals for long-range communication.
Comparison of center and periphery of the acoustic community
Species in the center of acoustic space face different communication problems than species on the periphery (Nelson & Marler 1990). Nelson and Marler (1990) conducted discriminant function analyses of centrally and peripherally located species in a
community acoustic space with 13 syntopic species. The central species, field sparrow
Spizella pusilla, required 7 song variables for 98% correct classification while the peripheral species, chipping sparrow Spizella passerina, required only 3 song variables for 97% correct classification. Thus the centrally located species required more
information for accurate song recognition and presumably had greater difficulty
identifying conspecific signals because of the close proximity of many acoustic neighbors with similar song features. In the present study I compared the separation between
Signal detection theory predicts that rare species should be on the periphery of acoustic space while common species should be closer to the center (Wiley 2006). Since rare species are more likely to respond erroneously to heterospecific signals, they might adapt their signals to be farther from the crowded center of acoustic space (Wollerman & Wiley 2002b). However birds are not the only source of biotic noise in the forest. Even though frogs and insects tend to produce sounds at higher frequencies than most species of birds, species of all taxa that produce noise at the same location share a common acoustic space. Birds that are on the periphery of the avian community acoustic space could be near the center of the frog or insect community acoustic space. Future studies should consider acoustic space across multiple taxa for a more complete picture of acoustic communities.
Individuals can compensate for the challenges of interference from background noise by adjusting their signaling behavior. These adjustments could include an increase in signal amplitude, contrast from background noise, or the rate of signal repetition (Brumm & Slabbekoorn 2005). In speciose acoustic communities, like those in Amazonia, the center of the acoustic space might be so crowded that species’ signals have already
46
king penguins, Aptenodytes patagonica, increase the number of syllables in the presence of noise. These studies coupled with the results of the present study reveal that at least some species faced with increased levels of background noise sing more frequently than species with less background noise. Increased signal repetition could be a common behavior to overcome acoustic interference from background noise, but this possibility needs to be confirmed in more species. Alternatively these results might be explained by species near the centroid of acoustic space having denser populations than species further from the center of the acoustic community. Further investigation will be required to tease apart these two potential explanations of these results.
In conclusion, this study suggests that signals used by birds for acoustic communication in Amazonian forests are under selection to diverge from similar heterospecific signals. Signal divergence appeared only between species that interact acoustically at small spatio-temporal scales. This study also confirmed previous reports that the center of the acoustic community is more crowded than the periphery.
Acknowledgements