Bureau of Educational Research, University of Nairobi; and African Studies Centre, Leiden, Netherlands
Nutrition Intervention Research Project Report No. 8
PREFERENCES OF KIKUYU MOTHERS FOR CHILDREN'S FOODS Jan Hoorweg & Rudo Niemeyer
SUMMARY
A study on the préférences of Kikuyu raothers for children*s foods was conducted using the method of paired comparisons. Results show that these women have consistent préférences. This applies equally to choices between foods from the same food groups as to choices between foods from different groups, Reliability estimâtes for the group results are high. A préférence scale is developed that attempts to measure, independent of each other, préférences for protein foods and préférences for calorie foods.
Part 1. PREFERENCES FOR CHILDREN'S FOODS 1.1 Introduction
An important objective of many child nutrition programmes is to bring about changes in food préférences especially thé foods given to small children« Comprehensive évaluation of such programmes should therefore include an assessment of changes in thèse préférences and requires instruments to
measure them. ïn thé first part of this paper the feasibility of thé method of paired comparisons is explored and findings are presented on thé actual préférences of Kikuyu mothers.
In thé second part of the paper a préférence scale is developed. This scale will be employed in thé further course of this
research project.
Previous research in Uganda has shown that thé so-called »paired comparison method',in which a respondent chooses which of two alternatives she prefers, is particularly suited for studying thé food préférences of African raothers (Hoorweg & McDowell, 1978). One difficulty encountered in thèse
Ugandan studies, however, was that thé respondents often were unable to choose between foods belonging to différent food groups. Therefore^ one purpose of the présent study was to find out what foods Kikuyu mothers are willing and able to compare. This was done by giving mothers a séries of choices 5 at first between éascw foods from thé same food group and
later between foods from différent groups. The choice of food groups and of foods within each group was made on the basis of a previous study (Hoorweg & Niemeyer» 1978) where we found that Kikuyu mothers distinguish at least six major food groups : cereals» légumes, vegetables, fruits, méats and animal products? and roots and tubers»
1.2 Method _ of paired comparisons
The method of paired comparisons v/as originally developed by Thurstone, and the statistical assumptions and calculâtion
-2-have been deveioped over the last décade.
In the method of paired comparisons respondents are asked to compare two stimuli and to select which one t;hey prefer.» according to certain criteria. Por example, if the stimuli are foods, the respondent may foe asked to select which of two foods is »better% has a higher food value9 is preferred, and so forth» Several stimuli generally are employed* and usually all possible pairings or coraparisons are présenter»
The number of comparisons increases rapidly with the nuffiber o£ stimuli» Por examplet 3 foods give 3 possible
comparisons» 6 foods give 15 possible comparisons and 12 foods give 66 possible coraparisons. Por each comparison foetween two stimuli the proportion of respondents choosing the one or the other alternative can be computed, and when stimuli are present in more than one comparison, as is usually the case, the average proportion of choices for each stimulus can foe computed»
1,3 Method
Mothers of small children attending a MCH clinic at Kiambu town, a dispensary at Kambaa village and a MCH clinic at Kigumo village were presented with comparisons bôtween the foods that are listed in table 1. The aames of two foods were mentionedy and the mothers were asked to choose * which f ood would you prefer to give^ toia, ^two^year-old child* «
The study was conducted in three stages« In the first stage (schedules IA and 1B> the mothers were a'sked for their préférences between foods within the same food groups': meats and animal products, cereals, fruits} vegetables, légumes» and roots and tubers» Por example, the respondents were asked to choose between the three possible comfoinations of the fruits mange, orange and sweet banana, but not between fruits and foods from other groups. The two most preferred foods from each group were used in the subséquent stages.
In the second stage foods from different, but still some-what related, food groups were compared with each other
-o —
Tafele 1. FOOBS XKCLSBEß IM ME »IFFEHEM ÎSÏESVÎEW SCHEDBISS Study 1« FooAa belqnging.to the saae food
(IA) Comparieons between "Béate aast animal pxoduets cernais onlys and fruits oaly,
-b-eef -raaiae flottr^ -asajago —chioken — rçiilïet flotiär —oras^& -eçge -rfii'eet flo«p -sweet baaana —geai B>eô.t « j
betweea av«getaîsl«s only, s cuaa r«iote a«ô tabers o n l » s -cab&age N -ib estas
—cowpea leaves -peas
-kale -^Pi^epa peas -sweet —pampkia leavee
Study 2« Foods belonging to the sace aad to relajsed food (2B)CVegetaties,légumes»
meate and animal prodncts) -egge
-aeat -cabbags -kale —beaas -peas (Cereals»roots aad tabers)
-maiae flour -millet flour -aaize(whole grain)
—srice
-ïrisb potato -plefitaim
«I«
Study 3, fpods belongin^ to différent food gr-ougs
(Beats and animal productsseereals,,î'r«its8vegetaDles,leguffiôs, roots sœd tubers) (3A> (3B)
-eggs -aeat -millet jfloar -oaise flour —oraage —sweet baoana -riee -rice
-kale -cabbage -beaas —peas
-plantain -ïrish potato
«populär roots and tubers and maize and rice. All of the 15 possible comparisons wefe présentée to the respondents. In schedule 2B raothers were asked to choose between ail
possible combinations of the two most populär animal products* the two most populär vegetables and the two most populär
légumes,
ïn thé third stage^ rnothers chose between all kinds of foods. The schedules for fchis study (3A and 3B) contained one food from each of the six major food groups that are
distinguished by Kikuyu mothers« The most populär foods were combined in schedule 3A, thé second most populär foods in schedule 3BS Each schedule also included rice* The total number of possible comparisons is 21.
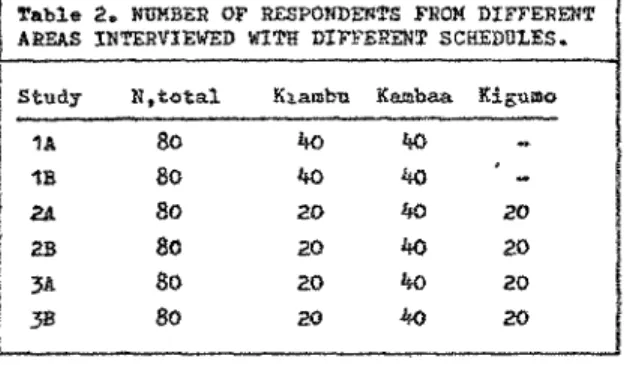
-4-Table 2, HBMBEE OF KESPOKDESTS FEOf DIFFERENT AfiEAS IHTEBVIEWED WITH DIFFEHBiT SCHEDUIES.
Study IA 1E 2A
as
3A 3B
H, total 80 80 80
80 80 80
Kiaratya 40 40 ?° 20 ZO 20
Kaœbaa Kigunso %0
40 <tO 2O 4C 20 <SO 20 40 2O
Por each of the six schedules ( ÏA,B|2A,B;3A,B>
groups of respondents were randomly split into two, The similarity of the préférence patterns in the two resulting «half* groups indicates the stability of préférences. For each item (=each comparison) two proportions were obtained, one for each of the two «half« groups. These two figures, together with the two proportions for each of the other items can be entered into a corrélation computation« The resulting coefficient indicates the similarity between the résulte in
{l.) the two groups and as such is a measure of reliability
1.4 Results % Reliability
The mothers had no difficulty in choosing between foods»
neither when these foods x<rere drawn frora the same food groups nor when they were drawn from different groups. Their
answers also show definite and consistent patterns and the reliability estimâtes for the different schedules confirm that they do not answer haphazardly. As shown in table 3 the corrélations between the results of the »half groups are not only high but, more or lesss constant for the different
schedules.
Table 2. KTtKBEK OF RESPONBEMyS FHOM BIFFERENT AfiEAS INTERVIEWE!) WÏTH DIFFERENT SCHEBUIES.
Sttidy
1A 1B 2A 2B
3A 3B
K, total
80 80
80 80 80
80
Kiaratm
40 Jrt>
20 20
ao
20
Kajabaa Kigumo
kO
l& '
-40 20 «> 20 ^ 20 4o 20
Por each of the six schedules ( 1A,B|2A,B;3A,B>
groups of respondents were randomly split into two. The similarity of the préférence patterns in the two resulting
«half groups indicates the stability of préférences. For each item (=each comparison) two proportions were obtained, one for each of the two «half* groups. These two figures, together with the two proportions for each of the other items can be entered into a corrélation computation. The resulting coefficient indicates the similarity between the results in
the two groups and as such is a measure of reliability
1.4 Re sul t s jt
The mothers had no difficulty in choosing between foods»
neither when these foods were drawn from the satne food groups nor when they were drawn frosn different groups. Their
answers also show definite and consistent patterns and the reliability estimâtes for the different schedules confirm that they do not answer haphazardly. As shown in table 3 the corrélations between the results of the 'half» groups are not only high but, more or less„ constant for the different
schedules,
Tafele 3« «SRtrr-HALF« BEUABÏLÏTÏ ES2IHATES POE Bm-ESEN? IKÏEBÏIEW SCHEB3LES
Study
U 1B
2A
as
3A 3B
,96 .96 .94 .S?
.92 .95
.98*
.9« .97 .93 .96 .9?
-a- Eaoli half consiste of ^O persona.SiEce the proportions preaentad for the different studies are all based on eaoplee of
oO people, corrected estimâtes aeeording to Spearaan-Brown are also preaanted.
and the reliability of schedules 3A and 3B would have been lowest of all. The fact that no such décline was found indicates that the choices made between foods from different f ood. groups are as rneaningf ui as the choices made between foods from the same food group.
(2)
The incidence of circular triads in the different studies confirma this. Agains if comparing foods frora different food
groups is not meaningfulj one would expect respondents to become less consistent in their choices and the numfoer of circular triads would increase from stage l to stage 3. Table
4 présents the average number of circular triads together
with the total number of triads present in each schedules
after correction for very unpopulär foods that hardly receive r 35
any choices . There is no noticeable increase in circular triads with thé exception of schedule 3A«. This interview schedule contained the foods that were most preferred during the previous stages, which suggests that respondents find it more difficult to choose consistently between very populär
foods.
l» 5 Resul t s ;_ Pre f erence s
-6-Table 4. IKCIBENCE OF CIBCBIAR THIABS
TS BIFFERENT STODIES
Stad; U 1B SA SB 3A 3B Average number per .3 .8 1.3 2.6 3.5 3.8 Kuaber of -triaâs preseated(B) 5 € 1O ao 20 35 Alrerags proportion per persott
( A/B * 1COS5 }
1Ï
13* 185«
-a- For a discussion of calculatione and corrections see text and note 3.
these figures the average proportion of choices for each food was also computed» and these figures are presented in tables 5t 6 and 7. Por exemple, the proportion of respondents
preferring oranges over rnango and sweet banana is . 95 and . 51 respectively (appendix 1). The average proportion of choices for oranges therefore is „73, the figure in table 5.
Table S
STTOT 1 : ATCSAGE PROPOBTIOM 0? CHOÏCES F08 BIÏTEBEHT F000S
(U)
Meats and aiimal «SS» chxchen goat Beat beef Cereals Mxllet flour aax.se flour wheat flotir Fruits orange sweet banana mango B=8o products ,90 .55 .30 .26 .91 .^6 .H> .73 •75 .0% (1B) V'egetables kale cabbage cowpea leaves pumpkin leaves iegumes beans peas pigeoa peae Boots ci&d tnbers
The résulta for thé flrst study, where only comparisons between foods from the same food groups were drawns are not surprising for those familiär with the diet of the Kikuyu child <table 5). The high préférence for finger millet, a cereal which was grown traditionally but now is far less easïly available in this part of Kenyas can be explained because, together with sorghum, i t is used to préparé ucurus children9s porridge. Somewhat surprising^ perhaps, is the high préférence for oranges* &. fruit which is far less common than, for example» sweet bananas. Among the animal productsf préférences seem related to tendernessi beef, which
generally is rather tough, is the least preferred méat or animal product for children. ïrish potato which was only introduced at the beginning of this Century is far more
populär for children than the older sweet potato« The mothers« liking for kale, or sukuma, is even more recents dating from the last ten to fifteen years»
In the second stage of this study respondents chose between various combinations of staple foods» Plantain and millet flour are by far the most populär foods followed by maize flour and îrish potafcoes (table 6}* Rice and whole grain
maise are the least populär staple foods for children. Although maize is one of the major staple foods for the adult Kikuyu |.t usually is not given as a whole grain to children of less than 3 years of age„ Another group of respondents chose
between the 15 possible combinations of animal products.
fable
STSSSI 2 : AVEMGE PKOPCBTION OF CBOICES FOR DIFFERES! FOOtS
(2A) (2B) Vegetables,légumes,
Cereals» roots and lubers Beats aad aaiaal products
plantain »?^ beaas «75 œillet flowr »69 «ggs «6u œaizB flour .51 kala „56 Irisïi potatc „^5 ffisat «*fO
rice B^3 peas .59
»aize{whole grain) ,19 cabT>age »3^
CJ
vegetabîes and ieguraes* Beans are the most preferred foodj followed foy eggs and kale. Meat, peas and cabbage follow lower on the list»
In the third stage5, foods f r om different food groups were compared. ït is evident that high protein foods such as beansj eggs* meat and peas usually obtain a high proportion of choicesj whereas the staple foods such as rice, potato,, millet flour and maîze flour are less favoured (table 7). This order of préférence is, however? not strictly according to protein content or calorie value,, as is shown by the high préférence for sweet banana and vegetables and by the low préférence for rice, when compared to nutritionally poorer foods such as plantain and ïrish potato.
ïable 7
STTOÏ 3 • ATO8AGE PEOPOMIOH
C3A>
beaiss «73
esse «70
kale .5? plantais .*•? millet îlottr *W orange ;VS riee »1^
-0F CHOÏCES FOK BIFFERENT FOODS C3B)
Beat
sweet liojaajaa caBbage peae fflaize flowr Iriah potato rie«
«73 067 .66 .63
1.6 Results ; Regional^^ariation
Since people living in different areas may have
i
fooé préférences it is important to gain some esti&ate ®f
the variation of préférences«, We were, firstt« interested
in the différence between the préférences of wossen living in remotes rural conditions and women living within feasy reach of an urban èoncentraticm of hef«!tu f^filiÄ'es ^isriû ^
i ' % l j ' 1^ 'f | tfi $ j:
otber services» j Second^, we were intereste<ï in fcbe * ïnlN1
f J >lt i
différence between the préférences of women living in tfeei% i
two major ecological aoaes within Central Province, fHat iis
between women living in the cool, wet, tea sone up on the siopes of the Nyandarua mountain range and women living in the hotter,, driers coffee sone spreading towards the Athi plains« Kiambu and Kambaa combine these contraste»
Kiambu is a small town 15 km north from Nairobi^ situated in the coffee zone» Most mothers attending the MCH clinic at the local hospital live outside Kiambxz itself but usually within easy reach of the town„ Kambaa is a sntall village, 50 km northwest of Nairobi, situated in the tea zone and 25 km distant from Linuru the nearest township« These two areas combine the urban-rural différence outlined above with the différence between coffee and tea zones.
Interview schedules 2A<, 2BS 3A and 3B were each presented to 20 raothers attending the MCH clinic at Kiambu hospital and 40 mothers attending the Kambaa dispensary {see table 2).
ïabîeS. CO8SELATÎOHS BCTWEEK PïEFESKMCES IK DIEFEPEKT AîîBAS FOS BÏFFEBESf STUDIES
i
St«ajr ' Kajabaa-Siaobu , 3? r,coï-rcctec
ZB
Sa 3B
-a-ES-3
.86 .96 »80 .59
,82 .95
î
i Kaœbaa-Klgtuao : " i T ï^corrected
.87
.85
ftjl.OO
.86 .90
-10-Preferences in the two areas were found to be very sisiilar and this similarity can be expressed as a corrélation
obtained by rseans of the sarae calculation that was used for the split-half results (page 4 }„ After correction for the respective reliabilities dfs the Kara&aa arafffeiie Kia«ifc dafeas '! l
these corrélations should come close to 1.00 if «o diff^rancejs
^ * <i N J ^
in fóod pjasferences exist betwöen wostea in the two ecolöaicsi
' t P pf a jB si 4 f al Ipla jjj äifljipäl r l*
sones or between rural women and woiften living near the town» Since the corrélations are indeed close to unity? it can safely be concluded that such différences are negligible«,
A third contrast is that between women living in different districts within Central Province, whichs although part of the Kikuyu homeland, show minor culturel différences. The present research project is to a large extent conducted in Kiambu and Murang*a districts« Resuits for the -woraen in Kambaa
{Kiambu district) were therefore compared with those of mothers of young children attending a MCH clinic at Kigumo in Murang'a» Kiguffio is situated in the centre of this district at the
altitude where coffee and tea zones meet« The distance to Murang'a town is roughly 35 km; Nairobi lies some 100 km to the South«, Again the corrected corrélations are close to unity which confirma that régional différences within Kikuyu territory are9 at the most, very small„
l»? Conclusion
Several conclusions can be drawn regarding the développent of scales to measure food préférences among Kikuyu mothers. First, Kikuyu mothers can be asked to choose foetween foods from different food groups without a loss in reliability or consistency. Second, although there is a high consensus regarding préférencest there is also an important minority
of women who differ in their likings« Third, the high
-11-2» PREFERENCE SGALI
»j. ...ntoduction
Nutrition intervention in Africas as well as pther developing countries, has emphasized thé importance of proteins in thé -diet of young children. McLaren ,(1974)' was.one of the -first to argue that childreh's need for calories general-ly has not receiv.ed thé attention it 'deserves, He>-.<and.~oiher.-s.f -have argued that thé importance of calories in thé young child*s diet should be emphasized„ Consequently,s •,, nutrition éducation should stress thé need for foods that are high 'in' calories as well- as those that- are high- - in- -pröfeëlHS,
Therefore to assess thé effeçtiveness of programmes of nutrition éducation, it is important to measure mothers«
préférences for protein foods and for calorie foods separately and to détermine whether thèse préférences change as a resuit of the éducation»
The main purpose of this study was to develop an instrument that can do just that, The dîfficulty hère is that thé
comrnon high protein foods are also high in calories. Por example$ the populär foeans are high in proteins as well äs in calories,, and a choice for this food is a choice for thèse two nutritional components together. The présent préférence scaîe consists of comparisons that enable us to distinguish between thé préférences for high calorie foods on thé one hand and for high protein foods on the other hand.
2,2 Method
The scale that. is presented hère consists of choices between three types of foods s Group A - foods with both a high calorie and a high protein content 5 Group B - foods with a high calorie content and a much lower protein content ; Group C - foods îow both in proteins and. calories . Each group consists of four foods < see table 9). With four foods in each group, there are 16 possible Group A-Group B
-~- »A.-"
Table 9. ITOTKÎEHT COHTEHT OF FOODS IKCLÏÏffiEB ÏS SKOtJPS A9B, AH» C {PER lOO GEAMS 0? EÖÏBLE PORTION)
| I
Group Ai
Group Bî
Oro-ap C:
Source s Beaae ï"eae Eggs Méat
Maiae flour Kioe
Millet flour Kale
Plaatain Orange Irish potato Cs'obage
Platt (1962>
Galeries
33? 158
362 352 532 48
128 53 75 23
Proteins (gfflsï
2slo
13.0 16.0
9.5 7.0 5.5 5.0
1,0
2ÜO
1.5
be given to our respondents. Therefore, thé interview schedule was split in two, each half consisting of 8
Group A-Group B comparisonsj 8 Group B-Group c comparisons» and 8 Group A ~ Group C comparisonss 24 comparisons in all, selected in such a way that each food appeared thé same nuraber of tiraes in each schedule (4A and 4B). The exact comparisons included in each schedule can be found in appendix 4.
Each schedule of 24 comparisons was presented to 120 Kikuyu mothers with young children at the same centres where the previous studies were conducted (40 mothers in KiarafoUj 40 in Kambaa and 40 in Kigumo)^
2,2 Results_ ;. Préférences
The proportion of préférences for each comparison can be found in table 10 where they are presented in a Condensed matrix.
-13-ïfifoXe $e
STOOT ^ : THE P8OPOEFIOSS OF BESPÜHBEHTS FOOSStERESEHÏED FOB IK]
ft 0 E o m 1 [H O fceaas peae egga meat malse flotw rlee aillefe floar kal« 9 rt M <£ tfa •rt e .92 .72 .88 .81 * * PBEFE8BIHG BIFFESEBÏ jX?Xa5AL COMPAfiïSOSS g Gr« ® t> t «93 .83 .87 .81 , * mj>! B
«-t 4« e*i « «75 .49 .78 „62 « .
| Group C ' t4 & .7* .H .66 -*5 « &
Legenö: Each cell coatams t&« proportion preferriag the food oa tha left
exaaple, §2$ of the respondents K=120 C! •H <S S S a .75 »48 «7% .59 .15 .28 .53 .50 ta d O ,68 .37 .63 .53 .2* ,1* .*5 .58 1a o e. c W .86 .73 .83 .82 .53 .38 .6? .81 o ia a
s
o .n .51 .67 .55 .25 .06 .33 .66 of respondentshand si de of préfère basas
the table.For c«rer maiza ïlour
' tWO
The résulte show that» when the calorie value of foods is high and more or less constant , raothers prefer high protein foods« On average,, the proportion of respondents preferring the high protein foods - beans, peas, eggs and meat - is „73f and the proportion of these preferring low protein foods is only .27» Assuming that these mothers are représentative of Kikuyu raothers in genera! we find a strong préférence for foods with a high protein content,,
Grpup jB-Gr ottp C cortipar i song Foods in Groups B and C have in comroon a low protein content» although the foods in
Group B contain slightly more prote^ns. The major différence hetween the foods in the/groups is in their calorie contents and the 16 Group B-Group C comparisons measure the mothers* préférence for calories in a child's diet„ The résulta show that the average proportion of respondents choosing the high calorie foods is only .42. Thus* 58 percent of the
-14-îrish PotatOj cabbage and orange. This is not only caused by a préférence for oranges but by préférences for thé other three foods as well, Thust we find that when proteins a«re, raore or less constant t Kikwyu raothers hâve a préférence for low
calorie foodse '
^
Grawp_A:-Group_ C cpreparisons._ Foods in Group A are high in
bofch calories and proteins and foods fcom^Group C are
la s i {
in bóth respects. The comparisons beitelen1 the féH
two groups confirm the préviens f indin§si. In tîte llfc't "dtion «
we found that Kikuyu mothers least favsour !foods that are ^o,w in proteins and high in calories (Group BK They fé^our loto protein - îow calorie foods more for their children.
Consequentlyf when low protein-low calorie foods (Group C) are compared with the high protein-high calorie foods (Group A) one would expect that préférences for thé two groups would be less far apart than was the case with thé comparisons between foods from Grottp À and foods from Group B» The
average proportion o£ respondents choosing Group A over Group C foods is indeed only „65^ while it was .73 for thé
comparisons hetween foods from group /A\ and group /B/.
Apparentlyf Kikuytt women hâve a préférence for high protein foods on the one hand and for low calorie foods on thé other hand, Further analysis confions this. Corrélations were coroputed for the average proportion of choices for each food with protein content and with calorie content respectively. The average proportion of choices, i„e« the préférences, correlate „5l with thé protein content and -»15 with thé calorie value of the foods. Since calories and proteins are themseives correlated thèse figures require correction«, Calculation of the partial corrélations raises thèse figures
to „81 and -, 74 respectively» This means that there is a strong positive relation between préférences and proteins and a strong négative relation between préférences and
calories among thèse women, Together thé variation in calorie and in protein content explains 63% of the différences in
-15-These findings can be re-ad in two ways* First, group préférences as roeasured with this scale can^ fco an important exient be explained by différences 'in nutritional values } this demonstrates the validity of the scale« Second^ although Kikuyu vomen fâay not actuelly think in teems of proteins and calories th'eir f ood . préférences In .effect consist o£ a''-préférence for f oods with a high protein content on. the o,ne ' hand and of a préférence for foöds with- a low calorie value on the other hand. This suggests, at least, that the importance' of foods with a high calorie value should be stressed more in nutrition éducation. To put this more concretely ; the highly nutritious foods such as beans, eggs9 peas and meat are aliready highly preferred but what also needs emphasis is the importance for children of foods with high calorie values such as millet flourf maize flour and rice.
39CONCLUSION
The method of paired coasparisons is v/ell suited for use aroong rural women with limîted éducation as the remarkably stable résulta of this study demonstrate. This method has gréât advantagesover other attititude measuresj particularly in situations where interviews can not be given in written'form. Only one or a few basic questions are used throughout thé interview which reduces thé chance of raisunderstandings« This risk is much greater in other attitude measures where usually raany questions are asked, questions that are often long and that often rely on subtleties of phrasing that are ôasily lost in oral interviews« The paired comparison- method also has thé advantage that respondents hâve to choose between oniy two alternatives. Rural, uneducated respondents prefer this over other response methods that either hâve more
alternatives^ rely on ratingss or use open ended questions. The paired coraparison interviews also tend to take iittle time. Moreoverj, the method lends itself to straightforward analysis and interprétation as weil as to analysis with advanced scaling methods»
^ been lisnited to group préférences«, Other rnethods of analysas will be tried at a later stage. Âraong them iss
first, the possibility of weighing choices for the nutrifeional values of the foods ineluded in the comparisons^ A second possibility is to construit préférence spaees for iirudîvido-als and for groups» This shou&d give insight Ift&o fchfö fobd
char act er is t ^cs that Ki&uyu women tâtce i&to in their choices and how tóiey weigh these*
The préférence scale that was présente^ in the second- part of the paper will be used in the further course of this
project | the two 'nutrition surveys in Murang'a district and the évaluation studies at nine child nutrition clinics»
In anticipation of these studies? the present findings ïndicate that foods with a high protein content (and which also have high calorie values) are widely preferred among Kikuyu mothers. Studies in Uganda have found this also to be the case among other African woraen (Hoorweg & McDowelljl978) At the same timej howeirer^ there is the finding that next
preferred are foods that are low in calories and low in
proteins» such as plantain9 potatoes and cabbage. It is likely that mothers will fall back on the low protein-low calorie foods such as plantain^ Irish potato and cabbage when the high protein «high calorie foods such as foeansj peass meat, eggs are not available. This suggests that in nutrition éducation among these woraen" serious attention should be paid to foods of high calorie value such as malze flour, millet flour and rice while the tendency until now has been to
concentrate mainly on foods with a high protein content.
NOTES
(1) These reliability coefficients differ from
spîit—half coefficients» Usually the grou^-tSf items is
split into two but in the present csséthe group of respondents is divided into two» In ot|ï@r*w>rdsj the usual split~half
method and the presenJxSne differ in that items and
respondents ha-^e-^en interchanged. As a conséquence the present c^tórfficients do not estimate the reliability of
NOTES
Cl) These reliabillty coefficients differ frons ordinary
split-half coefficients,, Usually the group of items is split inte two but in the present case the group of respondents is divided into two. In other wordss the usual split-half method and the present one differ in that items and respondents have been interchanged. As a conséquence the present coefficients do not estimate the reliability of individual préférences» They dos however«, indicate the précision by which the obtained
proportions estiroate the true proportions in the population. A high reliability in this sensé means that différences between groups can be estimated with a high degree of confidence. This method for caiculating reliabilities was also used by
Steffire (1972)«,
(2) A circular triad occurs when a repondent prefers
A over B5 and B over C but instead of choosing A over C, as could be expectedj, she chooses C. When more than three stimuli are studied more cornplicated inconsistencies may occur Involving more than three foods but for purposes of analysis these are usually broken down into triads«
C 3) Each of the schedules was examined for the présence of foods that are significantly more or significantly less involved in circular triads than the other foods in the same schedule.» This Is the case for three foodss respectively in schedules IA» 2A and 3A« On all three occasions this concerns foods with very low préférence scores 5 foods which are therefore rarely invoived in circular triads and thus artificially reduce the number of
circular triads» Por that reason these three foods were omitted from this particular analysis.
(4) As can be seen from table 9, all foods that were used in this study raeet these requirernentSj with the exception of one food in group B, kale« Like other foods in this group its
protein content is medium^ but unlike the other foods its calorie value is low. Kale was used because of the lack of feasible alternatives and because of its important rôle in the Kikuyu diet and in nutrition éducation, In further analysiss falling outside the scope in this paper, the calorie and protein content of
each food will be taken into account but for the present kale is included in the (B) group,
(5) Also taking into account the vitamin and the minéral content of the foodss using an additive index of iron? calcïufflj vitamin A, thiamine and ascorbic acid does hardly increase the total
REFERENCES
-18-£dwards y A„L« (1957)* Techaic^ues^of ^attitude ,janä_jscale
»^ New York ? Appleton Century Crofts«
Hoorweg^ J. and McDowell, ï» {1978}«, Ey ajluat ion of nu tri t ion éducation JLn :Af rica ....»_Cc8fflunity. studies fro^iJJ5anda.fii^1971--72_^
The Hague s Mouton» In press,
Hoorweg9 J. and Hiemeyers Re C 1978} . C_lass_if ication of foods
JCikviyu», University of Maîrobl s Bureau of Educational
r _ i ,
Research s mlm«>graphed paper«
Kanaal!,, MSG„ C1948) Rank .. eorj^l^tioj^jgethod s (Third édition^
1970} a London s Grif f in.
McLaren, B,S« C1974) The gréât protein fiasco. ianœt^Ca)^ 93-6
Platt , B* S«, (1962). Tables of représentative values of foods, c;oa>mo.nly us_ed_ in ^tropical count r les. London ï HHSO
Torgersons W»(1958)e Theory^ _gind_ jne th,ods_ of scal i ng .,
New York : WIIey„
Stefflre, ¥»Ja {1972 K Some applications of multidimentional
scaîing to social science problems. In A„K„ Romney?
R„Ne Shepardj SaB„ Merlove (Ed.) Muit läimensional scal ing^
Appendix l»
STUDY Ï -. THE PROPORTIONS OP RESPONDENTS PREFERRING DIFFERENT FOODS, PRESENTED FOR INDIVIDUAL CCf-',PARISONS
<1A>
1.
2, 3.
4.
5. 6.
1 7.
8.
9. 10.
(18)
1. 2. 3. 4» 5. 6. 7. 8. 9. 10.
Comparisons between animal products only, cereals only and fruits only (N=80)
1 2 3 4 5 6 7 8 9
Beef - .28 .10 „39 Chicken .72 - ,18 .74 Eggs .90 .82 - .97 Goat meafc .61 .26 .03
Maize floür - „11 .80 Killet flour „89 - .92 Wheat flour .20 .08
Mango - . 05 Orange .95 -Sweet banana .97 .49
Comparisons between vegetables only, légumes only, and roots and tubers only (N=80)
1 2 3 4 5 6 7 8 9
Cabbage - .66 .11 .76 Cowpea Ivs. .34 - .18 .59 Kaie .89 .82 - .31 Purapkin Ivs. .24 .41 .19
Beans - .77 .85 Peas .23 - .66 Pigeon peas .15 .34
-Irish potato - .28 Plantain .72 -Sweet potato .18 .35
10
.03
.51
***
10
.32 .65
~*
Appendix 2,
STUDY 2 : THE PROPORTIONS OF RESPONDËNTS PREFERRING DIFFERENT FOODS, PRBSEOTED FOR INDIVIDUAL CCKPA^ISONS
<2A) Comparisons 1= 2, 3„ 4. 5. 6. Kaize flour Millet flour Maize Rice Irish potato Plantain (2B) Comoarisons 1. 2. 3. 4. 5. 6. Eggs Meat Cabbage Kale Beans Peas betweén 1 -.79 .15 „ .43 . .44 .
.67 .
between
1
-.14
.33 .
.51 , .69 . .35 .
cereals 2 21 -13 28 24 70 3 .85 .87 -.72 .75 .86 animal 2 86 _ 41 59 65 50 3 .67 .59 -.81 .77 .61
4 roots
4
.57 . .72 .
.28 . -.56 .70 .
product s
4
.49 . .41 . .19
-.79 .33 .
and 5 55 76 25 44 -75 tubers (N=80) 6 .33 .30 .14 .30 .25 "™
j, vegetables and légumes <N=30)
5 31 35 23 21 -16 6 .65 .50 .39 .67 .84 «
Appendix 3
STUDY 3 : THE PROPORTIONS OF RESPONDENT S PREFERRÎNG DIFFERENT FOODS, PRESENTES FOR ÎNDIVIDUAL CQMPARISONS
(3A) Coranarisons 1. 2. 3. 4. 5. 6. 7«, (3! 1. 2„ 3. 4. 5. S. 7„ Eggs Millet flour Orange Rice Kale Beans Plantain 3> Comparisons Keat Maize flour Sweet baiiana Rice Cabbage Peas Irish potato fcetween 1 -.41
.23 . .01 . .34 . .59 . „20 .
between 1 _ .15 .41 . „10 , = 35 . .46 . .15 .
foods from different
2 59 -61 16 66 81 43 3 .77 .39 -.26 .74 .66 .62 4 .99 .84 .74 -.82 .86 .89 5 .66 . .34 . .26 . .18 . -.61 .52 .
foods frora different
2 85 -85 44 86 84 41 3 .59 .15 -.18 .51 .46 .10 4 .90 .56 .82 -,85 .80 .54 5 .65 . .14 . .49 . .15 . -.43 .21 . food 6 41 .
19 . 34 . 14 . 39 . -15
food
6
54 . 16 . 54 . 20 . 57 . -20 aroups (N=SO) 7 80 57 38 11 48 85
"
aroups (N=80) 7 85 59 90 46 79 80 •*".Appendix 4
INTERVIEW SCHEDULES 4A and 4B
C4A) C4B)
Beans — rnaiae flour »~B
Peas - rice $~ß
Méat - millet flour ^-£ Peas - roillet flour A-B Eggs - roaize flour $-8 Méat - rice #~s
Maiae flour - orange ê-t Rice - cabbage t-~&
^^^o^^s,^iL^^fA^ie>tm--~-~^-^~^~^~~
Millet flour ~ orange &-C. Maize flour - I. potato S- C
Rice — plantain /?-£ Millet fl. - I» potato^-d
Beans - irish potato /?-£ Beans - orange #~C Peas ~ plantain â~C Eggs - irish potato $~C Heat - cabbage $-£ Peas « cabbage fl-£ Eggs - orange #*£ Méat - plantain fl-£
1* 2 f. ——3 4 9 10 11 -*6 5 6 — *f -12 17 19 ; 20 23 8 13 14 15 16 1 21 ! -22 24
Peas - maize flour Beans — rice
Eggs - millet flour
Eggs — rice
Méat - maise flour Beans - raillet flour
Maize flour - plantain Rice -„Irish potato Millet flour - cabbage
Killet flour - plantain
Maiae flour - cabbage Rice ~ orange
Beans — plantain Peas - irish potato Beans - cabbage Peas - orange Eggs - plantain Méat - Irish potato Eggs - cabbage Méat — orange
1* 2 3 11 12 21 &¥*autt^>O 5 6 7 _@ 13 w*««dL& 19 20 9 10 15 16 17 18 23 24
This report is one of a series by the Nutrition Intervention Research Project, studies of child nutrition programmes in Kenya, particularly in Central Province, The aim of these reports is to make some results of these studies quickly available; the data are only partially analyzed and the
reports therefore preliminary„
This project is financed by the African Studies Centre, Leiden, Netherlands and is based at the
Bureau of Ëducational Research, Univefsity of Nairobi,
Other reports;
1. Progress report, April 1977 2, Progress report, November 1977
3„ A short dictionary of Kikuyu names of foods, meals and drinks, 1977
4„ Report on the Family Life Training Centres,
Bungoma, Busia, Kisumu, Kiambu and Murang'a; 1977 5. Revised Research Plan, Pebruary 1978
6. Progress report, July 1978
7. Classification of foods among the Kikuyu, 1978 8„ Préférences of Kikuyu mothers for children's