Measuring the productivity of national R&D-systems: Challenges in
cross-national comparisons of R&D-input and publication output indicators
Dag. W. Aksnes,1* Gunnar Sivertsen1, Thed N. van Leeuwen2 and Kaja K. Wendt1
1) Nordic Institute for Studies in Innovation, Research and Education (NIFU), PO Box 2815 Tøyen, NO-0608 Oslo, Norway
2) Centre for Science and Technology Studies (CWTS), Leiden University, PO Box 9555, 2300 RB Leiden, The Netherlands
*) Corresponding author: e-mail: dag.w.aksnes@nifu.no, telephone: + 47 99 47 43 38, fax: + 47 22 59 51 01
Abstract
We investigate methodological problems in measuring research productivity on the national level by comparing official R&D statistics from the OECD with publication data from the Web of Science. Data from 18 countries are analysed. The paper problematizes the approach taken in studies where R&D statistics are used as an input variable and publications as an output variable to draw conclusions about the productivity or efficiency of national research and innovation systems. Our study considers possible pitfalls in such analyses and proposes steps that can improve the comparability of these two data sources. We recommend that efforts are made among the OECD member countries to produce more reliable and commensurable international R&D-statistics.
Introduction1
At a time when investments in research, development and innovation are under pressure, increasing attention is focused on possible ways to measure the productivity and efficiency of national R&D and innovation systems. Several studies have responded to the need for such measurement (e.g. May 1997 and 1998, King 2004, Leydesdorff et al. 2009). There still seems to be problems with the comparability of input and output statistics, as well as of the different national innovation systems themselves. This is clearly illustrated by the world-wide practice in Science and Technology (S&T) Reports of presenting resource statistics and output statistics in separate chapters instead of combining them in measurements of productivity or efficiency. The tradition of producing national or international S&T Reports dates back to OECD initiatives in the early fifties and has continued up until today (Godin 2007). Examples are the
Main Science and Technology Indicators (MSTI) from OECD, the European Report on Science and Technology Indicators from Eurostat (European Commission statistical office), the
2
because the methodological challenges involved have attracted more attention than the need for measures that can offer improved comparability.
Nevertheless, several independent studies have been conducted of country-level comparisons using R&D statistics and data on scientific publications or patents. Data from R&D statistics on resource allocation are seen as input variables and publications or patents as output variables. Because of the broad interest in such studies, the results have typically been published in Nature
or Science. May (1998) compared different countries’ investments in R&D with the number of scientific research papers they produced, to draw conclusions about their scientific productivity: the United Kingdom, Switzerland, Denmark and Sweden came out well, while France, Italy and Germany performed poorly. In an article from 2004 with the subtitle “What different countries get for their research spending”, King (2004) updated May’s study (1998) and also discussed the potential role of language bias (which he considers less important over time) and the issue of time lag that has to be considered when comparing resources for research results in the form of publications. After such adjustments, the results suggest that the United Kingdom is the most efficient country, followed by Canada and the United States, while France and Germany are close to the average. The indicators in these studies have, however, not been standardized or attained common acceptance as performance measures.
With an increasing focus on demonstrable results from public investments in research and innovation, indicators of productivity and efficiency will likely be calculated and presented more often; this makes the potential methodological issues at stake more important and urgent. While cross-national analyses of publication productivity are scarce, productivity measures involving technology and innovation statistics have attained much more attention. This topic is, however, outside the scope of the present paper. Here, we concentrate on possible combinations of available bibliometric data and R&D resource statistics on country level. Below we describe some basic characteristics of our data sources.
R&D resources
The collection of statistical data for use in national research policy began in Japan and the U.S. in the early fifties and soon spread to a number of other countries. However, since each country used its own definitions, it was difficult to compare the results. At the same time, R&D expenditure was increasingly recognized as a significant factor in the economy, and so the need for adequate, comparable statistics increased. In 1962, the OECD initiated a set of international, comparable statistics for research and development among member countries, with 1963 being chosen as the first international R&D statistical year. These statistics were based on the new
Frascati Manual (with the full title: “The Proposed Standard Practice for Surveys of Research and Experimental Development”) which set out guidelines for collecting and processing data on countries' resources for R&D efforts. Written by and for the OECD member states' national experts on R&D statistics (NESTI), the Frascati Manual has been revised several times since, most recently in the 2015 edition (OECD 2015a) which will be fully implemented in the production of R&D statistics in 2016.
The higher education sector (HES) is the most heterogeneous of the R&D performing sectors with a wide range of institutions involved in teaching and hospital activities and large national variation in its organisation. An international definition of what is a university is still missing. The R&D content is challenging to measure in HES, and hence a wide range of methods are used to fit the system and resources for compiling statistics in each country. The updated version of the Frascati Manual contains marginal changes in the definition, but guidelines and criteria
are improved to reflect recent changes in the way R&D takes place and how it is funded. The new version includes dedicated sectorial Chapters and the text on the HES is for the first time gathered in an own chapter.2 Note that most countries have a biannual survey of the HES (question of resources and response burden) and that the year between (normally even numbered years) is based on estimates and more aggregated data.
The manual sets out fundamental definitions of R&D and what is to be included and excluded under which terminology: research personnel categories, fields of science and types of funding sources are all defined. Resources devoted to R&D in terms of expenditure and personnel are specified according to several performing sectors: higher education, government, business, and private non-profit organisations. The manual also contains recommendations and best practice for surveys on R&D in these R&D performing sectors.
The Frascati Manual contributes to the basis for understanding the role of science and technology in economic development. The definitions are internationally accepted and serve as a common language for discussions of research and innovation policy. Originally an OECD standard, it now offers an acknowledged standard in R&D studies all over the world, through a successful step-by-step cooperation among the OECD member states and statistical experts. The Manual is widely used by various organisations associated with the United Nations and European Union. The OECD and Eurostat have coordinated their collection of data since 2001. In addition, the UNESCO institute for Statistics (UIS) is cooperating with the other international statistical agencies and updating their database annually.
Publication output
The Thomson Reuters Web of Science (WoS) database has, until recently, been the most commonly used database for international comparisons of publication output, but Scopus (run by Elsevier) has also proved useful, for example in the OECD report Measuring Innovation: A New Perspective (2010). While the R&D statistics provided by the OECD offer complete coverage of the national research systems of member states, neither of these bibliometric databases cover the full range of scientific publications, and neither do they cover other relevant research outputs. Both databases are constantly increasing their reach and coverage, and now include all major journals within the natural sciences, medicine and technology as well as peer reviewed conference proceedings, but their coverage of published output in the social sciences and humanities remains limited. This issue is discussed further below.
In this article, we attempt to further explore the issue of the productivity of national science systems. We will investigate problems and pitfalls involved in combining input statistics and publication output data. Based on different analyses we will discuss the various problems involved. As basis for the analyses we have made a selection of 18 nations. These are countries which are the world’s leading scientific nations in terms of publication volume and scientific impact. In the analysis, we are focusing on the current situation but also on changes over time, using data from the 20-year period 1993-2012.
2 The revision task force on HERD revealed in a quick survey of 14 countries that nationally there is large
4
While this study is analysing productivity at the level of nations, it should be noted that there are numerous previous studies where publication productivity has been studied at meso and micro levels, for example, universities, faculties, departments, research groups and individuals (see e.g. van Leeuwen et al. 2003; Abramo, D’Angelo & Pugini 2008; Kivinen, Hedman & Kaipainen 2013; Piro, Aksnes & Rørstad 2013; Rørstad & Aksnes 2015). Such studies may be based on data from the organisations involved, national databases and publication databases such as WoS. Generally, the amount of data may be small enough to allow better quality controls than in macro studies. However, some of the methodological challenges discussed in this article are relevant also in such studies.
Data and methods
The study is based on data from the OECD’s Main Science and Technology Indicators 2013/2 (OECD 2014). This database contains a broad range of R&D-indicators collected by the OECD countries and seven non-member economies. Data on scientific publishing are retrieved from the WoS database licensed at CWTS, Leiden University. The version of WoS applied, includes the Science Citation Index Expanded, the Social Sciences Citation Index and Arts and Humanities Citation Index. The analysis does not include documents from the subsidiary databases Conference Proceedings Citation Index and the Book Citation Index. Only regular journal articles, reviews and letters are included in the study.
For the countries investigated, we have calculated various indicators: at an overall national level, at the level of sectors (Higher Education and Government sector) and field (Natural sciences), involving both current data and time series.
On the output side, both number of publications and mean normalized citation impact (MNCS) are used as indicators. The length of the citation window applied is the length of the publication period, plus one year extra (for example, when analysing the 2009-2011 publications, we apply a four-year window for the 2009 publications (that is, 2009-2012), and a two-year window for the 2011 publications (2011 + 2012)). Internationally, percentile citation measurement (e.g. top 10%) is increasingly used as citation impact indicator. However, we have not applied this indicator in the present paper. The reason is that we want to compare all input (as reported in the OECD statistics) with all output (as indexed in Web of Science), not just the tip of the iceberg for the output.
Two indicators are used as input variables: number of R&D work-years (full-time equivalents, FTE) and amount of PPP $ spent on R&D. The two indicators are complementary measures of the research efforts. R&D FTEs take the time spent on R&D for each person involved in R&D into account. Purchasing Power Parities (PPPs) are currency conversion rates that both convert to a common currency and equalise the purchasing power of different currencies. In other words, they attempt to eliminate the differences in price levels between countries in the process of conversion. There are some issues regarding the use of PPP$ for comparing R&D that complicates this: There are differences in price level of total GDP and wage level among developed/less developed countries. Nevertheless, PPP is regarded the most adequate measure of comparing R&D expenditure levels across countries (see Dougherty et al., 2007 for a discussion of possibilities of developing an R&D specific PPP-indicator).
Results
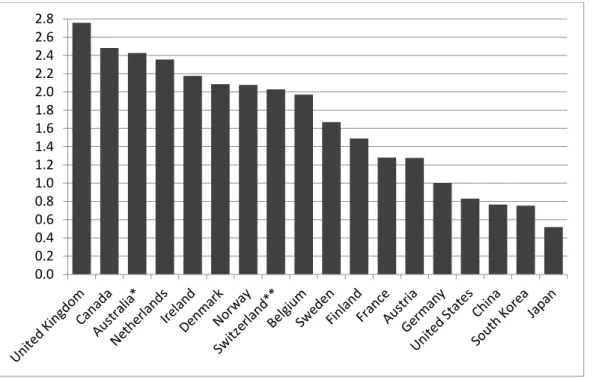
In a first analysis, we calculated the number of publications per gross domestic expenditure on R&D in current mill. PPP $. This is the most simple and rough measure of the scientific productivity of nations. The results are shown in Figure 1. As can be seen there are very large differences in the scientific productivity of nations. The most productive country, United Kingdom, produces five times as many publications per mill. PPP $ as the least productive country, Japan (2.8 and 0.5 publications, respectively).3 The selected Asian countries are the ones with the lowest scientific productivity. It is noteworthy that the largest science nation in the world, USA, has a low productivtiy with 0.8 publications only, slighly above China. Apparently, the USA is not a very efficient research system, with high costs per produced publication.
Figure 1. Number of publications in 2012 per gross domestic expenditure on R&D in current mill. PPP $ in 2012
*) R&D expediture data from 2010.
**) PNP sector not included (1.6% of total expenditures in 2008).
The indicator presented above is, however, associated with several methodological problems. Scientific publishing is only one results of R&D, and this type of output is not equally important for the different R&D performing sectors. In the business enterprise sector the results are rarely published in scientific journals, and if they are, this is often because the research was performed in collaboration with actors from other sectors. The business enterprise sector accounts for the majority of the R&D expenses in most countries. For the countries included in the analysis, the proportion ranges from 52% (Canada and Norway) to 76-78% (China, South Korea, and Japan). In comparison, only a very small proportion of the scientific publications are from the business enterprise sector (in Norway, as an example, 6%, compared to 52% of the expenses). Accordingly, the productivity indicator as calculated above can be misleading.
3 It should be noted that for Switzerland, the most recent indicators available are for 2008, and the figure is
therefore based on old data for this country. For Australia, 2010-figures have been used.
6
One way to overcome this problem is to exclude expenditures in the business enterprise sector in the calculations, thus limiting the analysis to the higher education and government sectors. This methodological choice was also made in in a productivity study by Leydesdorff & Wagner (2009). The relative size of the higher education and government sectors varies significantly across countries due to the fact that the public research system is organised differently. While in some countries the majority of the applied research takes place in universities, others have a larger publicly funded research institute sector involved in a larger part of applied research. A calculation method based on a combination of the two sectors is, therefore, well justified. At the same time, it should be acknowledged that while scientific journal publishing is a main output channel at universities, other types of research dissimilation may be equally or more important in the governmental research sector. For example, the higher education sector accounts for 91 % of the total journal publication output of the Netherlands. In comparison, this sector accounts for 32 % of the total R&D expenditures, while the corresponding figure for the government sector is 11% (2012-figures).
Another important methodological issue concerns the measurement of scientific output. Many publications are internationally co-authored, and are the results of collaborative efforts involving more than one country. There are different principles and counting methods that are being applied in bibliometric studies. The most common is “whole” counting, i.e. with no fractional attribution of credit (every country gets full credit). A second alternative is fractionalised counting where the credit is divided proportionally between the participating countries. For example, in the case of an article with three addresses, two of which are from the UK, the UK will be credited with two thirds of an article. One can argue that these counting methods are complementary: The whole count gives the number of papers in which the country has “participated”. A fractional count gives the number of papers “creditable” to the country (Moed 2005). The different effects of whole counting versus fractionalized counting have been demonstrated at the country level (Gauffriau et al. 2008); subfield level (Piro et al. 2013); and, individual level (Lee & Bozeman 2005).
The choice of counting method influences significantly the output variable because the proportion of internationally co-authored publications varies across countries (e.g. 24% for China and 66% for Switzerland, 2011). Using fractionalised counting, the publication numbers are reduced with 11% for China compared to whole counting and with 44% for Switzerland (2012). These are the extremes. USA has a 17 % decrease (Table 1). Generally, small countries tend to get higher productivity results from whole counting than fractional counting (Aksnes, Schneider & Gunnarsson 2012).
Table 1: Reduction in total number of publications (WoS) due to fractionalization, selected countries (2012)
Country Reduction in total number of publications due
to fractionalization
China 11%
Denmark 37%
Netherlands 35%
South Korea 14%
Sweden 38%
Switzerland 44%
United Kingdom 30%
United States 17%
We have chosen a fractional counting scheme for the further analyses because we find it more appropriate for the measurement of productivity. Countries with extensive foreign collaboration would otherwise be credited research output created by scientists in other countries (Aksnes, Schneider & Gunnarsson 2012).
Another issue concerns the time dimension. There is a certain time lag from the research is carried out to the results appear as published articles (Rousseau & Rousseau 1998). This fact should be taken into account when the productivity indicator is constructed. A two-year lag has been considered as appropriate at this high level of aggregation (Leydesdorff & Wagner 2009). This means that the publication data from 2012 should be compared with the R&D expenditures in 2010 and a corresponding time lag should be used in the temporal analyses.
In Figure 2 below we have calculated productivity indicators using the principles described above.
Figure 2. Number of fractionalized publications 2012 per mill. PPP$ of R&D expenditures in the higher education and government sectors (2010).
When the productivity indicator is calculated using this method, United Kingdom still appears as the most productive country and Japan as the least productive country. UK scientists produce two and a half more publications per mill PPP$ spent on research than the Japanese do. The rank order among the other countries, however, differs considerably. China and South Korea improve significantly and now rank as number 10 and 11 of the countries, respectively. Ireland and Switzerland are now the second and third most productive countries. The Netherlands rank in the middle with 3.6 fractionalised publications per mill PPP$.
8
Another way to measure the productivity is using data on human resources. In the R&D-statistics of the OECD, there are two relevant categories, one contains data on the total number of R&D personnel and one on the number of researchers. The first category contains all personnel involved in R&D-activities while the latter is limited to the researchers. The large majority of the publications will obviously be produced by the population of researchers. Therefore, this category would be the most relevant for comparing the publication output. Unfortunately, the countries have adopted different criteria for defining a researcher, therefore it is difficult to make cross-national comparisons.4
In Figure 3, we have compared the publication output with the number of R&D personnel and with the number of researchers. In both cases, we have used person-years spent on R&D (full time equivalents, FTE) as the input indicator and not head counts. The latter decision is justified by the fact that we want to adjust for differences among countries/positions in the time devoted to research.
Naturally, the productivity is significantly higher when it is based on the population of researchers only. One would expect that the rank order based on the two input measures would show a corresponding picture. However, some countries perform much better when the indicator is based on number of researchers (FTEs) rather than the number of R&D personnel (FTEs). This is particularly the case for the Netherlands, South Korea and Switzerland. In the first two countries, the researchers account for only 58% of the population of R&D personnel. Most other countries have significantly higher ratios, with United Kingdom at the top with 89%. As described above, the use of different classification systems rather than the organisation of the research systems themselves may account for the differences. Below, we will therefore limit the comments to the indicator based on total R&D personnel.
Ireland and Sweden seem to be the most productive countries according to this indicator, with 0.66 and 0.64 fractionalised publications per R&D personnel. At the other extreme, research personnel in China and Japan are producing 0.24 and 0.27 publications, only.
4 Cf. the following quote from the Frascati Manual (section 33): “Two systems are now used by OECD member
countries to classify persons engaged in R&D. Chapter 5, Section 5.2, contains definitions both for a
classification by occupation, linked as far as possible to the International Standard Classification of Occupation – ISCO (ILO, 1990), and for a classification by level of formal qualification based entirely on the International Standard Classification of Education – ISCED (UNESCO 1997). While it would be desirable to have data based on both classifications, most member countries use only one. As data are available by occupation for most OECD countries, the fact that a few still collect only qualification data for some or all sectors means that serious problems of international comparability remain.”
Figure 3. Number of fractionalized publications 2012 per R&D personnel (FTE) and per researchers (FTE) in the higher education and government sectors (2010).*
*) Figures for the USA are not available.
Surprisingly, the picture we get from this indicator differs much from the previous one based on economic resources (PPP$) for some of the countries. This is most notable for United Kingdom, which obtains the highest productivity in terms of PPP$, but only ranks as number 12 of 17 countries (data for the USA not available) when the indicator is based on R&D personnel. China and Australia get lower ranks with this indicator while the opposite is true for Austria, Sweden, and the Netherlands.
A possible explanation for the deviating patterns identified in the two productivity indicators (Figures 2 and 3) may be related to the cost of R&D-personnel. Obviously, this varies significantly across the countries (e.g. Switzerland versus China) but part of these differences will be adjusted for by using the PPP numbers and not the raw R&D expenditures. If Chinese researchers are less costly compared to researchers from other countries one would expect that China would perform much better when productivity is measured based on economic resources. Indeed, this also seems to be the case. However, the results for some other countries are rather counter-intuitive. United Kingdom has a high number of R&D personnel compared to the volume of the economic expenditures (on par with China) and this also holds for Australia and Finland. Therefore, these countries fare less well when using FTE. Other countries such as Sweden and Austria have high ratios, in other words, high costs per work-years R&D, and these countries are improving. In fact, the number of PPP$ per R&D personnel is almost twice as high in Sweden as in Finland. It is difficult to understand why there are such large differences between two otherwise very similar countries. Again, the differences may rather be attributed to national differences in the methods for collecting the R&D-statistics.
0 0.1 0.2 0.3 0.4 0.5 0.6 0.7 0.8 0.9 Ire lan d Sw ed e n Sw itz erlan d N eth erl an d s Can ad a De n m ar k Be lgi u m Au stria Sou th Kore a Au stra lia N o rw ay U n ite d K in gd o m G erm an y Fran ce Finla n d Jap an Chin a
Number of fractionalized publications per R&D personnel (FTE) in the higher education and government sectors
Number of fractionalized
10 Time series
We have also analysed how productivity developed over time in the period 1993-2012. Globally, the resources spent on R&D have increased significantly during this period. The total R&D expenditures in the higher education and government sector in the OECD countries have risen by 83% from 1991 to 2010 in constant prices (constant prices are used in order to adjust for the inflation during the period). The publication output has shown a very strong growth as well. The total number of publications of the OECD countries has increased by 72 % (Web of Science data) during the period 1993-2012. Thus, the expenditures have grown slightly more than the publication output, despite the fact that the coverage of the WoS-database in terms of indexed journals also has increased significantly in the period. These figures would imply – somewhat surprisingly –that the scientific productivity in terms of published papers generally is lower today than it was 20 years ago. It should be noted, however, that using whole counts instead of fractionalised counts in the calculation of output would give a different picture because the proportion of internationally co-authored publications has increased significantly during the period.
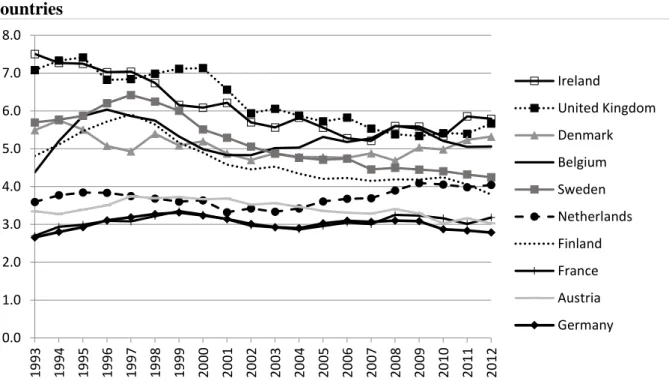
In Figure 4 and 5, we have shown the development in the scientific productivity where the publication numbers (fractionalized counts) have been compared with the input in terms of R&D expenditures in the higher education and government sectors (constant prices). The rank order across the countries has not changed significantly during the period: countries with a high scientific productivity in 2012 also tend to have a high scientific productivity in the prior years. One exception, however, is China with a significant increased productivity. Several of the EU countries show a descending productivity, particularly during the first decade of the period analysed.
Figure 4. Number of fractionalized publications per mill. PPP$ of R&D expenditures in the higher education and government sectors (constant 2005-prices), 1993-2012*, EU-countries
*) A two-year time lag has been used in the calculations, i.e. the publication output in 1993 is compared with the R&D expenditures in 1991 (plotted as year 1993), and so forth. Some countries do not report annual R&D-expenditures, in these cases figures for intermediate years have been extrapolated.
Figure 5. Number of fractionalized publications per mill. PPP$ of R&D expenditures in the higher education and government sectors (constant 2005-prices) 1993-2012*, other-countries**
*) A two-year time lag has been used in the calculations, i.e. the publication output in 1993 is compared with the R&D expenditures in 1991 (plotted as year 1993), and so forth. Some countries do not report annual R&D-expenditures (usually biannual), in these cases figures for intermediate years have been extrapolated.
**) Figures for South Korea are not available for the period 1993-1996.
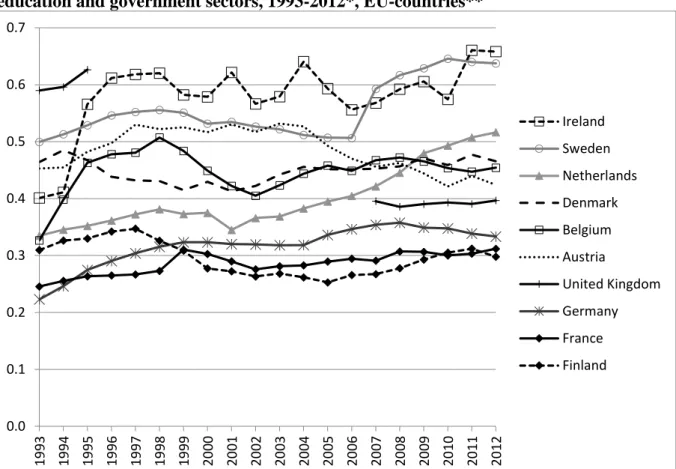
Using R&D personnel (FTE) as input indicator instead of R&D resources gives a somewhat different picture (Figures 6 and 7). The productivity of most EU countries now appears as more stable during the period, but the Netherlands has increased from 0.33 fractionalised publications per R&D personnel in 1993 to 0.52 in 2012. There is also a significant increase for China and South Korea.
0.0 1.0 2.0 3.0 4.0 5.0 6.0 7.0 8.0
19
93
19
94
19
95
19
96
19
97
19
98
19
99
20
00
20
01
20
02
20
03
20
04
20
05
20
06
20
07
20
08
20
09
20
10
20
11
20
12
Switzerland
Australia
Canada
China
Norway
South Korea
United States
12
Figure 6. Number of fractionalized publications per R&D personnel (FTE) in the higher education and government sectors, 1993-2012*, EU-countries**
*) A two-year time lag has been used in the calculations, i.e. the publication output in 1993 is compared with the R&D personell figures in 1991 (plotted as year 1993), and so forth. Some countries do not report annual R&D personnel statistics, in these cases figures for intermediate years have been extrapolated.
**) Figures for United Kingdom are not available for the period 1996-2006.
0.0 0.1 0.2 0.3 0.4 0.5 0.6 0.7
19
93
19
94
19
95
19
96
19
97
19
98
19
99
20
00
20
01
20
02
20
03
20
04
20
05
20
06
20
07
20
08
20
09
20
10
20
11
20
12
Ireland
Sweden
Netherlands
Denmark
Belgium
Austria
United Kingdom
Germany
France
Finland
Figure 7. Number of fractionalized publications per R&D personnel (FTE) in the higher education and government sectors, 1993-2012*, other countries**
*) A two-year time lag has been used in the calculations, i.e. the publication output in 1993 is compared with the R&D personell figures in 1991 (plotted as year 1993), and so forth. Some countries do not report annual R&D personnel statistics, in these cases figures for intermediate years have been extrapolated.
**) Figures for the USA are not available. Figures for South Korea are not available for the period 1993-1996.
It is difficult to draw a coherent conclusion from the patterns identified in Figures 4-7. Not only is the rank order of countries in terms of productivity rates different when using the two input measures; the internal development for individual countries often shows rather different patterns, for example, decrease versus status quo. Increased productivity cannot be interpreted as increased efficiency of the research systems without reservations. An apparent increase for some countries may be due to extended coverage in the WoS-database or a changing publication pattern towards indexed journals. Probably, such factors may explain some of the increase for South Korea and China. China has implemented explicit policies to stimulate WoS based journal publishing (Zhou & Leydesdorff 2006).
0.0 0.1 0.2 0.3 0.4 0.5 0.6 0.7
19
93
19
94
19
95
19
96
19
97
19
98
19
99
20
00
20
01
20
02
20
03
20
04
20
05
20
06
20
07
20
08
20
09
20
10
20
11
20
12
Switzerland
Canada
South Korea
Australia
Norway
Japan
14 Productivity versus citation impact
What is the relation between the scientific productivity and the citation impact of the publications? Will countries with high productivity rates also have high citation rates? In order to analyse this question, we have shown in Figure 8 the mean normalize citation impact (field-normalized and compared to the world average) of the publications within two main areas: Natural sciences and Medical and life sciences. We have used average figures for the 2009-2011 period. As can be seen, there are large variations among the countries. The Asian countries have low citation rates in both fields while Switzerland ranks on the top in the Natural sciences and Netherlands in Medical and life sciences.
As the productivity rate shows large variations depending on the input data used, it is difficult to make any definite statement on the relationship. Switzerland has very high citation rates in both fields and also ranks among the top countries in terms of productivity, regardless of input measures used. This also holds for the Netherlands, albeit this country has an intermediate position when productivity is measured based on PPP$. Ireland has a high productivity but an intermediate position in terms of citation indicators. Japan shows poor performance both in terms of citation rates and productivity.
Figure 8. Mean normalized citation impact (MNCS) for publications (fractionalized) in 2009-2011, Natural sciences and Medical and life sciences.
0.60 0.65 0.70 0.75 0.80 0.85 0.90 0.95 1.00 1.05 1.10 1.15 1.20 1.25 1.30 1.35 1.40 1.45
Natural sciences
Medical and life sciences
Analysis of the natural sciences
We have carried out a separate analysis for the natural sciences. This field is adequate for a particular analysis as most of the publication output will be published in journals indexed in WoS. Another reason is that national journals with low impact factors present in WoS affect the outcomes of bibliometric analysis stronger in medicine and life sciences as compared to the natural sciences. This affects some of the countries more than others, in particular France and Germany (van Raan, van Leeuwen & Visser 2011).
However, only some of the selected countries report separate statistics for the natural
sciences. We have retrieved R&D statistics from 2009 for the natural sciences and compared to the publication output in the field in 2011 and to the mean normalized citation impact (MNCS) in 2009-2011.
There are large variations in the measured productivity between the countries within the natural sciences. South Korean scientists publish four time as many publications per million PPP$ spent on research than German scientists, 15.2 and 3.7, respectively (cf. Figure 9). Comparing the two neighbour countries Netherlands and Belgium, we find that Belgian researchers publish twice as many publications per million PPP$ than researchers from the Netherlands (11.6 versus 6.1). Again, it is hard to believe or put reliance to statistics showing such large differences in productivity.
16
Figure 9. Number of fractionalized publications 2011 per mill. PPP$ of R&D expenditures in the higher education and government sectors (2009) and mean normalized citation impact (MNCS), 2009-2011 publications. Natural sciences.
In Figure 10, the R&D expenditures within natural sciences have been plotted against the total normalised citation score (TNCS). The latter score is introduced as an indicator where both the output and impact of the publications are taken into account (the fractionalized publication counts have been multiplied with the mean normalized citation impact of the publications). Apparently, this gives a better correspondence between the input and output measures. Because there are large differences in the size of the countries, the scale of the axes is logarithmic.
0.0 0.2 0.4 0.6 0.8 1.0 1.2 1.4 1.6
0 2 4 6 8 10 12 14 16
Number of fractionalized publications 2011 per mill. PPP$ of R&D expenditures in the higher education and government sectors (2009)
Mean normalized citation impact (MNCS), 2009-2011 publications
Figure 10. Total normalized citation score (TNCS),* 2009-2011 publications and mill. PPP$ of R&D expenditures in the higher education and government sectors (2009). Natural sciences. Log scale.
*) Fractionalized publication counts multiplied with the mean normalized citation impact (MNCS) of the publications.
Discussion
We have presented carefully selected indicators of the scientific productivity of countries. They exhibit inconsistent results with large differences between the countries. There seems to be a fundamental methodological problem related to the fact that the content domain of the numerator is not identical and strictly comparable with the one of the denominator. In the calculations we have taken appropriate steps to make the input and output statistics as
comparable as possible, e.g. by limiting the input statistics to the higher education sector and government sector and using fractionalised publication counts. Nevertheless, we are left with results that often appear strange and unexplainable. Therefore, we come to the conclusion that the validity of the measurement has to be discussed before any research based measurement of productivity or efficiency at national level can be described. Three factors may lead to differences or similarities that could undermine the comparability and validity of such a measure:
The coverage and comparability of countries in the Web of Science Differences in national research systems
Comparability of R&D statistics across countries 1000
10000 100000
100 1000 10000
Im
p
ac
t
ad
ju
ste
d
p
u
b
lic
ation
c
o
u
n
ts
R&D expenditures, PPP$
Finland Austria
Denmark
Belgium Sweden
Netherlands South Korea
United Kingdom
Japan
Germany
Ireland
18
While the R&D statistics provided by the OECD offer complete coverage of the national research systems of member states, the WoS database does not cover the full range of scientific publications, nor does it cover other relevant research outputs. Over the years, the coverage of the database has increased and it now includes all major journals within the natural sciences and medicine. Technology is also reasonably well covered. However, conference proceedings – an important publication channel in this field – are not included in the database version applied in the study. When it comes to the social sciences and the humanities in particular, the coverage of published output remains limited (Sivertsen & Larsen 2012).
The limited coverage of the social sciences and humanities in publication databases may affect countries differently. Data from the OECD MSTI show that the share of humanities/social science research in the government and higher education sectors differs significantly among countries. Some countries use less than 10 % of their research expenditures in these fields (e.g. UK and China, 5%)), while others countries may spend around 25-30 % (Norway, Finland, Denmark, Austria, Ireland). In contrast, the proportion of social sciences and humanities publications in the WoS varies from 2 % (China, Japan) to 14-16 % (Australia, USA, United Kingdom). Thus there is a gap, and parts of the research outputs within these fields are not visible in WoS.
A similar issue is present in the engineering sciences, which are only partially covered in the
Web of Science (around 50 % of the publications according to Moed (2005), and around 60-80% of the publications measured in 2010 according to van Leeuwen (2013)). Countries specializing in engineering sciences (e.g. many Asian countries) therefore face a comparative disadvantage when productivity indicators are calculated. However, this can only explain a relatively minor part of the differences in our selected productivity indicators.
Language bias has also often been an issue when interpreting country representation based on the Web of Science. While the process of internationalization results in a diminishing effect of language bias in the natural sciences (King 2004), the combined use of English and the national language continues to be important in e.g. profession oriented scientific journals in clinical medicine and in the general publication patterns of the social sciences and humanities. Both the exclusion of journals in national languages and the inclusion of them in some fields may affect bibliometric indicators (van Leeuwen et al. 2001; Archambault et al. 2006; van Raan et al. 2011). There are also large variations with regard to use of national languages among the disciplines in the social sciences and the humanities (Sivertsen 2016). Hence, we focus especially on differences that cannot be explained by language bias. For example, Figure 2 shows that there are indeed major differences between the large English speaking countries of the UK and the USA. The UK is apparently 90 % more efficient than the USA. Language bias cannot explain such large differences, particularly not in the natural sciences, as shown above. Such observations must lead to take a closer look at other factors that may influence national variations in such measures. We therefore turn to the central topic of this paper, in a closer discussion about what R&D statistics can tell about national research systems, and what OECD metadata can tell us about how the R&D statistics are produced.
One major difference between national research systems is the degree of public investments in defence related R&D, and where the research results often may not be published in public channels such as scientific journals. OECD member state analysis of federal budgets (GBOARD data) shows that in the US, defence constitutes the majority of public spending on
R&D (57 %). Moreover, 27 % of the budget of the US Department of Defence was spent by the department’s intramural labs, and that key external performers of such research include universities/colleges (National Science Board 2012, Chapter 4). This means that these kinds of R&D expenditures will feature strongly in the higher education and government sectors in data for the USA. Nonetheless, the majority of R&D resources in the USA are spent in the business enterprise sector. This might explain why scientific publishing is low compared to spending in the higher education and government sector. Again, international comparability of the resource and output statistics is affected.
The third factor that may affect the validity of measurements for research efficiency is potential problems with the comparability of national R&D statistics. In spite of common guidelines and definitions in the OECD Frascati Manual, differences remain in the way R&D statistics are compiled (Luwel 2004). R&D statistics are generally based on estimates given by respondents from research organisations (e.g. departments and firms). These kinds of sources should immediately make it clear that R&D statistics are not a form of accountancy, or an exact science, as they are based on respondents’ subjective judgments about the R&D activities at their (big or small) unit during the past year. However, when the Frascati guidelines are followed, this should not be a problem on the aggregate country level. Possible problems that are relevant for the government and higher education sectors include the following:
The main differences in national results may be based on whether a survey has been conducted as recommended in the manual.
The complexity of R&D surveys used, resources for conducting the surveys, information provided and the quality of administrative registers used in sampling can all play an important role in influencing results, as can national adjustments to the recommendations (as the judgments made by respondents depend on adjusted questionnaires).
The R&D data may or may not derive from units that actually have been performing R&D or administrative units related to R&D performers, the degree of overlap is likely to differ between countries and also among the different institutions performing R&D within each country. 5 Whether the data are collected at institution or department level will also influence the results, as contact with department level must be regarded as more accurate/precise.
While time use surveys of research personnel in the higher education sector are recommended by the OECD, the actual level of detail and frequency of applying such surveys differs among countries.
5 Potential problems with the comparability of national R&D statistics: The following disclaimers (mainly
concerning the calculation of HERD) apply to the reference countries in this study (Eurostat 2009a; Eurostat 2009b; OECD 2012):
United Kingdom HES: Numbers on R&D FTEs are estimated. The Higher Education Statistics Agency
(HESA) does identify support staff, due to the way data are compiled. Hence, FTEs are probably underestimated.
Switzerland: Expenditures of R&D are missing for the universities of education and universities of music and arts. Expenditures of University clinics are only partially included in the higher education sector.
Netherlands: Compiling the R&D statistics of the HES in the Netherlands is not based on a survey but publicly available information distributed by the higher education institutes themselves or by the professional associations of the sector. The time-use coefficients are crucial for the outcome. The quality of the coefficients relies on the consistency between the nominator (resources of staff spent on R&D) and the denominator of the quotient (number of staff on the payroll of the universities). Time-use coefficient of the universities has been rather stable around (0.6 or 60%).
20
The increasing focus on research and on performance based funding in many countries might in itself influence the answers provided by the respondents.
Some countries’ data are based on estimates or projections which are adjusted by the OECD Secretariat to meet the international norms.
The level of inclusion of the PNP (private-non-profit) sector in the government sector varies considerably.
Both the higher education sector and government sector are sometimes underestimated as R&D in humanities and social sciences might be excluded.
The way in which differing kinds of capital expenditures are included or excluded from statistics (investment in research facilities and buildings). (Part of) capital expenditures are not always consistently included in the higher education and government sectors.
In some countries, the government sector only includes units at the central or federal level, while state and local government establishments are excluded.
In some countries, R&D statistics for the higher education sector are only based on financial reports from the universities (the Netherlands, United Kingdom, and others).
The tendency for defence spending to be excluded (entirely or largely) and the related presumption that these kinds of expenditure are excluded by countries that do not report defence in their GBOARD data.
Several countries have made minor or major revisions to their data and/or methods over the years, creating breaks in series and meaning that information about the consequences of changing levels of R&D expenditures may be lacking.
The overall impression is that at the level of individual countries there has been a high degree of stability in the methodology of collecting R&D-statistics over time, which means that the time series produced are consistent. However, due to different national interpretations or deviations from the guidelines of the Frascati Manual, problems arise when using the data in cross-country comparisons.
As described above, a new edition of the Frascati Manual has now been published. This would represent a good opportunity to improve the international comparability of the data. In the implementation process of the new Frascati Manual, the OECD is encouraging the member countries to increased efforts and improvements regarding quality reporting and metadata (OECD 2016). Nevertheless, it seems unlikely that the problems described above will be solved with the implementation of the new Manual, as there still is acceptance for large national deviations in the methods for collecting R&D statistics.
Conclusions
There is an increasing interest in possible ways to measure the productivity and efficiency of research systems, by comparing input and output indicators. We have shown that even with a carefully designed approach for comparability – that is by combining R&D statistics for the higher education and government sectors with fractionalized publication counts – our analyses yield unexpected and inexplicable results.
We therefore discuss possible factors that may affect the validity and comparability of such a measurement: the coverage and comparability of countries in the Web of Science; differences in national research system; and the comparability of R&D statistics across countries. We find substantial problems in terms of comparability for all three factors. While bibliometric data are produced centrally, in a uniform manner with consistent definitions of core elements (e.g. ‘publication’, ‘author’, ‘citation’) which are the same for all countries, R&D statistics are
collected in a decentralized manner that depends on different local practices. It seems that the international comparability of R&D statistics so far does not stand the test of bibliometrics. We conclude that improved data production and coverage, as well as more robust
international coordination of statistical practices, will be needed if the R&D statistics
produced by the OECD are to be meaningfully combined with bibliometric data in efficiency studies at country level and in country-to-country comparisons.
References
Abramo, G., D’Angelo, C. A., & Pugini, F. (2008) The measurement of Italian universities’ research productivity by a non parametric-bibliometric methodology. Scientometrics, 76(2), 225-244.
Aksnes, D. W., Schneider, J. W., & Gunnarsson, M. (2012) Ranking national research systems by citation indicators. A comparative analysis using whole and fractionalised counting methods. Journal of Informetrics, 6(1), 36-43.
Archambault, É., Vignola-Gagne, E., Cõté, G., Larivière, V., & Gingras, Y. (2006)
Benchmarking scientific output in the social sciences and humanities: The limits of existing databases. Scientometrics, 68 (3), 329-342.
Dougherty, S. M., Inklaar R., McGuckin R. H., & van Ark, B. (2007) ‘International
Comparisons of R&D Expenditure: Does an R&D PPP Make a Difference?’ In E. E. Berndt & C. R. Hulten (eds.) Hard-to-Measure Goods and Services: Essays in Honor of Zvi Griliches, pp. 291-323. Chicago: University of Chicago Press.
Eurostat (2009a) Synthesis of National Quality Reports for 2009 R&D and GBOARD statistics. http://ec.europa.eu/eurostat/cache/metadata/Annexes/rd_esms_an2.pdf Eurostat (2009b) R&D national quality reports HES 2009. Unpublished reports.
Gauffriau, M., Olesen Larsen, P., Maye, I., Roulin-Perriard, A., & von Ins, M. (2008) Comparisons of results of publication counting using different methods,
Scientometrics, 77(1): 147–176.
Godin, B. (2007) Science, accounting and statistics: The input-output framework. Research Policy, 36, 1388-1403.
den Hertog, P., Jager, C.J., Vankan, A., te Velde, R., Veldkamp, J., Aksnes, D. W., Sivertsen, G., van Leeuwen, T., & van Wijk, E. (2014) Science, Technology & Innovation Indicators 2014. Challenging in measuring the efficiency of national science, technology & innovation systems. Dialogic.
Holton, G. (1987) The Scientific Imagination. Cambridge: Cambridge University Press. Katz, S. J., & Hicks, D. (1998) Indicators for Systems of Innovation (IDEA 12-98). Oslo:
STEP-group.
King, D. A. (2004) The scientific impact of nations. What different countries get for their research spending. Nature, 430 (Jul 15), 311–316.
Kivinen, O., Hedman, J., & Kaipainen P. (2013) Productivity analysis of research in Natural Sciences, Technology and Clinical Medicine: an input-output model applied in comparison of Top 300 ranked universities of 4 North European and 4 East Asian countries. Scientometrics, 94(2): 683-699.
Lee, S., & Bozeman, B. (2005) The Impact of Research Collaboration on Scientific Productivity. Social Studies of Science, 35(5): 673–702.
22
Handbook of Quantitative Science and Technology Research, pp. 315-338. Dordrecht: Kluwer.
May, R. M. (1997) The Scientific Wealth of Nations. Science, 275( Feb 7), 793-796. May, R. M. (1998) The Scientific investments of Nations. Science, 281 (Jul 3), 49–51. Moed, H. F. (2005) Citation Analysis in Research Evaluation. Dordrecht: Springer. National Science Board (2012) Science and Engineering Indicators 2012. Arlington VA:
National Science Foundation.
Leydesdorff, L., & Wagner, C. (2009) Macro-level indicators of the relations between research funding and research output. Journal of Informetrics. 3(4), 353-362. OECD (2010) Measuring Innovation: A New Perspective. Paris: OECD Publishing. OECD (2012) R&D Sources and Methods Database, extracted 2012.
http://webnet.oecd.org/rd_gbaord_metadata/
OECD (2014) Main Science and Technology Indicators. Volume 2013/2. Paris: OECD Publishing.
OECD (2015a) Frascati Manual 2015: Guidelines for Collecting and Reporting Data on Research and Experimental Development. Paris: OECD Publishing.
OECD (2015b) Working Party of National Experts on Sceince and Technology Indicators. Revision of Frascati Manual Chapter 9. Higher education sector.
DSTI/EAS/STP/NESTI(2015)3/CHAP9
OECD (2016) Working Party of National Experts on Science and Technology Indicators. The International Data Collection on Resources Devoted to R&D: Options for
Implementing the OECD Frascati Manual 2015. DST/EAS/STP/NESTI(2019)/3. Piro, F., Aksnes, D. W., & Rørstad, K. (2013) A macro Analysis of Productivity differences
across fields: Challenges in the Measurement of Scientific Publishing - Journal of the American Society for Information Science and Technology, 64(2), 307-320.
van Leeuwen, T. N., Moed, H. F., Tijssen, R. J., Visser, M. S., & Raan, A. F. (2001)
Language biases in the coverage of the science Citation Index and its consequences for international comparisons of national research performance. Scientometrics, 51(1), 335-346.
van Leeuwen, T. N., Visser, M. S., Moed, H. F., Nederhof, A. J., & Raan, A. F. J. (2003) The Holy Grail of Science Policy: Exploring and Combining Bibliometric Tools in Search of Scientific Excellence. Scientometrics, 57(2), 257-280.
van Raan, A. F. J. (2004) ‘Measuring Science. Capita Selecta of Current Main Issues’. H. F. Moed et al. (eds.) Handbook of Quantitative Science and Technology Research, pp 19-50. Dordrecht: Kluwer Academic Publishers.
van Raan, A. F. J., van Leeuwen, T. N., & Visser, M. S. (2011) Severe language effect in university rankings: particularly Germany and France are wronged in citation-based rankings. Scientometrics, 88(2), 495-498.
Rørstad, K., & Aksnes, D.W. (2015) Publication rate expressed by age, gender and academic position - A large-scale analysis of Norwegian academic staff. Journal of Informetrics, 9 (2), 317-333.
Rousseau, S., & Rousseau, R. (1998) The Scientific Wealth of European Nations: Taking Effectiveness into Account. Scientometrics, 42(1), 75–87.
Sivertsen, G., & Larsen, B. (2012) Comprehensive bibliographic coverage of the social sciences and humanities in a citation index: An empirical analysis of the potential.
Scientometrics, 91(2), 567-575.
Sivertsen, G. (2016) Patterns of internationalization and criteria for research assessment in the social sciences and humanities. Scientometrics, 107(2), 357-368.
Wendt, K. K., Aksnes, D. W., Karlsson, S., & Sivertsen, G. (2012) ‘Challenges in cross-national comparisons of R&D expenditure and publication output’. Proceedings of STI
2012 Montreal. 17th International Conference on Science and Technology Indicators, pp 826-835. Montreal, Canada 2012-09-06
Zhou, P., & Leydesdorff, L. (2006) The emergence of China as a leading nation in science.