Development and Application of Analytical Methods to Evaluate
DNAPL Remediation Using a Brine Based Remediation
Technology
Patrick M. Sanderson
A thesis submitted to the faculty of the University of North Carolina at Chapel Hill in partial fulfillment of the requirements for the degree of Master of Science in the Department of Environmental Science and Engineering, School of Public Health.
Chapel Hill 2006
Approved by:
Advisor: Dr. Cass T. Miller
Reader: Dr. Gaylen Brubaker
ABSTRACT
Patrick Sanderson: Development and Application of Analytical Methods to Evaluate DNAPL Remediation Using a Brine Base Remediation Technology
(Under the direction of Cass T. Miller)
With the general inability of existing groundwater remediation techniques to
efficiently remove dense non-aqueous phase liquids (DNAPLs) from the subsurface, a novel
strategy known as the Brine Barrier Remediation Technique (BBRT) has been proposed as a
potential alternative to currently used remedial strategies. However, there are still numerous
open issues concerning this new technology including the complexities it introduces into
contaminated systems that cause the analytical methods commonly used for system
characterization to fail.
New analytical methods were developed that were compatible with BBRT, and
capable of quantifying the common groundwater contaminant, perchloroethene (PCE),
chlorinated degradation products, and two surfactants, MA-80 and Triton X-100 often
employed in remediation techniques. The developed methods were subsequently used to
calculate mass balances for PCE and surfactant recovery within a field-scale implementation
of the BBRT. Supplemental experiments were conducted to more closely examine the fate of
ACKNOWLEDGEMENTS
I would like to thank my advisor, Dr. Cass T. Miller for his support and insight during
my most recent stay at UNC as well as committee members Dr. Stephen C. Whalen and Dr.
Gaylen Brubaker. Also, Dr. Joseph A. Pedit, Deona Johnson, Pam Birak, and several other
members of Dr. Miller’s research group have dedicated countless hours to the laboratory and
field experiments necessary for completion of this master’s project. I would also like to thank
Lauren Murphy for commiseration during the writing process. Thanks to my family and
friends for giving me plenty of space during the last three months, and if I have left anyone
out, I thank you as well.
I would like to acknowledge the National Institute of Environmental Health Sciences
for providing the funding this project, and RETEC, Dead Sea Bromine Group, and Dover
TABLE OF CONTENTS
LIST OF TABLES...vii
LIST OF FIGURES...ix
LIST OF SYMBOLS AND ABBREVIATIONS...x
1. INTRODUCTION...………1
2. BACKGROUND………...6
2.1. Soil Vapor Extraction (SVE)………...6
2.2. Thermal Remediation Techniques………...7
2.2.1. Hot Water and Steam Injection………....8
2.2.2. Soil Heating………...10
2.3. In-situ Oxidation………...11
2.4. In-Situ Bioremediation………...13
2.5. Cosolvent Flushing………...14
2.6. Surfactant Flushing………...16
2.7. Brine Barrier Remediation Techniques (BBRT) ………..19
2.8. BBRT Open Issues………...20
2.8.1. Field Scale Issues………...21
2.8.2. System Complexity Issues……….24
2.8.3. Analytical Issues………26
3. METHODS DEVELOPMENT……….31
3.1. Analytical Method Selection……….31
3.2. Standards Preparation………...32
3.3. Sample Handling and Preparation………34
3.4. HPLC Method Overview ………..35
3.4.1. MA-80, PCE, and Daughter Products Method Description…...35
3.4.2. Triton X-100 Method Description……….38
3.4.3. Method Performance Criteria...40
4. RESULTS AND DISCUSSION………42
4.1. Data Validation……….42
4.1.1. Surrogate Spikes………42
4.1.2. Check Standards………44
4.1.3. Lab Spikes……….49
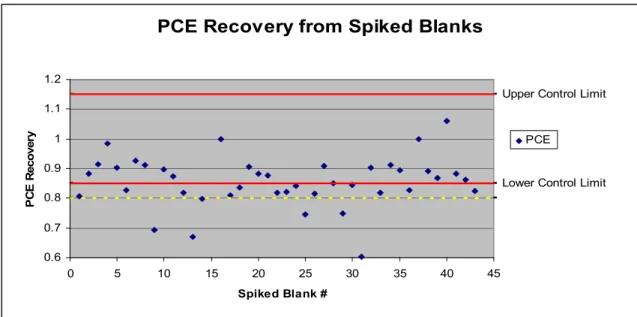
4.1.4. Field, Trip, and Spiked Blanks………..52
4.1.5. Duplicate Samples……….55
4.1.6. Split Samples……….57
4.2. Experimental Results……….………...62
4.2.1. PCE Recovery……….………...62
4.2.2. MA-80 and Triton X-100 Recovery...65
5. SURFACTANT SORPTION EXPERIMENTS …….………77
5.1 Introduction……….………...77
5.2 Materials and Methods...80
5.2.2 Column Experiment 2……….82
5.2.3 Batch Sorption Experiment……….83
5.2.4 Sample Analysis………..83
5.3 Results………....84
5.3.1 Column Experiment 1……….84
5.3.2 Column Experiment 2……….86
5.3.3 Batch Sorption Experiment……….88
5.4 Discussion………..90
6. SUMMARY AND CONCLUSIONS…….…...………95
LIST OF FIGURES
Figure 2.1. Surfactant Winsor Phase Diagram………...17
Figure 3.1. Chlorinated Solvent and MA-80 Calibration Standard Chromatogram………....37
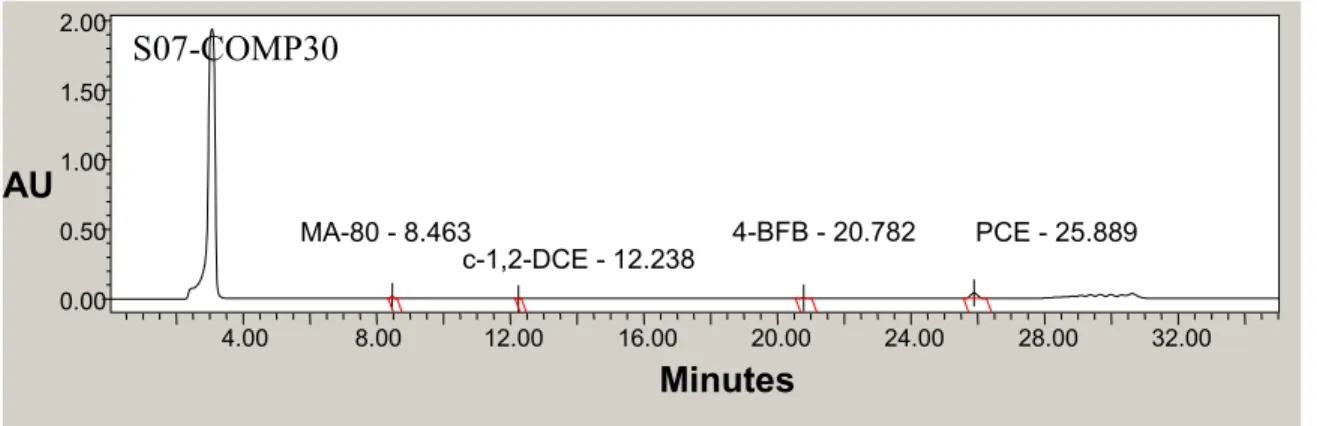
Figure 3.2. Full-Scale Chromatogram of Field Sample for PCE and MA-80 Method………37
Figure 3.3. Chromatogram of Field Sample Scaled to Species of Interest………..37
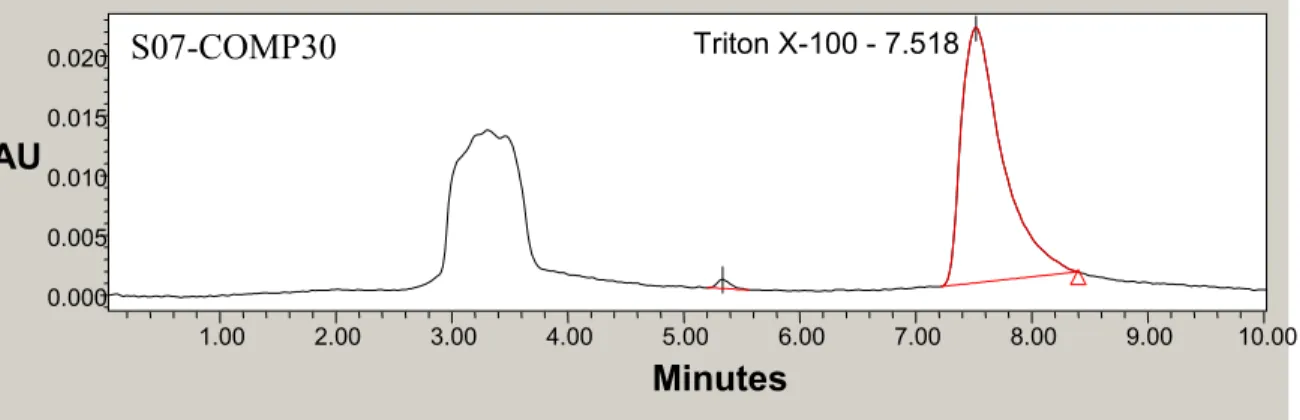
Figure 3.4. Triton X-100 Calibration Standard Chromatogram………..39
Figure 3.5. Chromatogram of Field Sample for Triton Method…….……….39
Figure 4.1. Surrogate Spike Recovery……….…44
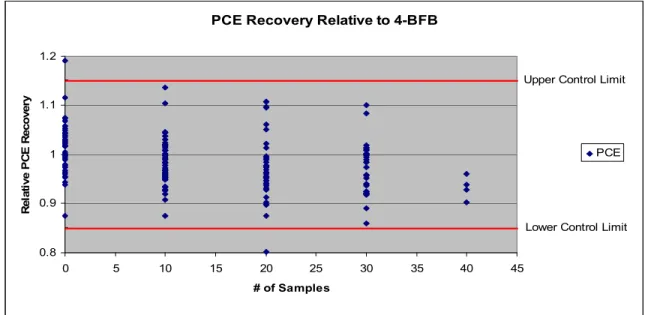
Figure 4.2. PCE Recovery Relative to 4-BFB……….46
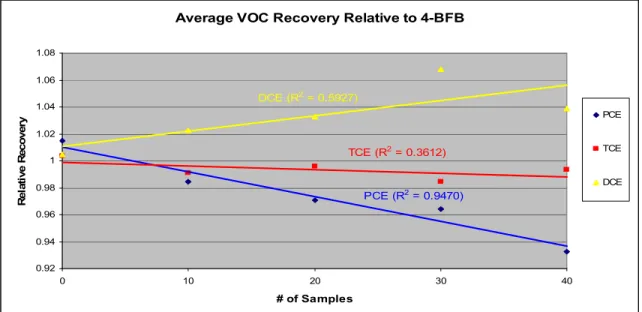
Figure 4.3. Average VOC Recovery Relative to 4-BFB……….………47
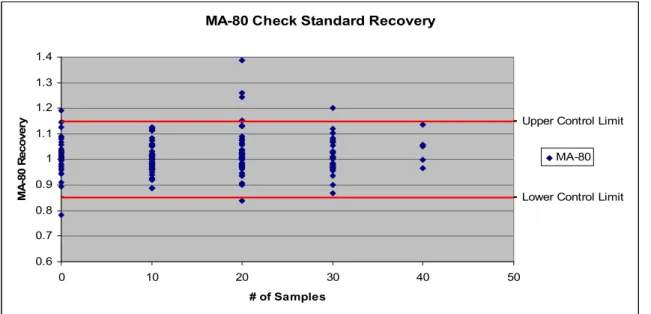
Figure 4.4. MA-80 Check Standard Recovery………48
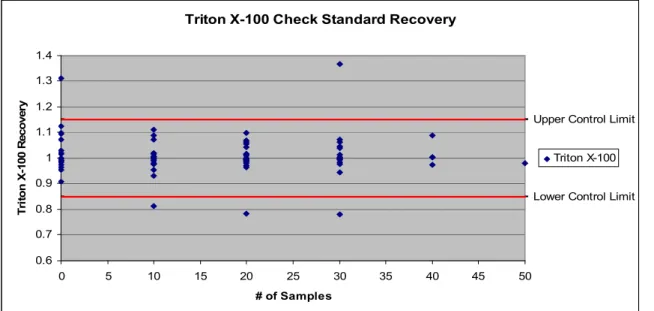
Figure 4.5. Triton X-100 Check Standard Recovery………...………49
Figure 4.6. PCE Recovery from Lab Spikes………50
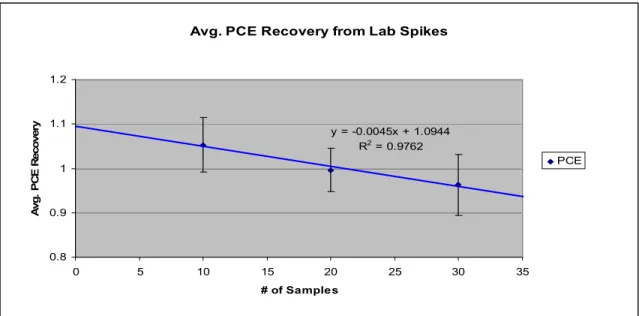
Figure 4.7. Average PCE Recovery from Lab Spikes……….51
Figure 4.8. Chromatogram of a Trip Blank Sample………53
Figure 4.9. PCE Recovery from Spiked Blanks………..54
Figure 4.10. RPD of Duplicate Surfactant Results………...57
Figure 4.11. RPD of Duplicate PCE Results………...57
Figure 4.12. RPD of Effluent Split Samples………59
Figure 4.13. RPD of Waste Split Samples………...60
Figure 4.14. RPD vs. Total Surfactant Concentration……….61
Figure 4.15. Cumulative Recovery of Aqueous Phase VOCs……….63
Figure 4.17. Cumulative Surfactant Recovery...66
Figure 4.18. Effluent Surfactant Concentrations...67
Figure 4.19. Effluent PCE Concentrations...67
Figure 4.20. Pre-Surfactant Flush MA-80 Depth Profiles...69
Figure 4.21. Surfactant Breakthrough Curves at MLS Well 121...70
Figure 4.22. Surfactant Breakthrough Curves at MLS Well 145...70
Figure 4.23. Surfactant Breakthrough Curves at MLS Well 161...71
Figure 4.24. MA-80 Depth Profiles on 3/7/2006...73
Figure 4.25. Triton X-100 Depth Profiles on 3/7/2006...73
Figure 4.26. MA-80 Depth Profiles on 6/20/2006...75
Figure 4.27. Triton X-100 Depth Profiles on 6/20/2006...75
Figure 5.1. Breakthrough Curves in Dover Sand Column 1...85
Figure 5.2. Breakthrough and Desorption Curves in Dover Sand Column 2...86
Figure 5.3. Surfactant Sorption Isotherms...88
Figure 5.4. Surfactant Sorption Coefficients vs. Aqueous Concentration...89
Figure 5.5. MA-80 Linear Sorption Relationship...89
Figure 5.6. Triton X-100 Freundlich Sorption Relationship...90
Figure 5.7. Triton Oligomer Distribution in Surfactant Solution Prior to Injection...93
LIST OF TABLES
Table 2.1. Summary of Field Experiment Stages...24
Table 3.1. Calibration Standard Components………..…………33
LIST OF ABBREVIATIONS AND SYMBOLS
4-BFB 4-bromofluorobenzene
BBRT Brine barrier remediation technique
Bgal/d Billion gallons per day
0C Degrees Celsius
c-1,2-DCE cis-1,2-dichloroethene
CaBr2 Calcium bromide
CaCl2 Calcium chloride
C/C0 Effluent concentration to influent concentration ratio
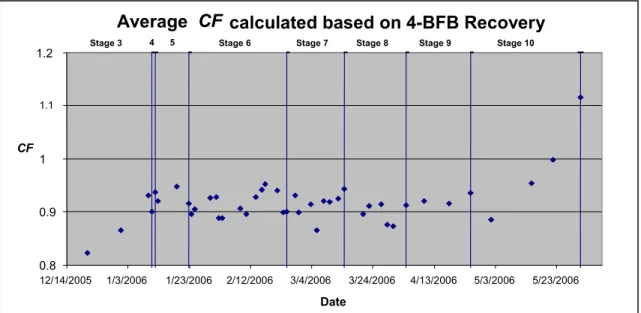
CF Correction factor
CMC Critical micelle concentration
cm Centimeter
cm/s Centimeters per second
CO2 Carbon dioxide
CS Aqueous surfactant concentration (mg/L)
DI Deionized
DNAPL Dense nonaqueous phase liquid
DNTS Dover National Test Site
ECD Electron capture detection
EPA Environmental Protection Agency
FID Flame ionization detection
fOC Organic carbon fraction
g gram
GC Gas chromatography
H2O2 Hydrogen peroxide
HLB Hydrophilic-lipophilic balance
HPLC High performance liquid chromatography
IFT Interfacial tension
IPA Isopropanol
Kd Soil-water partitioning coefficient
KF Freundilich sorption coefficient
kg Kilogram
KH Henry’s constant
KMnO4 Potassium permanganate
KOW Octanol-water partitioning coefficient
KPCE/W PCE-water partitioning coefficient
L Liters
L*atm/g Liters times atmospheres per gram
L/kg Liters per kilogram
LNAPL Light nonaqueous phase liquid
m Freundlich coefficient
m Meter
M Molarity (moles/Liter)
MA-80 Sodium dihexyl sulfosuccinate
MDL Method detection limit
mg Milligram
mg/kg Milligrams per kilogram
mg/L Milligrams per Liter
mL Milliliter
mL/hr Milliliters per hour
mL/min Milliliters per minute
MLS Multi-level Sampler
MnO2(s) Magnesium oxide
NaCl Sodium chloride
NAPL Nonaqueous phase liquid
nm Nanometers
O3 Ozone
PAH Polycyclic aromatic hydrocarbon
PAT Pump and treat
PCE Perchloroethene
PDA Photodiode array
PTFE Polytetrafluoroethylene
PV Pore volume
q sorbed surfactant (mg/kg)
QC Quality control
R2 Correlation coefficient
RPD Relative percent difference
rpm Revolutions per minute
SOM Soil organic matter
SVE Soil vapor extraction
TBA tert-butyl alcohol
TCE Trichloroethene
TCVOC Total chlorinated volatile organic contaminants
Triton X-100 Polyoxyethylene octylphenol
USGS United State Geological Survey
UV Ultraviolet
VC Vinyl chloride
VOA Volatile organic analysis
VOC Volatile organic compound
v/v Volume per volume
µL Microliter
µm Micrometer
Density (kg/L)
1. INTRODUCTION
During the past 50 years, groundwater has become an exceedingly important source
of drinking water for much of the national population. Presently, groundwater supplies
approximately half of the US population with drinking water from domestic and public wells,
and an even higher percentage in rural areas (Alley 1999). In 2000, average daily withdrawal
rates for drinking water supply were 3.5 Bgal/d from domestic wells, and 16 Bgal/d from
public wells, increases of 60% and 100% respectively since 1965 (Hutson 2004). With this
dramatic increase in groundwater consumption, several problematic issues have increased in
magnitude as well. Issues such as aquifer depletion and saltwater intrusion have become
more prevalent due to groundwater consumption trends. Another considerable problem is
groundwater contamination stemming primarily from population increases and
industrialization. Contamination control is an extremely daunting task due to the broad range
of contaminant species that currently exist in natural systems.
There are many important contaminant classifications identified by the United States
Geological Survey (USGS). The major classes include pesticides and excess nutrients,
primarily used in agricultural practices, trace elements such as arsenic, and volatile organic
contaminants (VOCs), which consist of a variety of contaminants including solvents,
hydrocarbons, disinfection byproducts, and fumigants (Zogorski 2006). Each class has a
variety of sources, and cause direct and indirect human health effects on many levels.
The severity of quality depletion depends upon the contaminants present and their respective
concentrations within groundwater systems.
The class of VOCs in particular presents a uniquely hazardous problem for a number
of reasons. One prevalent characteristic of many VOC species is their ability to exist as a
separate phase in groundwater systems due to their low aqueous solubility. These separate
phases are defined as Non-Aqueous Phase Liquids, more commonly known as NAPLs.
NAPLs can be divided into one of two subcategories: LNAPLs, which include gasoline
hydrocarbons, and DNAPLs including polycyclic aromatic hydrocarbons (PAHs) and
chlorinated solvents. LNAPLs by definition are less dense than water, which consequently
causes them to float on top of the water table and remain in the vadose zone (Fitchett 2004).
DNAPLs in contrast have densities lower than that of water, and therefore tend to sink within
the saturated zone until they reach a layer of low permeability, forming DNAPL pools, or are
trapped as disconnected ganglia by capillary forces. The tendency of DNAPLs to migrate
downward prevents the efficient removal of these contaminants from the subsurface.
Historically, tetrachloroethylene or PCE has been utilized for textile finishing, dry
cleaning, and as a degreasing solvent (Zogorski 2006). PCE is currently used in 80 percent of
commercial dry cleaners in the U.S. (McDaniel 2004). Although industrial use of chlorinated
solvents has decreased sharply since the 1970’s due to increasing health concerns (Pankow
and Cherry 1996), PCE and trichloroethylene (TCE) are still among the VOC species posing
the greatest potential concern for groundwater contamination. In 2006, the USGS reported
PCE as the second most common VOC behind chloroform found in public and domestic
wells in the U.S., and 75 percent of the wells exhibiting VOC concentrations exceeding MCL
PCE were found in over 50 percent of the national priority sites for groundwater identified by
the U.S. Environmental Protection Agency (EPA) (McDaniel 2004).
Once PCE enters the subsurface, it tends to be very recalcitrant. If it exists as a
separate phase, it is extremely difficult to remove. Free-phase PCE exhibits a high interfacial
tension with water, thus resisting mobilization from groundwater advection alone. At the
same time, if mobilization does occur, the high density of PCE ( = 1.62 kg/L) most likely
results in downward migration of the NAPL phase into previously uncontaminated areas.
Another characteristic contributing to the ability of PCE to remain in the subsurface is its low
aqueous solubility, which is commonly reported between 150 mg/L and 240 mg/L (CRC
2006). Solubilities in this range present a two-sided dilemma. First of all, PCE aqueous
solubility is orders of magnitude higher than the maximum contaminant level (MCL) of
0.005 mg/L set by the EPA, so groundwater systems containing PCE routinely exceed
maximum contaminant levels (Sabatini 2000). On the contrary, because the aqueous
solubility is thousands of times less than the density of free-phase PCE, NAPL phase does
not solubilize quickly into water, and typical plume life is expected to be on the order of
hundreds or thousands of years in the absence of reactions (Heron 2005).
The problems associated with PCE contamination in the subsurface convey the need
for remediation techniques in order to reclaim contaminated aquifers as useable groundwater
sources. The pump and treat (PAT) strategy was the first method employed as an aquifer
remediation technique for NAPL contaminated systems, and until the early 1990’s, was the
prescribed treatment at approximately two thirds of existing Superfund sites (Travis and Doty
1990). The basic theory behind PAT strategy involves pumping clean water into a
collecting the contaminated water for treatment. However, this technique has proven to be
very inefficient for attaining drinking water standards in a reasonable amount of time.
Several reasons have been suggested as to why PAT methods have functioned so
poorly. In addition to the low aqueous solubility of PCE, flowing water may not reach all
contaminated areas. Any dissolved or free phase NAPL located in regions of low hydraulic
conductivity are frequently inaccessible to advective flow due to the formation of preferential
flow paths that bypass regions of low permeability. It is known that the permeability of
unsaturated soils can vary by many orders of magnitude over a spatial scale of centimeters or
meters, so preferential flow is a common occurrence in groundwater systems (Buettner &
Daily 1995). Solvents such as PCE are also capable of extensive sorption to soils in some
situations depending primarily upon the organic content of the soil. Furthermore, the process
of PCE interphase exchange between either soils or NAPL and the aqueous phase can be rate
limited, which slows PCE removal even more (Rabideau 1994). Consequently, in PAT field
implementations, the process generally reaches a point where system effluent is nearly
constant and well below PCE solubility, but still well above MCL levels. This characteristic
of the PAT technique renders it a very inefficient remediation technique. Attempts have been
made to improve upon PAT such as intermittent or “pulsed” pumping to allow equilibration
between phases and alleviate rate limitations. Still, these enhancements have proven unable
to decrease remediation times in systems with high spatial heterogeneity, which are often
present in natural systems (Rabideau 1994).
The shortcomings of PAT technology have revealed the need to further develop
enhanced remediation techniques in order to effectively remove PCE and other organic
addressing the issues that cause the PAT method to be inefficient. For example, enhancing
the physical characteristics of PCE by increasing aqueous solubility or decreasing the
interfacial tension between PCE and the aqueous phase would potentially increase PCE
removal from groundwater systems. PCE can also be chemically oxidized or reduced under
certain conditions to form harmless end products such as CO2or ethylene. Several techniques
2. BACKGROUND
This section will provide brief introductions for existing remediation techniques used
for PCE removal from the subsurface, including a novel technology known as the Brine
Barrier Remediation Technique or BBRT. The work detailed herein revolves around the
implementation of BBRT in a confined field setting, and thus the open questions regarding
utilization of this remedial technique will be highlighted as well. BBRT issues include the
complexity of such a system as well as the analytical obstacles that must be overcome in
order to quantify overall contaminant removal in this particular implementation of BBRT.
2.1. Soil Vapor Extraction (SVE)
In the process of SVE, air is circulated through the soil via an applied vacuum
(Buettner & Daily 1995), and this technique has proven to be a reliable, safe, and robust
physical treatment (Thomson 2000). As air pushes through the system, compounds volatilize
into the advective air flow and are removed from the system. In this manner, SVE capitalizes
on the high vapor pressures exhibited by volatile species such as chlorinated solvents.
Experimental results suggest that mass transfer into the air phase is not a major limitation in
SVE due to the fact that pulsed pumping SVE strategies to allow equilibration rarely result in
higher removal rates (Farhan 2002). Nevertheless, there are exceptions as mass transfer rates
are largely dependent upon the system (Thomson 2000). Another potential benefit of SVE is
that it adds oxygen to the system, which can enhance oxidation and aerobic degradation for
Although SVE has greater removal potential for PCE than water flushing, (Thomson,
2000 describes a study succeeding in 63% PCE removal), removal rates over time often
follow a pattern analogous to the PAT strategy previously described. Contaminant removal is
close to ideal initially with effluent air concentrations typically on the order of air saturation
levels. This is followed by a rapid decline in removal rate, which ultimately exhibits an
asymptotic tailing to some residual saturation above MCL limits, which often has a direct
relationship to system heterogeneity (Thomson 2000). For this reason, successful SVE
implementation has been limited to soil systems with relatively high and uniform hydraulic
conductivities between 10-2 and 10-3 cm/s (Farhan 2002). However, natural systems often contain layers or lenses possessing much lower hydraulic conductivities than this. A further
limitation of vapor extraction methods is that they are only operative in the unsaturated zone,
meaning the system has to be fully drained in order to reach the entire contaminant zone.
This is a problem because even when fully drained, low permeability regions typically have
very high water residual saturations, which can severely restrict regions accessible by SVE.
2.2. Thermal Remediation Techniques
Another common alternative to PAT involves heating the contaminated system
through addition of hot water, steam, or soil heating using heat blankets, thermal wells, or
low frequency electrical heating (Heron 1998), with steam injection and electrical resistance
heating being the most commonly employed techniques (McGuire 2006). By increasing the
temperature in groundwater systems, several physical forces responsible for NAPL
entrapment are lessened, and NAPL removal becomes more efficient. Aqueous solubility,
soil desorption, vapor pressure, and diffusion coefficients all increase with elevated
1998, 2005). Furthermore, elevated temperatures increase mass transfer rates from the NAPL
phase due to decreases in interfacial tensions, which results in a larger interfacial area for
mass transfer into the aqueous phase to occur (Imhoff 1997). Overall, thermal strategies to
date have been very effective for DNAPL removal, showing median reductions of 95% or
greater at DNAPL contaminated sites (McGuire 2006).
2.2.1. Hot Water and Steam Injection
Hot water flooding historically has been used in the petroleum industry to improve
recoveries of viscous oils by enhancing oil mobility (Imhoff 1996). This remediation
technique is typically designed to mobilize NAPL for systems with high free-phase residual
saturations (Davis 1993), but can be expected to increase NAPL solubilization rates as well
as aqueous solubility. However, it has been reported that over the temperature range of 20 to
80 0C, the PCE/aqueous interfacial tension decreases by only 7%, which at typical PCE residual saturations should not be sufficient to induce substantial PCE mobilization (Imhoff
1996). Naturally cool groundwater temperatures (Freeze & Cherry 1979, Imhoff 1996) may
also inhibit PCE removal from hot water or steam injection in terms of overall cost.
Therefore, the most effective method of PCE removal from hot water flooding is
likely through solubilization. Unfortunately, this technique has not demonstrated the ability
to dramatically increase aqueous solubility at elevated temperatures either. Stephenson
(1992) reports a PCE aqueous solubility of 520 mg/L at 92 0C. This represents just above a 100% increase from water at 20 0C, and other chlorinated solvents such as TCE and cis-1,2-dichloroethylene (c-1,2-DCE) increase solubility between 50% and 100% over the same
about 400% in controlled laboratory experiments (Imhoff 1997), yet this is still not a
dramatic improvement over conventional PAT methods.
The use of steam injection is somewhat similar to hot water flushing, but has greater
overall enhancement potential. First of all, steam injection can potentially raise the system
temperature more than hot water, which will further enhance the physical conditions needed
for PCE removal (Heron 2005). In this technique, NAPL contaminants are displaced at the
steam front by vaporization due to increased vapor pressures (Schmidt 2002). The vapor
pressure increases markedly as steam injection temperature increases, between 10- and
30-fold for most VOC species when the temperature is increased from 20 0C to 100 0C (Udell 1996). Also, if temperatures of 100 0C are exceeded, thermal destruction of contaminants may occur (McGuire 2006). In past studies, steam injection has removed between 85% and
99% of total chlorinated solvents (She and Sleep 1999, Heron 2005).
Nonetheless, there still exist several problems with steam injection. Probably the most
severe drawback of steam injection is that it may lead to downward migration of DNAPL
pools (Schmidt 2002). As the steam front comes into contact with DNAPL residual, it is
volatilized and later condenses at the steam front as the steam cools (Hunt 1988). DNAPL
continues to collect and move with the steam front in this manner, and once a sufficient
amount of DNAPL has condensed at the steam front, it can potentially migrate vertically due
to gravitational forces. Attempts to negate vertical migration such as injecting steam below
the contaminated area and injecting a mixture of steam and air have been suggested, but have
not been extensively explored at this point (Schmidt 2002). The cost of steam techniques can
Although employing hot water or steam as the flushing fluid is preferred over classic
PAT methods for increasing mobilization, mass transfer rates, and solubility of DNAPLs,
many serious problems persist. Though to varying extents, soil systems with large spatial
heterogeneities pose problems for both hot water and steam flushing. In heterogeneous
systems, the flushing fluid continues to form preferential flow paths around low conductivity
regions, and as a result NAPL located in these regions will remain mostly unaffected from
recovery attempts (Buettner and Daily 1995, Heron 1998). This limitation is a major
drawback as VOCs will concentrate and remain in low permeability areas due to increased
capillary tension and soil adsorption (Buettner and Daily 1995).
2.2.2. Soil Heating
In this remediation scenario, the entire system is heated by electrical or resistance
heating. While injection of thermally enhanced air or water only reaches relatively permeable
subsurface regions, resistance heating over the entire system may be able to more efficiently
affect the entire zone (Buettner and Daily 1995, Heron 1998, Heron 2005). In addition to
heating the system more evenly giving way to more uniform contaminant removal, resistance
heating has further advantages over heating via injected fluids. Whereas injected fluids such
as hot water and steam flow only through high permeability regions, potentially bypassing
large contaminant residuals in heterogeneous zones, electric current is more efficiently
conducted through low permeability soils because of higher water and clay content
contributing to a higher overall charge density (Buettner and Daily 1995, Heron 1998). This
results in a pressure gradient theoretically driving contaminant from clays and fines into
(Buettner and Daily 1995). Residual water in the unsaturated zone will evaporate more
quickly as well, leading to more NAPL phase exposure to the advecting fluid.
Resistance heating has been successfully employed prior to SVE or steam treatment
in past studies, and such studies have demonstrated the ability to remove NAPL contaminants
very effectively. Field studies combining resistance heating and SVE or steam treatment
frequently exceed 95% removal of DNAPLs (McGuire 2006), and in one instance, an 88%
increase in removal was observed when electrical heating was applied to an ongoing SVE
study (Heron 2005). This example stresses the potential advantages of adding electrical
heating to previously existing remediation techniques. A major concern with soil heating is
cost, but this may be offset by decreases in waste generated and total remediation times
(Heron 1998).
2.3. In-situ Oxidation
VOCs such as benzene, xylene, toluene as well as chlorinated solvents PCE, TCE,
and vinyl chloride (VC) undergo oxidation to carboxylic acids and eventually to CO2
(Amarante 2000). Although it is naturally a slow process, oxidation can be catalyzed by the
addition of oxidizing agents such as Fenton’s reagent, O3, H2O2, or KMnO4to the system
(Schnarr 1998, Amarante 2000, MacKinnon 2002, McGuire 2006). There are several benefits
to remediation through oxidation partially because contaminants are destroyed in-situ, so no
extraction or excavation is required with the exception of monitoring. Moreover, once parent
compounds (PCE or TCE) undergo oxidation, the intermediates formed degrade very quickly
to carboxylic acids (Yan & Schwartz 2002). Treatment with KMnO4has become the most
popular oxidant for remediation, because it is non-toxic to microorganisms and does not form
promise at several field sites. A compilation of field study results reported that sites where
chemical oxidation was utilized have median reduction rates of 88% for all DNAPLs, and
72% for chlorinated solvents in particular (McGuire 2006). In addition, recovery is often
greater than 90% for sites where large DNAPL pools are absent (Amarante 2000,
MacKinnon 2006).
Given this apparent success, as of yet there is no documentation of oxidation
techniques yielding greater than 50% recovery in heavily contaminated sites containing free
phase DNAPL. Slow dissolution into the aqueous phase and areas of low permeability hinder
oxidizing agents from contacting large amounts of free phase contaminant (Schnarr 1998).
Also, the deposition of MnO2(s), a product of oxidation reactions, can decrease the system
hydraulic conductivity by a factor of five, thereby decreasing contaminant removal efficiency
as well (MacKinnon 2002). Another problem especially apparent within oxidation
implementations is rebound or increases in contaminant concentrations that are often
observed after studies are complete (McGuire 2006). The exact reason for this phenomenon
is unknown, but is possibly caused by the inhibition of ambient microbial activity stemming
from residual oxidant or organic carbon depletion (McGuire 2006). This decrease in organic
carbon would result in release of previously sorbed contaminant, and in the process would
increase aqueous contaminant concentrations. Oxidative removal for PCE in particular is a
very slow process even in laboratory experiments. The chemical structure of PCE slows
oxidation reaction rates due to electron withdrawing chlorine atoms that sterically hinder the
formation of intermediate species, and thus PCE oxidation is ten times slower than for TCE
2.4. In-Situ Bioremediation
Bioremediation of chlorinated solvents is accomplished through microbial mediated
reductive dehalogenation. This process reduces chlorinated solvents in a stepwise manner
from PCE to TCE to c-1,2-DCE to vinyl chloride, and finally to ethylene. Natural attenuation
of chlorinated solvents can be enhanced by the addition of dehalogenating microorganism
strains, which is known as bioaugmentation (Adamson 2003, 2004), or through
supplementation of the subsurface with excess nutrients and electron donors such as acetate,
lactate, or pyruvate that speed up the dehalogenation process (Cupples 2004, Adamson 2003,
Devlin 2004). Enhanced bioremediation is an appealing technology in that contaminant
removal is completed by a natural process, which is relatively inexpensive to implement
(Devlin 2004). Besides ultimately reducing PCE and TCE to ethylene, a harmless end
product, each successive reduction results in a less chlorinated product, which exhibits
increased aqueous solubility and mass transfer rates over its predecessor (Chu 2004, Cope &
Hughes 2001). Thus, flushing techniques coupled with bioremediation can more effectively
remove chlorinated compounds through solubilization. McGuire (2006) reports 62% removal
of total chlorinated VOCs (TCVOCs) among 26 cleanup sites employing enhanced
bioremediation techniques, and supplementary studies have claimed up to 95% removal of
total chlorinated hydrocarbons (Witt 2002). Still, bioremediation has been chiefly used in the
past for removal of dissolved phase contaminants (McGuire 2006).
At this point, it is unclear how well bioremediation works on areas where large
DNAPL pools are present. PCE and TCE are only accessible to dehalogenating organisms in
transfer processes when DNAPL phase is present. Furthermore, when large mass fractions of
PCE or TCE originally exist, c-1,2-DCE and VC concentrations persist for long periods of
time, because dehalogenating microbes favorably breakdown PCE and TCE over c-1,2-DCE
and VC (Adamson 2004). This accumulation of c-1,2-DCE and VC at remediation sites is not
desirable. Although c-1,2-DCE and VC have greater aqueous solubilities than either PCE or
TCE, VC is a known human carcinogen with the lowest MCL levels (0.001 mg/L) of all
chlorinated solvents (Cupples 2004). For this reason, some field strategies periodically
switch between anaerobic conditions, needed for PCE degradation, and aerobic conditions to
stimulate aerobic degradation of c-1,2-DCE and VC (Witt 2002). Bioremediation is also a
very slow process relative to other strategies as enhanced bioremediation sites have an
average duration of nearly two years (McGuire 2006). More importantly, remediation below
MCL levels is highly unlikely through enhanced bioremediation. Dechlorination can produce
significant amounts of hydrochloric acid, greatly reducing system pH levels, which can be
detrimental to dehalogenating microbial communities (Adamson 2004).
2.5. Cosolvent Flushing
Cosolvent flushing with short chain alcohols that are completely miscible with water
is another groundwater remediation option (Ladaa 2001). Cosolvent addition results in PCE
solubility increases as well as the potential for free-phase mobilization from interfacial
tension reductions. PCE solubility increases approximately 40 times in a 60% methanol
solution over ambient aqueous concentrations with a parallel decrease in interfacial tension
by a factor of four (Imhoff 1995). Thus, using cosolvents carries with it the unwanted
potential of downward DNAPL migration and breakthrough into previously uncontaminated
confinement layers did not occur experimentally at cosolvent concentrations of less than 60%
even with very small variations in hydraulic conductivity (Van Valkenburg 2002). Moreover,
past field experiments using 95% ethanol as the flushing fluid have found no evidence that
any such migration occurred (Jawitz 2000, Brooks 2004). The use of alcohols will also
increase subsurface drainage efficiency if desired for subsequent vapor extraction techniques.
It is not clear whether cosolvents that partition favorably into the DNAPL phase such
as tert-butyl alcohol (TBA) will help or hinder the remediation process. Though solubilities
show greater increases when TBA is added to systems in comparison to other commonly
used cosolvents, it has been hypothesized that TBA addition will both increase and decrease
downward mobility of DNAPLs. Because TBA partitions into PCE, the density will
decrease, and thus gravitational migration may be hindered (Van Valkenburg 2002).
However, it is also suggested that interfacial tension decreases from TBA will cause greater
downward mobility (Imhoff 1995).
In field studies using cosolvent flushing, PCE recovery was less than 70% for all
cases, and removal efficiencies were only 1-2 orders of magnitude better than PAT methods
(Brooks 2004). While this shows improvement over conventional methods, cosolvent
flushing with these results will not attain MCL levels for PCE within realistic temporal and
economic constraints. Spatial heterogeneities will not only result in preferential flows that
bypass NAPL in areas of low permeability, but they can also enhance downward mobility
once cosolvent is added (Imhoff 1995). Because contaminant bypass occurs, and the fact that
PCE solubilities do not increase sharply until the aqueous phase contains 10-20% cosolvent
by weight in most cases (Ladaa 2001), large amounts of cosolvent must be used for each
expensive remediation methods in existence (Brooks 2004). Waste management can also be a
problem due to increases in Henry’s constants, which causes air stripping of contaminants
from effluent waste to be very inefficient for removing chlorinated solvents (Ladaa 2001).
2.6. Surfactant Flushing
Surfactants are a group of compounds with both hydrophilic (polar) and hydrophobic
(apolar) regions, making them soluble in a variety of media. This allows surfactants to form
micelles or aggregations of surfactant molecules with similar polar and apolar orientation
(Sabatini 2000). In other words, surfactant molecules form spheres with a polar or non-polar
exterior and the opposite type of interior depending upon the media. Micelles can only be
formed when surfactant concentrations exceed a threshold known as the critical micelle
concentration (CMC). Micelles in the presence of PCE or other free-phase NAPLs can result
in trapping large amounts of NAPL in the hydrophobic center of the aggregate, while
remaining water soluble due to the hydrophilic exterior (Taylor 2001, Sharmin 2006). Thus,
surfactants essentially solubilize large amounts of contaminant at concentrations much lower
than required for cosolvents. For example, in a surfactant screen test, PCE solubility was
increased up to 700,000 mg/L for some surfactant solutions, which is greater than a three
order magnitude increase over aqueous solubility (Childs 2004). It should be noted however
that aqueous phase supersolubilized with PCE can increase substantially in density, possibly
inducing the remedial fluid to sink within the saturated zone (Taylor 2001).
Surfactant mixtures can be customized to enhance solubility, mobilization, or a
number of other variables for a particular system (Acosta 2002, Jayanti 2002). Based on what
the desired process is, the hydrophilic-lipophilic balance (HLB), which is a measure of which
liquids, can be altered to enhance the desired process by electrolyte or salt addition. Micelles
with a hydrophilic exterior, known as Winsor Type I solutions, form in low electrolyte
concentrations, and micelles with hydrophobic exteriors, known as Winsor Type II solutions,
form when high electrolyte concentrations are present. Balance between the two phases will
result in the greatest interfacial tension reductions, and thus offer the greatest potential for
mobilization (Childs 2006). Solutions formed in this balance are known as Winsor Type III
solutions, which result in mixed micelle systems of both orientations. For illustration, the
Winsor phase diagram is shown in Figure 2.1 below.
Figure 2.1: Winsor Diagram Courtesy of Childs (2006). Oil or Nonaqueous Phase is “o”, Water or Aqueous Phase is w, and Mixed Phase is “m”.
In addition to achieving minimal IFT’s, Winsor Type III solutions also tend to form
microemulsion phases with very high contaminant and surfactant concentrations. Surfactant
and electrolyte solutions can be efficient at mobilizing DNAPL pools, yet as discussed
before, this may not be desirable (Taylor 2001).
In cases where solubilization without mobilization is warranted, the HLB can be
and NAPL is effectively solubilized into the aqueous phase (Dwarakanath 2000). By
operating near the Type I/Type III interface shown as the solid line to the left in Figure 2.1,
high contaminant solubilities are achieved while minimizing vertical migration potential
(Childs 2004). Cosolvents are frequently added to surfactant mixtures as well to prohibit gel
formation in the subsurface, reduce fluid viscosity, and lower equilibration times with the
contaminant although they also reduce overall PCE solubilities (Dwarakanath 2000). With so
many additives in surfactant solutions, the successful utilization of these remediation
strategies requires careful balancing of the physicochemical fluid properties.
The surfactant solution selected for a given application must also be carefully selected
based upon the system, for surfactant strategies often fail where full subsurface
characterization is not completed prior to implementation (Abriola 2005). There exist
numerous surfactant families to choose from for remediation, which will respond to natural
systems in a variety of ways. Generally, surfactants are divided into three main categories:
anionic, cationic, and nonionic, with anionic and nonionic the most popular for groundwater
remediation (West and Harwell 1992). Both of these categories have advantages and
disadvantages, and either could perform better in a certain situation. Anionic surfactants do
not readily sorb to most soils, do not form gels, and have very quick solubilization rates
(Childs 2004). However, anionics also tend to form precipitates in many field settings
(Childs 2004, Dwarakanath 2000). Nonionics on the other hand show high increases in PCE
solubilities and have not been shown to form precipitates. However, they are more likely to
be considered toxic, preferentially sorb to organic soil matter, and can partition favorably
form synergistic mixtures that relax negative aspects found within single surfactant solutions
(West and Harwell 1992).
The major problems for surfactant use are regrettably the same characteristics that
make them appealing. Though there are several means of improving surfactant performance
through adding cations, cosolvents, or other surfactants, each component adds more
complexity to the system. This translates to more time and money expended to discover the
best mixture for a particular system, which may perform poorly for other contaminated sites.
For this reason, surfactant techniques are among the most expensive remedial techniques to
implement (McGuire 2006). The complexity of surfactant mixtures is conveyed in the wide
range of success reported in field studies. Past attempts have yielded recoveries from over
99% in relatively homogeneous systems to very small recoveries in others (Abriola 2005).
Furthermore, by injecting surfactants into a natural system, surfactant recovery as well as the
original contaminant becomes an issue (Okuda 1996). Recent studies have shown surfactant
recovery over 90% (Ramsburg 2004a, Childs 2006), but surfactants showing the potential for
extensive sorption should be studied in depth before utilization in the field.
2.7. Brine Barrier Remediation Techniques (BBRT)
BBRT is a novel technique just recently developed exhibiting great potential for
removing large amounts of DNAPL residual. This technology calls for the initial injection of
a high density salt solution into the system exceeding the density of the DNAPL to be
removed (Miller 2000). Theoretically, this brine solution then works as a barrier at the
bottom of aquifers halting downward migration caused by mobilization (Miller 2000, Hill
2001, Johnson 2004). After a brine layer is established, surfactant flushing with a solution
reaches the brine where DNAPL will remain due to buoyancy forces (Johnson 2004).
Because location of the brine layer can be monitored by density measurements, the DNAPL
pools formed should be easier to locate and remove from the system. This can be a very
attractive situation in that most of the DNAPL removed will exist in a very concentrated
form, and thus removal and waste treatment increases in efficiency.
In this case, surfactant solutions that reduce IFT’s to a minimum are preferred as they
are most likely to produce DNAPL mobilization. Focusing on mobilization eliminates
problems associated with mass transfer limited solubilization, which decreases remediation
times and flushing volumes (Hill 2001). Past studies have shown that a one pore volume
(PV) flush of a highly mobilizing surfactant solution results in greater than 90% PCE
removal from experimental heterogeneous systems (Miller 2000). These solutions also assist
in higher water desaturation of the system, which is an ideal condition for SVE techniques to
remove any remaining PCE after surfactant flushing (Miller 2000). In a documented
experiment utilizing such a strategy, greater than 99% of the initial PCE residual was
removed from the system after SVE was completed (Johnson 2004). BBRT strategies have
the potential to become an efficient contaminant removal technique for subsurface systems,
though much experimental work remains to answer open questions.
2.8. BBRT Open Issues
While BBRT strategies have shown promise in small-scale experimental settings,
there are several open issues that must be attended to before BBRT can be considered a
viable option for groundwater remediation. The addition of high brine and surfactant
concentrations can lead to very complex interactions within the contaminated system. For
surfactants, which can cause anionic surfactant precipitation and nonionic surfactant
partitioning into free-phase PCE. Although interactions among brine, surfactant, and PCE
have been studied extensively in lab settings, it is difficult to test for all component
combinations that may arise during a large-scale remedial process. Due to the complexities
created, brine and surfactant removal efficiency after remediation is complete are also largely
unknown (Johnson 2004). In addition, further unexpected issues may arise due to ambient
chemical and biological communities as well as system heterogeneity in field-scale
implementations.
Another open question involves what analytical methods can be appropriately
employed for such a system. The complexities found in BBRT systems eliminate most
conventional analytical methods for VOCs from consideration. Furthermore, depending on
the surfactant flushing solution used for a particular situation, the applicability of analytical
methods could vary for each separate BBRT implementation.
2.8.1. Field Scale Issues
Though BBRT has proven very effective in one-, two-, and three-dimensional
experiments (Miller 2000, Hill 2001, Johnson 2004), there is still the necessity for field
experiments to verify that such a strategy will be successful in contaminated natural systems.
Laboratory experiments are an important and necessary step in the formulation of
groundwater remediation strategies as they are needed initially to test the technology in
question under various controlled conditions. However, it is impossible to recreate a virtual
field setting complete with representative soil heterogeneities at the micro- and macro-scales,
microbial communities, and naturally occurring physical and chemical components. Natural
complicated to completely characterize any natural system. Experiments including only brine
and surfactant in a PCE contaminated cell with homogeneous packing are very expensive and
time consuming (Miller 2000), and more combinations or complexities will increase the time
and costs involved. The next logical step in acceptance of BBRT as a practical remediation
alternative is examination of its performance in a field setting. Consequently, our lab group
embarked on a field-scale implementation of BBRT at Dover National Test Site (DNTS) in
Dover, DE from December, 2005 to June, 2006.
Site Description. DNTS covers approximately 3.5 acres of a grassy field with minor
topographic undulations of less than 2 feet. The Columbia Formation contains an
underground aquifer that varies in depth from 36-47 feet (RETEC 2005). It is comprised of
fine-to-medium sands with occasional discontinuous clay and silt lenses exhibiting very low
organic content of 0.025% (Witt 2002). The depth to the water table of the Columbia Aquifer
is approximately 24-26 feet below ground surface. Pumping tests have yielded a vertically
averaged hydraulic conductivity of 8.5 ft/day, vertically averaged horizontal transmissivity of
129 ft2/day, specific yield of 0.27, and storativity of 0.0003 ft-1 (RETEC 2005). Underlying the Columbia Formation is the Calvert Formation, which consists of gray, firm, dense marine
clays. This confining layer is approximately 20 feet thick and has a hydraulic conductivity of
8.4*10-3 ft/day (Childs 2006). Under the Calvert Formation is the locally confined Fredrica Aquifer. Analyses indicate the soils range from slightly to moderately acidic, ranging in pH
from 4.9 to 6.4. Microbial evidence of anaerobic metabolism and denitrifying enzyme
activity were low (RETEC 2005).
There are three confined test cells on site at DNTS that have been used to conduct
been used to conduct three prior studies. These studies included a cosolvent study, a
surfactant study using sodium dihexyl sulfosuccinate (MA-80), and a complex sugar flushing
strategy using cyclodextrin. As of June, 2001, approximately 35.6 L of PCE remained in Test
Cell 3 (RETEC 2005). Based on the recovery of cyclodextrin from the prior study,
cyclodextrin concentration was approximately 35,000 mg/L at the end of that study (Tick
2003). Low levels of MA-80 surfactant and several alcohols used in PCE tracer tests were
present as well.
Field Experiment Schedule. The successful implementation of the BBRT in a field setting
required several steps during implementation. This was due to the fact that addition of PCE,
brine, and surfactant must be administered to the system in a stepwise manner to attain the
desired results. Additional steps were also required because several different contaminant
removal methods were employed as well. With each successive species addition, the system
increased in complexity, which required intensive matrix sampling during all stages of the
study in order to monitor the behavior of all analytes within the system.
Stages 1-3 were primarily for pre-characterization of the test cell to quantify the
distribution of PCE, degradation products, and MA-80 initially present as well as the ambient
draining characteristics of the subsurface. Stage 4 involved the delivery of PCE to the cell,
resulting in a free-phase PCE residual of approximately 100 L. The PCE was further
distributed throughout the cell during Stage 5 in which the water table was raised by
pumping water back into the system. The brine was injected in Stage 6, and once the brine
barrier was established, Stage 7, surfactant flushing, commenced. The cell was dewatered in
Stage 8 to prepare for free-phase PCE removal in Stage 9 and SVE implementation in Stage
during Stages 11 and 12. The scheduled stages within this field experiment are summarized
in Table 2.1 including the intent of each stage as well as the species of interest present at that
time.
Stage Stage Description Primary Analytes Present
Stage 1 Test Cell Pre-characterization PCE, MA-80, degradation products Stage 2 Preliminary Dewatering and SVE PCE, MA-80, degradation products
Stage 3 Equilibration PCE, MA-80, degradation products
Stage 4 PCE Delivery PCE, MA-80
Stage 5 Water Table Adjustment PCE, MA-80
Stage 6 Brine Injection PCE, brine, MA-80
Stage 7 Surfactant Addition PCE, brine, MA-80, Triton X-100, IPA
Stage 8 Dewatering PCE, brine, MA-80, Triton X-100, IPA
Stage 9 PCE Removal and Final Dewatering PCE, brine, MA-80, Triton X-100, IPA
Stage 10 Brine Flushing and SVE PCE, brine, MA-80, Triton X-100, IPA
Stage 11 TDS Reduction and SVE PCE, brine, MA-80, Triton X-100, IPA
Stage 12 Return to Starting Water Level PCE, brine, MA-80, Triton X-100, IPA
Table 2.1: Summary of Proposed Stages during Field Experiment.
2.8.2. System Complexity Issues
A 52% calcium bromide (CaBr2) solution with a density of 1.7 kg/L was selected to
act as the dense brine barrier in the current experiment. A solution of this density should halt
gravity driven migration of even the densest chlorinated solvent, PCE ( =1.62), if the brine
barrier is successfully established. This is based upon the assumptions that 1) a low lying
aquifer confinement of sufficiently low hydraulic conductivity capable of supporting a dense
brine layer exists, and 2) that soil heterogeneities do not prevent a stable, uniform brine layer
throughout the lower reaches at or near a density of 1.7 kg/L from forming. Failure to
achieve these constraints may result in loss of PCE or brine from the system. The brine has a
very high viscosity, which may increase the time and amount needed to establish a uniform
layer. This high viscosity could cause brine recovery problems at the end of the study as well
(Johnson 2004). Additionally, as brine mixes with groundwater, the aqueous solubility of
this is not likely a major problem for PCE overall removal in this situation as solubilization is
not heavily relied upon as method of removal, the surfactant solubility reduction may lead to
precipitation of anionic surfactants, and increased sorption of nonionics.
After extensive experimentation, the surfactant solution selected consisted of 1.575%
polyoxyethylene octylphenol (Triton X-100) surfactant, 1.425% MA-80 surfactant, 1.4%
calcium chloride (CaCl2), and 3% isopropanol (IPA) by weight. MA-80 is an anionic
surfactant subject to precipitation in the presence of salt. Thus, Triton X-100 was added,
which is a nonionic surfactant that when mixed with MA-80 reduces precipitation. However,
some Triton oligomers are potentially toxic, and partition favorably into free phase PCE
(Sharmin 2006). Calcium chloride was included in the surfactant mixture to shift the resultant
solution to a Winsor Type III, resulting in the highest mobility potential for PCE and the
development of microemulsions with very high PCE and surfactant concentrations. IPA was
added to the solution in order to reduce fluid viscosity and lower equilibration times with
PCE. It remains to be seen if microemulsion phase or free-phase PCE pools can be removed
from natural systems without problems associated with increased viscosity, and this could
pose problems for removal efficiency of both PCE and surfactants. Also, the addition of IPA
decreases overall PCE solubility and adds complexity to the system.
The potential system complexities going into the study include brine, surfactants, and
possibly a significant amount of cyclodextrin from past studies that likely lead to very
complex PCE phase behavior. Each component alone markedly affects PCE solubility and
potentially mobility, which makes it difficult to track contaminant movement during the
complete cell dewatering may be hampered by viscosity increases. These aspects of BBRT
systems as well as residual surfactant may later cause SVE performance to vary drastically.
2.8.3. Analytical Issues
In the experimental system described, the primary analytes of interest are MA-80,
Triton X-100, PCE, and any chlorinated daughter products formed by microbial degradation
including TCE, c-1,2-DCE, and VC. Various analytical methods exist for each species,
though not previously in a system of this complexity. Ideally, a method capable of
quantifying each analyte in a single injection would be adopted. Unfortunately, such a
method does not currently exist. Past methods used to quantify the analytes of interest are
highlighted below, as well as problems that may surface due to the presence of brine,
cyclodextrin, and other system complexities.
PCE and Daughter Products. Chlorinated solvents are typically quantified by gas
chromatography (GC) methods coupled with either flame ionization (FID) or electron
capture detection (ECD). GC-FID and GC-ECD systems are both very commonly used for
PCE detection, and sometimes are used simultaneously (Ramsburg 2004). FID detectors are
more reliable over a wide concentration range for chlorinated solvents, but ECD detectors
give lower detection limits by a factor of approximately 10. The high electron density of
chlorine atoms makes ECD a very attractive method for PCE and daughter products at
concentrations near MCL levels. However, PCE concentrations are several orders of
magnitude above MCL’s at most remediation sites, and hence FID may be the preferred
quantitation method in such situations. In fact, nearly every field study examined that utilized
GC methods used FID detection with a few employing ECD as well (Dwarakanath and Pope
utilized liquid:liquid extraction methods followed by dilution to levels accurately measured
by ECD (Rivett 2005).
Three common method types specified by the EPA exist for detection of PCE and
other VOC species: direct injection, headspace, and purge-and-trap analysis. Direct injection
as the name implies calls for sample injection directly onto the GC column head. This
method is relatively simple and may result in shorter run times. However, because of
incompatibilities with water, direct injection with FID may not work well with aqueous
samples. Headspace analysis methods take advantage of the volatility exhibited by
chlorinated solvents by allowing a known sample volume to equilibrate with a known
volume of headspace in a predetermined amount of time. Once the equilibration time is
complete, a sample is taken from the headspace. Headspace analysis is very popular for field
samples because it avoids the issue of analyte losses due to volatilization, and also removes
many potential interference compounds that are left behind in the aqueous phase. The main
fault of this technique is its reliance upon air-water partitioning or Henry’s constant (KH). If
any species are present in the original aqueous samples that change the partitioning behavior
of the analyte, quantification will be inaccurate. The purge-and-trap technique also samples
the headspace, but the aqueous sample is first purged with air for an amount of time
necessary to transfer essentially all of the analyte into the air phase. Purge-and-trap is an
effective option, although purge times can be very long for PCE analysis in complex systems.
Because of the complicated system created by BBRT methods, conventional GC
analytical methods for chlorinated solvents cannot be used. The wide range of surfactant,
brine, and cyclodextrin concentrations expected throughout this study will cause KHto vary
studies making use of surfactants have evaded this problem by either adding excess
surfactant up to a uniform concentration (Childs 2004), or diluting samples below surfactant
CMC levels, where surfactant presence should not affect PCE partitioning behavior, prior to
analysis (Sabatini 2000). While both methods should work to a degree, each will cause
significant rises in detection limits. The former method increases detection limits because
increased surfactant concentrations result in lower PCE partitioning into the headspace, the
latter because the original sample must be diluted to low concentrations. Additionally, the
proposed experimental system contains two surfactants, which can result in a lower effective
CMC than either surfactant displays alone (West and Harwell 1992), and thus requiring
greater dilutions to attain surfactant CMC levels, which will result in even higher method
detection limits (MDL). Brine presence is expected to complicate PCE partitioning even
further. Aside from the problems evident in headspace analysis, purge-and-trap methods also
suffer interferences caused by surfactant foam or brine precipitation created in samples from
extensive air purging. Finally, GC direct injection was shown experimentally to fail in PCE
quantification due to interference with IPA at high concentrations, which are expected within
the test cell.
High performance liquid chromatography (HPLC) methods with ultraviolet (UV)
detection are occasionally used for chlorinated solvent analysis in field experiments (Field
and Sawyer 2000, Chen 2004). In most instances though, GC methods are preferred over
HPLC because of lower detection limits, and species volatility is more of an issue in liquid
samples. This is reiterated in the fact that an EPA standard method does not exist for
chlorinated solvent analysis via HPLC. Plus, UV maximum sorption for all chlorinated
compounds, hence increasing potential for peak interference. One benefit from HPLC
analysis is its universality. HPLC methods are capable of quantifying a number of various
compounds in a single run if the mobile phase is prepared correctly. Also, unlike GC
headspace methods, HPLC quantification methods are not reliant upon the species KH, which
is nearly impossible to judge in systems containing high concentrations of surfactants and
salts. However, PCE recovery via HPLC may vary due to the presence of brine and
surfactants.
Surfactants. In contrast to chlorinated solvents, both MA-80 and Triton X-100 have very
low volatility, and are not easily quantified by GC headspace methods. As previously
mentioned, surfactants are incompatible with GC purge-and-trap methods due to their
tendency to produce large amounts of foam that will likely interfere with VOC analysis. In
past studies, some form of liquid chromatography is most commonly used for both surfactant
compounds.
Triton molecules contain a phenyl group, so UV detection works well for Triton and
spectrophotometric absorbance measurements will suffice in simple systems (Sharmin 2006).
Triton X-100 quantification in complex systems on the other hand has proven very
burdensome. First of all, Triton X-100 is not a pure compound, and is rather a mixture of
oligomers with ethoxy chains varying in length from 1 to 16 carbon members (Kamiusuki
1999). When run through a C18 adsorption HPLC column, these oligomers will split into
several peaks representing separate oligomers that are very hard to resolve. Complete
oligomer separation has been accomplished with UV and fluorescence detection, but run
times vary between 4 and 5 hours (Kamiusuki 1999), which eliminates high sample
required, Triton X-100 can be eluted as a single peak with a high organic content mobile
phase in less than 5 minutes (Medvedovici 2001). This will increase potential for
interferences, but the advantages gained through run time decrease may outweigh this
setback for some applications.
MA-80 has been quantified in the past by ion exchange chromatography (Childs
2004), titrimetric methods, conductivity measurements (Childs 2006), and HPLC with UV
detection (Field and Sawyer 2000, Ramsburg 2004). Titrimetric methods have numerous
interferences and are very time consuming, so analyzing numerous samples in a complex
system is problematic. Simple conductivity measurements may be reliable in simple systems,
but systems containing large amounts of salt as in our system can cause significant
background interference. Ion exchange chromatography followed by conductivity detection
could work well for field samples as MA-80 is an anionic surfactant. This method is
dependent upon whether MA-80 can be chromatographically separated from other ions.
HPLC using a C18 adsorption column with subsequent PDA detection can be accomplished,
but detection limits are high as the max absorbance of MA-80 is relatively low.
2.9. Overall Objectives
Given the incompatibility of classical analytical methods with the complexities
presented by BBRT methods, the objective of this project is to develop analytical methods
capable of quantifying the primary analytes found in such systems including PCE,
chlorinated daughter products, MA-80, and Triton X-100. The methods developed will be
validated through a series of quality control (QC) checks later discussed, and then utilized to
measure mass balances for PCE, MA-80, and Triton X-100 in order to evaluate contaminant
3. METHODS DEVELOPMENT
3.1. Analytical Method Selection
Taking into account the failure of conventional PCE analytical methods and the fact
that both MA-80 and Triton X-100 have been successfully quantified in the past using HPLC
methods, it was decided to concentrate efforts on developing an HPLC method hopefully
capable of quantifying each analyte simultaneously, while not sacrificing greatly in terms of
detection limits.
In order to minimize analyte losses from volatility that is inevitable when using
HPLC methods, dissolve any free-phase PCE present in samples, and to increase the overall
sample holding time, all samples were diluted by a 1:1 ratio with an appropriate cosolvent.
Following a cosolvent screen study including methanol, ethanol, and IPA, the conclusion was
reached that dilution with IPA results in the smallest percent loss of analyte and the greatest
solubilizing capacity of free-phase PCE. Values from the literature support our finding as
PCE solubility in 50% IPA is nearly 3 and 10 times the reported values for 50% ethanol and
methanol respectively (Ladaa 2001, Imhoff 1995). Volatility should also decrease as PCE
solubility increases. Aside from increasing PCE solubility and decreasing volatility, sample
dilution with IPA minimizes any PCE sorption to the septa of sample vials and the HPLC
vial plastic caps. Cosolvent addition should also minimize the effects of brine and surfactant
on PCE recovery as it should break up any surfactant micelles present and dissolve any
by a factor of two, but the advantages of cosolvent addition will likely outweigh this
drawback.
Despite the fact that all samples were to be diluted 1:1 (v/v) with IPA, recovery losses
from sample preparation and analysis were still expected. For this reason, a surrogate spike
was sought to serve as QC to field samples. Though surrogate spikes have not been well
documented for HPLC methods, it is frequently used as a QC measure for environmental
samples analyzed by GC methods (Foreman 2000, Schumacher 1997, Harlin 1994). In order
to correctly utilize a surrogate spike, a volatile compound not commonly found in the
environment is added to each sample that theoretically mimics losses apparent in chlorinated
solvents due to sample prep and instrument drift during analysis. The percent recovery of the
known surrogate concentration can then be used to calculate a correction factor, which in
turn can be used to predict the original sample concentration of each chlorinated compound.
The surrogate 4-bromofluorobenzene (4-BFB) was selected because it has been identified as
a potential quantitation reference compound for chlorinated solvents in that it exhibits similar
air-water partitioning behavior (Schumacher 1997). Another surrogate, d-toluene was found
to be a better reference compound for PCE in particular, but this compound exhibited high
detection limits and toluene currently exists at low concentrations in Test Cell #3 that could
cause background interference. Further experimental work showed that 4-BFB was
detectable by HPLC methods, and was separable from all analytes of interest, which makes
4-BFB an appealing surrogate standard for HPLC methods.
3.2. Standards Preparation
Stock standards of 5,000 mg/L were prepared gravimetrically in HPLC grade IPA
supplied by Burdick and Jackson for each volatile species to be analyzed with neat PCE and