Review of Public Personnel Administration 1 –22 © The Author(s) 2016 Reprints and permissions: sagepub.com/journalsPermissions.nav
DOI: 10.1177/0734371X16682815 journals.sagepub.com/home/rop
Article
Goal Setting in Teams:
Goal Clarity and Team
Performance in the Public
Sector
Marieke van der Hoek
1, Sandra Groeneveld
1,
and Ben Kuipers
1Abstract
With the rise of performance management, work in the public sector has changed. An output focus has become more common. Other changes include decentralization and managing organizations more horizontally. Setting performance goals and working in teams exemplify these developments. Despite an extensive literature on goal setting, research on goal setting in teams and empirical studies in public organizations have been largely absent. This study contributes to the fields of public management and teamwork by examining whether and under what team conditions clear goals contribute to team performance in the Dutch public sector. Analyses on survey data (n = 105 teams) show that both goal clarity and self-management positively affect team performance. The effect of goal clarity on team performance is not affected by teamwork though, indicated by insignificant moderation effects of self-management and information elaboration. Suggestions are offered for future research to better understand goal setting in public sector teams.
Keywords
teamwork, goal setting, self-management, performance, public sector
Introduction
A specified reduction of patients on waiting lists, the number of articles published in high-ranked academic journals, a higher percentage of students that graduate within three years, the number of fines police officers give in a year. These are some
1Leiden University, The Netherlands
Corresponding Author:
Marieke van der Hoek, Institute of Public Administration, Leiden University, Turfmarkt 99, 2511 DP Den Haag, The Netherlands.
examples of performance goals that employees in public organizations are confronted with. A focus on results, on output, and consequently on goals, has become more com-mon in the public sector since the 1980s with the rise of performance management (Hood, 1991; Hughes, 2012; Pollitt & Bouckaert, 2011). This management practice, adopted from the private sector with the introduction of New Public Management (NPM), can be defined as “systematic, regular and comprehensive capturing, measure-ment, monitoring and assessment of crucial aspects of organizational and individual performance through explicit targets, standards, performance indicators, measurement and control systems” (Diefenbach, 2009, p. 894). Steering on results, rather than on input or processes, requires determining what good results are through setting clear goals (Diefenbach, 2009; Hood, 1991; Hughes, 2012; Pollitt & Bouckaert, 2011; Rainey, 2014).
Another trend regarding the management of public organizations is the change of traditional hierarchical organizational structures into decentralized specialized units (Hood, 1991; Hughes, 2012; Pollitt & Bouckaert, 2011). Rather than controlling the behavior of public servants through the hierarchy of the traditional bureaucracy, post-bureaucratic structures have gained ground (Groeneveld & Kuipers, 2014). Self-managing teams with their own tasks and responsibilities are becoming more common as an effect (Cohen & Bailey, 1997; Kramer, Thayer, & Salas, 2013; Rainey, 2014; Vashdi, 2013). The combination of steering on output and decentralization has changed the organization of work in the public sector. It is therefore interesting to examine whether or not these developments contribute to public performance.
In the 1990s, Locke and Latham working in the parallel field of organizational psy-chology developed goal setting theory, explaining an individual’s performance by look-ing at the goals that are set. The clearer, more specific, and more challenglook-ing a goal is, the better one performs (Latham & Locke, 2013). Since 1990, many new studies have been undertaken that have supplemented and adapted the original framework (Latham & Locke, 2013; Locke & Latham, 2013). Initially, the theory was used to give individ-ual-level explanations. Given the move toward teamwork, testing the theory in a team context has attracted attention as well, albeit to a minor extent (Kleingeld, Van Mierlo, & Arends, 2011; Kramer et al., 2013). The literature on team performance teaches us that setting goals is important for realizing the desired performance, including effec-tiveness and efficiency (Kramer et al., 2013; West & Anderson, 1996). Furthermore, prior research shows a positive effect of organizing work in teams compared with tra-ditional formats (Delarue, Van Hootegem, Procter, & Burridge, 2008; Kuipers & de Witte, 2005; Richter, Dawson, & West, 2011; West, Brodbeck, & Richter, 2004) although studies of teamwork in public organizations remain scarce (Vashdi, 2013).
motivation that deserves more attention in research in the public sector. Studies by Bronkhorst, Steijn, and Vermeeren (2015), Latham, Borgogni, and Petitta (2008), and Wright (2001, 2004) drew on goal setting theory and confirmed its utility within a public context. However, the team level has been overlooked in these endeavors. The purpose of the present study is then to transpose goal setting theory to the team level in a public context and examine to what extent goal setting in public sector teams affects their performance.
The rest of this article is structured as follows. In the next section, the theoretical framework informing this study will be discussed, including hypotheses and a concep-tual model. This is followed by an elaboration on the data and methods employed in the empirical part of the study. Subsequently, the actual analyses will be presented and conclusions will be drawn. In the final part, limitations are considered and suggestions for future research are proposed.
Goal Setting in Teams
Several definitions of teams are used in the academic literature, in some of which the words for “team,” “group,” “work group,” and “work unit” are used as synonyms while in others these are seen as different things (Delarue et al., 2008). A useful defini-tion reads that a team is
a collection of individuals who are interdependent in their tasks, who share responsibility for outcomes, who see themselves and who are seen by others as an intact social entity embedded in one or more larger social systems (for example, business unit or the corporation), and who manage their relationships across organizational boundaries. (Cohen & Bailey, 1997, p. 241)
This definition clearly distinguishes between teams and groups, for these latter often only temporarily share a common characteristic that is not related to work, goals, and performance, and between teams and work groups, which lack the typical team goals and cooperation and may belong to the traditional bureaucratic work organization (Cheney, Christensen, Zorn, & Ganesh, 2011). The definition also shows the inherent link between teams and goals, the topic of this study.
and are highly appreciated in the light of performance management. Considering the aim of this study, these forms of performance seem therefore relevant to examine.
According to goal setting theory, an employee performs better if the goals that guide work are clear, specific, and challenging rather than vague, ambiguous, and unchallenging (Latham et al., 2008; Latham & Locke, 2013; Rainey & Jung, 2015). The theory proposes that goals activate motivational mechanisms that stimulate per-formance. Four stimulating mechanisms are distinguished: direction, effort, persever-ance, and strategy (Latham & Locke, 1991, 2013). Put simply, if you know better what is expected of you, the course of action you should take to accomplish the objective becomes clearer and the chances that you will reach the goal increase. This again enhances self-efficacy through positive reinforcement and roused commitment, which in turn benefits future effort and performance (Bandura, 2012, 2013; Wright, 2001). In addition, goal clarity supports employees in knowing what is expected of them and what behavior is functional for goal achievement, lowering role ambiguity (Davis & Stazyk, 2015; Pandey & Wright, 2006). If belief in one’s capacities is strong and role ambiguity is low, higher performance can be expected (Bandura, 2013; Davis & Stazyk, 2015; House & Rizzo, 1972; Pandey & Wright, 2006). Research has shown that these mechanisms and the effect of goal setting also apply to the team level in the private and health care sectors (Hoegl & Parboteeah, 2003; West & Anderson, 1996).
However, goal clarity is not a given within the public sector. A body of literature studying goal ambiguity in public organizations (e.g., Chun & Rainey, 2005; Davis & Stazyk, 2015; Jung, 2011; Pandey & Rainey, 2006) connects with goal setting theory. This research has focused on goal clarity and its reverse, goal ambiguity. Goal ambigu-ity is commonly present as public organizations face difficulties in formulating clear and specific goals (Chun & Rainey, 2005; Davis & Stazyk, 2015; Jung, 2011; Pandey & Rainey, 2006; Pandey & Wright, 2006; Rainey, 2014; Rainey & Jung, 2015; Wright, 2004). Such ambiguity exists because public goals often contain multiple subgoals that are linked to various values simultaneously, some of which are hard to capture in numbers (Diefenbach, 2009; Hood, 1991; Pollitt & Bouckaert, 2011; Rainey, 2014; Rainey & Jung, 2015)—think of a goal such as delivering high-quality service to citi-zens in which values of effectiveness, efficiency, fairness, and robustness all play a role. This means that goals can be understood in different ways with diverse interpreta-tions (Chun & Rainey, 2005). The political and institutional environments of public organizations are a stimulating factor in this respect (Chun & Rainey, 2005).
Hypothesis 1 (H1): Teams with a higher level of goal clarity perform better com-pared to teams with lower levels of goal clarity.
Next to this direct positive effect of having clear goals, there are conditions in which this influence could be reinforced, or the negative effects of uncertainty result-ing from goal ambiguity could be attenuated. Studies in the private sector have dis-cerned factors that have a direct positive association with performance or a reinforcing effect on the relationship between goals and performance. Two factors that are of interest for this study on teams in the public sector are the level of self-management, because of its role in organizational developments in the public sector, and information elaboration in cooperation processes, as this concerns a factor that is typical of group dynamics and does not play a role at the individual level (Kramer et al., 2013).
Self-management has appeared to influence performance: previous research in the private sector and health care found evidence that self-managing and (semi-)autono-mous teams often perform better (Campion, Medsker, & Higgs, 1993; Cohen & Bailey, 1997; Delarue et al., 2008; Kuipers & de Witte, 2005; Richter et al., 2011; West et al., 2004), but which is less often the case in project teams (Cohen & Bailey, 1997). Self-management refers to the behavior of employees within the provided autonomy to influence decisions and aspects of work themselves, which can also take place at the team level (Day & Unsworth, 2013; Groeneveld & Kuipers, 2014; Stewart, Courtright, & Manz, 2011). Self-management can be differentiated from the more passive idea of team autonomy, for the latter concerns the existence of possibilities to take decisions rather than actually making those decisions (Groeneveld & Kuipers, 2014). Particularly how work is organized is of interest for self-management (Stewart et al., 2011). Having influence on the division of tasks, being able to decide how and when tasks are exe-cuted to accomplish team goals, and looking for solutions independently are part of self-management (Day & Unsworth, 2013; Groeneveld & Kuipers, 2014). This con-cept then focuses on team members’ behavior to organize their work.
Hypothesis 2 (H2): The positive effect of goal clarity on team performance is amplified if teams have a higher level of self-management, while the negative effect of a lack of goal clarity on team performance is attenuated if teams have a higher level of self-management.
In connection with cooperation processes, research has been conducted on informa-tion elaborainforma-tion. Van Knippenberg, De Dreu, and Homan (2004) define this concept as “the exchange of information and perspectives, individual-level processing of the information and perspectives, the process of feeding back the results of this individual-level processing into the group, and discussion and integration of its implications” (p. 1011). This process of sharing work-related knowledge and viewpoints can stimu-late mutual understanding and cooperation within teams, benefiting performance (Van Ginkel & Van Knippenberg, 2008; Van Knippenberg et al., 2004). Such information is beneficial to performance as it clarifies to team members how their efforts contribute to expectations and team goals, thus reducing role ambiguity. Absence of such infor-mation would then lead to heightened role ambiguity (e.g., House & Rizzo, 1972; Pandey & Wright, 2006; Rizzo, House, & Lirtzman, 1970).
Within teamwork cooperation processes, communication, which also entails infor-mation elaboration, is a very basic element. Communication has been studied by Hoegl and colleagues as part of teamwork quality, a concept referring to “the quality of interactions in teams” (Hoegl & Gemuenden, 2001, p. 436; Hoegl & Parboteeah, 2003). In situations in which much uncertainty exists, teamwork quality has been found to enhance performance by moderating the relationship between goal setting and performance (Hoegl & Parboteeah, 2003). Hoegl and colleagues studied teams working on innovative projects, which face such conditions. Sharing perspectives and experiences could then reduce the negative effect of the uncertainty resulting from complexity (Hoegl & Parboteeah, 2003). Considering the complexity of many public sector problems that have to be solved in dynamic environments, which also makes goal ambiguity more likely, it could be argued that similar mechanisms are at work in public sector teams. A moderating effect of information elaboration as a form of com-munication could then be hypothesized: sharing information and ideas about the team’s work reinforces the underlying motivational mechanisms activated by clear goals and reduces potential role ambiguity because finding effective work strategies to reach the team goals is stimulated. Information elaboration could also help to over-come the uncertainty that accompanies goal ambiguity, or a lack of goal clarity, as this team communication helps to create a shared understanding of the team goals and to focus effort toward goal attainment. Team members could gain a better grip on their work following from this clarification, which helps focus on the road to reach the objectives and improves the chances of accomplishment.
Hypothesis 3 (H3): The positive effect of goal clarity on team performance is
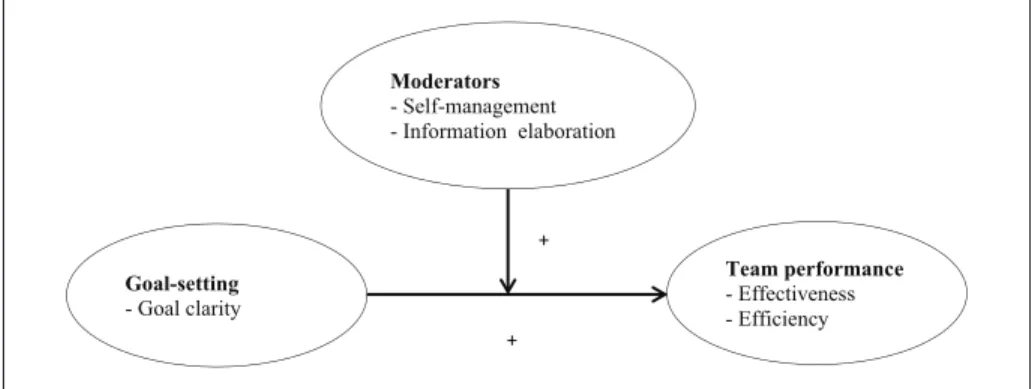
The hypothesized relationships are exhibited in Figure 1.
Method
To test the model and hypotheses, survey data were used that have been collected in a larger research project on high performance teams in the public sector. Data were col-lected in three rounds (between December 2012 and April 2015). An online question-naire was sent to public sector teams in the Netherlands that were selected from a database of InternetSpiegel (part of the Ministry of the Interior), recruitment via Erasmus University Rotterdam, and self-selection resulting from a call on LinkedIn. Both team members and team leaders of 182 teams were asked to participate in the study, resulting in complete data for 157 team leaders (86% response rate) and 1,223 team members (53% response rate) of 157 teams. The response per team differed sub-stantially: between one and 27 team members filled in the questionnaire (M = 7.8,
SD = 4.9). Teams that consisted of less than three team members and/or had less than three team members completing the questionnaire and/or for which the team leader did not participate and/or that were classified as “management teams” were removed from the data set before running the analyses. Five teams had two team leaders and one team had three team leaders. For nine teams, no team leader had completed the question-naire. Only work teams, which deliver services or produce goods, were included because the concept of self-managed teams refers primarily to work teams (Groeneveld & Kuipers, 2014). In addition, some teams were not public but private sector teams, which were also excluded from the analyses. In total, 106 teams with a total of 917 team members were selected for the analysis. Deletion of outliers (see later section) resulted in retention of 914 team members of 105 teams that were analyzed.
Measurement
The measurement of several concepts is based on previously validated scales (see discus-sion per concept). All items were measured on a 5-point Likert-type scale, with answers
+
+ Goal-setting
- Goal clarity
Team performance
- Effectiveness - Efficiency
Moderators
- Self-management - Information elaboration
ranging from 1 (totally disagree), 2 (disagree), 3 (neither disagree nor agree), 4 (agree), to 5 (totally agree). Except for type of team and team size, all concepts were measured with the team member questionnaire. The question about type of team was answered by the team leaders and information about team size was based on administrative data pro-vided by the teams’ organizations (Wave 1) or by the team leaders (Waves 2 and 3).
Principal component analyses (PCAs) and reliability analyses were conducted to summarize the data and to check the validity and inter-item reliability of the measure-ment scales. Components were allowed to correlate (oblimin rotation), for it could be assumed on the basis of theory that the concepts in the analyses are related. Latent components were selected based on Kaiser’s criterion (eigenvalues ≥ 1) and the scree plot (Field, 2013). Decisions of item retention were based on the rotated solution in the pattern matrix, whereby a minimal loading of 0.5 was applied, together with Cronbach’s alpha values and the effect of item deletion. When items were deleted for their weak loading on the expected factor or for a high loading on a different concept than it was theoretically associated with, the analyses were repeated to check whether the compo-nent structure was stable (Field, 2013).
Two PCAs were conducted: one contained all performance items (dependent vari-ables); in the second, all items used to assess the independent and moderating variables were entered to check whether the latent components match the theoretical model. The original seven items of self-management did not perform well in the PCA, causing cross-loadings with the other concepts. Having evaluated the items in terms of substan-tial meaning for the concept as well as in terms of pattern of clustering, two items were dropped from the analysis, resulting in a clear three-factor solution with all items load-ing on the expected component. One item of self-management was retained, despite its loading of only 0.47. This decision was made based on inspection of the reliability analysis, which showed no improvement if this item would be deleted, and on the sub-stantial importance of this item for inclusion in the scale. Individual PCAs for all scales resulted in clear single components with high item loadings well above 0.6.
Based on these analyses, scales were composed on which reliability analyses were performed. All scales have good reliability statistics (all scales have alpha values higher than .7 and four scales even exceed .8). Therefore, it can be concluded that the instrument provides reliable observations (Field, 2013; Neuman, 2004).
Team performance. The dependent variable, team performance as perceived by the team, is measured with two scales: team effectiveness and team efficiency. Team effectiveness refers to the extent to which team goals are attained and is measured with seven items (Cronbach’s α = .88). Team efficiency concerns the use of resources to achieve goals and is based on seven items (Cronbach’s α = .88). The PCA provides a two-factor solution in which each performance variable loads onto its own dimension. The hypothesized relationships are tested on these performance variables separately in the regression analyses.
Anderson and West (1998), Poulton and West (1999), and Tjosvold, Tang, and West (2004): “We have clear team goals,” “In our team we agree on our goals,” and “We closely cooperate to achieve our goals.” This scale has a reliability score of Cron-bach’s α = .88.
Self-management. Self-management was measured with five items regarding enacting team autonomy and evaluates to what extent team members as a team actively shape their own work (Cronbach’s α = .74). The items were derived from previous scales (Campion et al., 1993; Langfred, 2005; Leach, Wall, Rogelberg, & Jackson, 2005; see also Groeneveld & Kuipers, 2014). Example items are “In our team, we divide tasks ourselves” and “Our team decides for itself when others are needed to solve a problem.”
Information elaboration. Information elaboration is based on seven items of the infor-mation elaboration scale of Van Dick, Van Knippenberg, Hägele, Guillaume, and Brodbeck (2008). Two items are “My team members often say things that make me think” and “In my team we often discuss ideas we have about our work.” Cronbach’s α = .88
Control variables. To control for team factors that are not included in the conceptual model, two variables that may influence team performance were used. The first con-trol variable is team size, expressed by the number of team members. This information was not provided by the team members, but by the teams’ organizations as administra-tive data (Wave 1) or by the team leader (Waves 2 and 3). Campion et al. (1993) showed that bigger teams are more effective. In other studies, however, it was found that in larger groups free rider behavior increases, commitment to team goals decreases, expectations regarding performance are lower, and individuals are less cooperative, which can have negative effects on performance (Hollensbe & Guthrie, 2000; Kramer et al., 2013; Seijts & Latham, 2000). Despite this equivocal relationship, team size is deemed a relevant control variable.
Second, the sector in which the team operates is controlled for because the type of organization could affect teamwork and performance (e.g., Richter et al., 2011). This information was added to the data set manually, coded by the researchers based on the organization in which the respondent works. If it was not clear immediately, the Internet was searched to collect information about the organization to inform the cod-ing. Two categories were used: (1) government (national, regional, and local govern-ment as well as the water boards) and (0) non-governgovern-mental public organizations (e.g., health care, education, police).
Data Aggregation of Team Member Data
model; Groeneveld & Kuipers, 2014; Van Mierlo, Vermunt, & Rutte, 2009). Team scores are based on questionnaire responses of team members (n = 914). The mean of the team members’ scores makes the team score for a given variable as the analyses relate to the team level and involve comparisons between teams rather than between team members. Teams are then the unit of analysis, not individual team members.
As the data were collected at the level of the individual employee, these lower level data have to be aggregated. For each scale, intraclass correlations (ICC1 and ICC2) were calculated to test whether aggregation of the data to the team level is justified. ICC1 indicates the variance accounted for by group membership and ICC2 signifies the reliability of the group-means (Bliese, 2000; Van Mierlo et al., 2009). ANOVAs were performed for both independent and dependent variables. To calculate the ICCs, information about group size in the sample is needed. In case of different group sizes, the average group size can be used as an estimate (Bliese, 1998, 2000). Because group sizes differ considerably in the current data set, ranging from three to 45 members, an estimator for group size was calculated (Bliese & Halverson, 1998, p. 168):
Ng=
(
1(
Number of groups−1)
)
× ∑(
Team sizes− ∑(
Team sizes2 ∑Team sizes))
)
=
(
1 105 1(
−)
)
×(
914−(
9890 914)
)
=8 68. .From Table 1, it can be read that all ICC1 values are statistically significant (signifi-cant F-statistic). For example, 17% of variance in a team member’s score on self-management is caused by team membership (F = 3.13, p > .01), whereas 12% of variance in information elaboration is due to team membership (F = 2.47, p > .01). Moreover, the values of ICC2 are fairly reliable for two concepts with scores over .65. Although goal clarity, information elaboration, and effectiveness are just not at the desired level of reliability, aggregation is nevertheless judged to be acceptable as the ICCs are affected by the substantial difference in group sizes, which is caused by bas-ing the calculations on ANOVA (see also Groeneveld & Kuipers, 2014).
Analysis
To test the hypotheses, ordinary least squares (OLS) regression analyses were con-ducted for each performance variable using the aggregated team scores. As the model includes moderators, the independent variable and the moderating variables were grand mean centered. Centering enhances interpretability of the beta coefficients when the used scales do not have a meaningful zero-point, which is the case in the present study (even team size has no meaningful zero-point as a score of 0 would denote a team without members). Interpretation after centering is based on the effect of a change of one unit in X1 on Y at the mean value of X2 (Dalal & Zickar, 2012; Field, 2013). In addition, interaction terms for the moderated relationships were created with the centered variables.
and multicollinearity. Initially, some problems with the normality of residuals were detected. Inspection of potential outliers found one team that could be classified as an extreme case for each performance variable based on standardized residuals (even exceed-ing 3.5). Rerunnexceed-ing the analyses without this case also improves the Kolmogorov– Smirnov tests and Shapiro–Wilk tests for normality of residuals (no longer significant). Having this case removed from the analyses makes the data suitable for further analysis.
Results
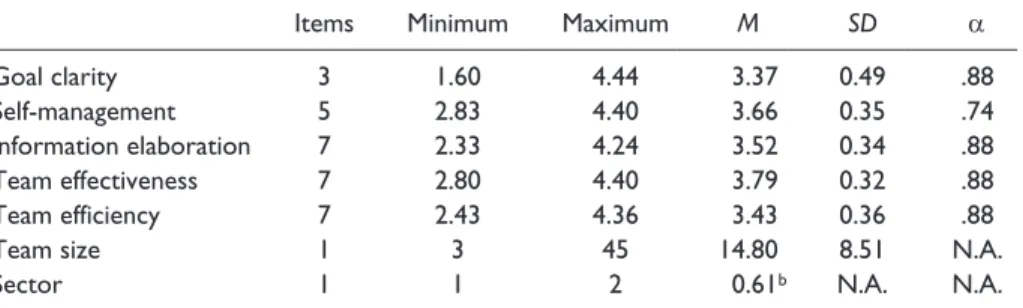
In total, 105 teams were analyzed, of which 99 were permanent teams and six teams were temporary or project-based. The teams operate in different sectors of the public domain. Most teams that were studied were part of local government (35 teams, 33.3%), followed by teams from central government (18 teams, 17.1%). The sample includes five teams (4.8%) from regional government and six teams (5.7%) from water boards. Non-governmental public organizations are also included: 14 teams (13.3%) from education and 10 teams (9.5%) from both security and health care. The remaining seven teams (6.7%) were grouped as “other.” Table 2 shows descriptive statistics for all studied concepts. The mean scores for all variables exceed the theo-retical average (3.0) of a 5-point scale. The teams appear to differ relatively most on goal clarity and information elaboration.
To get a first impression of whether the studied variables are linked, bivariate cor-relations (Pearson’s r) were calculated (Table 3). As was expected, the correlations of the independent and all dependent variables and between moderating and dependent variables are positive and moderate or strong (De Vocht, 2012; Field, 2013). Both control variables correlate significantly with team efficiency (moderate negative cor-relations). Most correlations are below .7, which shows that multicollinearity is likely not a problem (Field, 2013).
The results of the regression analyses are presented below. For each performance variable, four models have been tested: model 1 contains only control variables, in Table 1. Intraclass Correlations (n = 914).
ICC1a ICC2b Fc
Goal clarity .14 .63 2.75*
Self-management .17 .68 3.13*
Information elaboration .12 .60 2.47*
Team effectiveness .14 .64 2.74*
Team efficiency .15 .65 2.86*
Note. ICC = intraclass correlation; MSB = mean square between groups; MSW = mean square within groups; k = (estimated) group size.
aICC1 = (MSB − MSW) / (MSB + (k − 1) × MSW). bICC2 = (MSB − MSW) / MSB.
cF = MSB / MSW; df(within) = 809; df(between) = 104.
Table 3. Bivariate Correlations (n = 105).
(1) (2) (3) (4) (5) (6)
1. Goal clarity
2. Self-management .59**
3. Information elaboration .38** .70**
4. Team effectiveness .63** .71** .50**
5. Team efficiency .61** .69** .56** .78**
6. Team size −.03 −.19 −.07 −.17 −.26**
7. Sector −.06 −.03 −.27** −.07 −.24* .18
*p < .05, two-tailed. **p < .01, two-tailed.
Model 2 goal clarity is added, Model 3 shows the direct effects of the moderating variables, and Model 4 is the full model including the interaction terms. Per step, the adjusted R2, ΔR2, and F-statistics are given. Non-governmental public sector teams are
the reference category for sector. In moderated regression analysis, interpretation of standardized betas is problematic (Dawson, 2014; Whisman & McClelland, 2005). These coefficients are thus not given for Model 4.
Team Effectiveness
Model 1 cannot explain team effectiveness due to an insignificant F-value (Table 4). When goal clarity is added, the explained variance improves significantly (ΔR2 = .387,
ΔF = 67.38, p > .01) to 40.3%. Having clear team goals is found to enhance team effectiveness considerably (β = .40, p < .01), whereas increasing team size reduces effectiveness slightly (β = −.00, p < .05). In Model 3, significantly more variance can Table 2. Number of Items, Minimum, Maximum, Mean, Standard Deviation, and Reliability (n = 105).a
Items Minimum Maximum M SD α
Goal clarity 3 1.60 4.44 3.37 0.49 .88
Self-management 5 2.83 4.40 3.66 0.35 .74
Information elaboration 7 2.33 4.24 3.52 0.34 .88
Team effectiveness 7 2.80 4.40 3.79 0.32 .88
Team efficiency 7 2.43 4.36 3.43 0.36 .88
Team size 1 3 45 14.80 8.51 N.A.
Sector 1 1 2 0.61b N.A. N.A.
aAll values in the table are based on the scores of team members aggregated to the team level, except
for the type of team, which is based on the team leaders’ answers, and team size, for which information is provided by the organizations to which the teams belong or the team leaders.
bAs this variable is measured on a nominal scale, the mean indicates the percentage of teams scoring 1
be explained, amounting to 55.1% (ΔR2 = .152, ΔF = 17.66, p < .01). After adding
self-management and information elaboration to the model to estimate their direct effects, team size turns non-significant. The effect of goal clarity remains statistically significant positive (β = .22, p < .01). In addition, self-management (β = .43, p < .01) makes a significant difference for team effectiveness: higher levels of self-manage-ment stimulate team effectiveness. The full model, including the interaction terms, is not significantly better than Model 3 (ΔR2 = .013, ΔF = 1.54, ns) although the model
itself is statistically significant (F = 19.63, p < .01). Based on this model, it can be concluded that self-management and information elaboration do not moderate the relationship between goal clarity and team effectiveness.
Team Efficiency
As table 5 shows, the first model with just control variables and team efficiency as the dependent variable only explains a small portion of the variance (R2
adjusted = .106).
Team size (β = −.01, p < .01) and sector (β = −.18, p < .05) both have a negative impact on efficiency. This means that larger teams as well as governmental teams perform less on efficiency. Model 2 offers a significantly better explanation for the differences in team efficiency (ΔR2 = .350, ΔF = 67.15, p < .01), adding up to 47.3% of variance.
Both team size (β = −.01, p < .01) and sector (β = −.15, p < .01) continue to influence team efficiency negatively. A positive effect can be found in higher levels of goal clar-ity (β = .44, p < .01). When self-management and information elaboration are added, these effects remain significant and more variance can be accounted for in Model 3 (R2
adjusted = .593, ΔR2 = .139, ΔF = 17.70, p < .01). Self-management has the largest
positive influence on efficiency (β = .40, p < .01). Model 4 is not an improvement (R2
adjusted = .586, ΔR2 = .001, ΔF = 0.16, ns). The hypothesized moderated relationships
cannot be found in the data.
Taking the discussed analyses into consideration, the evidence for the hypotheses is mixed. The first hypothesis about the positive effect of goal clarity on performance can be supported. For both performance variables, goal clarity has shown a positive cor-relation throughout all models. The second and third hypotheses concerning the mod-erating effects of self-management and information elaboration have not been supported by the data. For both effectiveness and efficiency, no significant interaction effect was found for either of the two expected moderators. The direct relationship between self-management and performance appears to be significant. Information elaboration, however, shows no significant correlation with effectiveness and effi-ciency. On the basis of these analyses, the conceptual model can be adapted, as dis-played in Figure 2.
Discussion
Table 4. Regression Analyses Team Effectiveness (n = 105).
B (95% confidence
intervals) SE B β t p
Model 1
Constant 3.82 [3.72, 3.92] 0.05 77.99 .000
Team size −0.01 [−0.01, 0.00] 0.00 −.17 −1.76 .081
Sector −0.04 [−0.17, −0.08] 0.06 −.07 −0.68 .501
R2
adjusted = .015, F = 1.80 (ns)
Model 2
Constant 3.80 [3.73, 3.88] 0.04 99.67 .000
Team size −0.00 [−0.01, 0.00] 0.00 −.15 −2.04 .044
Sector −0.02 [−0.12, 0.08] 0.05 −.03 −0.37 .712
Goal clarity 0.40 [0.30, 0.50] 0.05 .62 8.21 .000
R2
adjusted = .403, F = 24.45**, R2change = .387, Fchange = 67.38**
Model 3
Constant 3.80 [3.74, 3.87] 0.03 110.36 .000
Team size −0.00 [−0.01, 0.00] 0.00 −.07 −1.03 .304
Sector −0.02 [−0.11, 0.07] 0.05 −.02 −0.35 .728
Goal clarity 0.22 [0.11, 0.32] 0.05 .33 4.06 .000
Self-management 0.43 [0.23, 0.63] 0.10 .48 4.31 .000
Information elaboration 0.02 [−0.16, 0.20] 0.09 .03 0.25 .801
R2
adjusted = .551, F = 26.57**, R2change = .152, Fchange = 17.66**
Model 4
Constant 3.81 [3.74, 3.88] 0.04 107.90 .000
Team size −0.00 [−0.01, 0.00] 0.00 −1.39 .168
Sector −0.00 [−0.09, 0.09] 0.05 −0.03 .976
Goal clarity 0.20 [0.09, 0.31] 0.05 3.67 .000
Self-management 0.38 [0.17, 0.59] 0.10 3.66 .000
Information elaboration 0.06 [−0.12, 0.25] 0.09 0.69 .493
Interaction goals
—self-management −0.21 [−0.46, −0.04] 0.13 −1.65 .102
Interaction goals—
information elaboration 0.05 [−0.27, 0.38] 0.16 0.32 .747
R2
adjusted = .556, F = 19.63**, R2change = .013, Fchange = 1.54 (ns)
†p < .10. *p < .05. **p < .01.
investigation. Therefore, it cannot be concluded that goal setting is less influential than self-management. Further research should continue to test the usefulness of a goal orien-tation in the public sector by including the other dimensions of goal setting theory. Testing Davis and Stazyk’s (2015) ideas about the benefits that could follow from the presence of some goal ambiguity seems particularly worthwhile as well.
Despite the rather strong correlations between information elaboration and the two performance variables, no significant association was found in the regression analysis. Table 5. Regression Analyses Team Efficiency (n = 105).
B (95% confidence
intervals) SE B β t p
Model 1
Constant 3.54 [3.43, 3.64] 0.05 66.35 .000
Team size −0.01 [−0.02, −0.00] 0.00 −.25 −2.72 .008
Sector −0.18 [−0.31, −0.04] 0.07 −.24 −2.59 .011
R2
adjusted = .106, F = 7.17**
Model 2
Constant 3.52 [3.44, 3.60] 0.04 84.71 .000
Team size −0.01 [−0.02, −0.00] 0.00 −.24 −3.26 .001
Sector −0.15 [−0.26, −0.05] 0.05 −.20 −2.82 .006
Goal clarity 0.44 [0.33, 0.54] 0.05 .59 8.20 .000
R2
adjusted = .473, F = 30.27**, R2change = .350, Fchange = 67.15**
Model 3
Constant 3.51 [3.44, 3.59] 0.04 93.56 .000
Team size −0.01 [−0.01, −0.00] 0.00 −.16 −2.53 .013
Sector −0.13 [−0.23, −0.03] 0.05 −.18 −2.68 .009
Goal clarity 0.24 [0.13, 0.36] 0.06 .33 4.18 .000
Self-management 0.40 [0.18, 0.61] 0.11 .38 3.63 .000
Information elaboration 0.11 [−0.08, 0.31] 0.10 .11 1.17 .246
R2
adjusted = .593, F = 31.25**, R2change = .139, Fchange = 17.70**
Model 4
Constant 3.51 [3.44, 3.59] .04 90.04 .000
Team size −0.01 [−0.01, −0.00] .00 −2.45 .016
Sector −0.12 [−0.23, −0.03] .05 −2.51 .017
Goal clarity 0.23 [0.12, 0.35] .06 3.90 .000
Self-management 0.38 [0.15, 0.61] .12 3.31 .001
Information elaboration 0.13 [−0.07, 0.33] .10 1.27 .209
Interaction goals
—self-management −0.08 [−0.35, 0.20] .14 −0.57 .572
Interaction goals—
information elaboration 0.05 [−0.31, 0.41] .18 0.29 .772
R2
adjusted = .586, F = 21.99**, R2change = .001, Fchange = 0.16 (ns)
Together with the strong bivariate correlation between information elaboration and self-management (as well as the other two bivariate correlations between the indepen-dent variables), this may point to a configuration of team characteristics that is of influ-ence for team performance, but which has not been modeled here. One such possible configuration could be that more self-management induces better information elabora-tion because team members have to exchange more informaelabora-tion to be able to organize the teamwork. Such information exchange could in turn benefit the clarity of team goals. Especially if teams are involved in goal setting and are able to influence their own goals as part of management, goal clarity can be enhanced through the self-management process. This would be interesting in the light of Davis and Stazyk’s (2015) discussion of the potential value of having some degree of goal ambiguity: despite the negative influence of the uncertainty that could be introduced by goal ambi-guity, teams could alleviate this by engaging more in self-management. The clarifica-tion within the team that would accompany this self-managing behavior and informaclarifica-tion elaboration could make team goals nonetheless motivating toward good performance. It is then of interest to take such relationships between team characteristics into account, as well as who is setting goals. Further research could investigate this more.
Another way in which our knowledge about the usefulness of goal orientation and teamwork in the public sector could be increased is through the consideration of other factors from the goal setting framework. A concept that is very relevant in the context of teams, particularly in the public sector, is goal complexity. This refers to situations in which multiple goals that have different time frames and that require different capacities are in place simultaneously. Cooperation and coordination gain in impor-tance in such circumsimpor-tances (Marks, Mathieu, & Zaccaro, 2001; Rainey & Jung, 2015; Sun & Frese, 2013). Teams in the public sector often have to deal with multiple goals at the same time, contradictory goals being not uncommon as well, with the associated effects on performance (Chun & Rainey, 2005; Rainey & Jung, 2015). Looking into factors such as goal complexity would enhance our understanding of goal setting and the performance benefits of the goal focus in performance management.
+
Goal-setting - Goal clarity
Team performance - Effectiveness - Efficiency Moderators
- Self-management - Information elaboration
Some limitations of this study must be kept in mind. First, testing goal setting the-ory was not the original purpose of the analyzed data. The measurement scales were therefore not optimal to test the hypothesized relationships. This can be seen in the fact that for goal setting only the goal clarity dimension was taken into account, as men-tioned earlier, with a scale that was initially not intended to measure this concept.1
Measurement validity is possibly limited as a consequence (De Vaus, 2014; Neuman, 2004). Collecting data with the specific purpose to test the presented model could overcome this issue. A second limitation is the cross-sectional nature of this study. Although the model was based on theoretical arguments and empirical studies sup-ported the direction of the hypothesized relationships, causality cannot be demon-strated. Data were only collected at one point in time, so no change in the variables and relationships could be examined, limiting the ability to draw conclusions about the direction of the correlations. To overcome this weakness, future research should take a longitudinal approach (Field, 2013).
Third, the results can only be partly generalized. The method of team selection, which involved selective sampling and self-selection, made the sample not random and consequently not representative for the Dutch public sector (De Vaus, 2014). Conclusions should therefore be treated with some caution. Nevertheless, there is no reason to assume a bias in the variables’ relationships (cf. Morgeson & Humphrey, 2006). Moreover, due to the heterogeneity and the limited number of teams in the sample, no conclusions could be drawn about individual sectors within the public domain. Our current sample is broad in scope as it concerns an exploration within the public sector. Relationships that were upheld by our analyses should be tested within a more homogeneous sample of teams within a particular sector or type of organiza-tion, whereby the management context is kept constant. Spurious relationships involv-ing organizational characteristics and variations in management systems could not be ruled out as these factors were not accounted for in the present analyses. Such factors could play a role in relationships at the team level by influencing the independent as well as dependent variables. Collecting data with a more homogeneous sample involv-ing a small number of sectors allows comparinvolv-ing levels of government or sectors (Richter et al., 2011). As shown here, the sector or organization in which a team oper-ates influences efficiency and may affect team characteristics as was found in other studies (Cohen & Bailey, 1997; Delarue et al., 2008; Mathieu, Maynard, Taylor, Gilson, & Ruddy, 2007; Richter et al., 2011). Now, only the distinction between gov-ernmental and other non-govgov-ernmental public teams could be made given the sample size, but further comparisons could be insightful.
perceptions of multiple respondents from the team could then provide a more robust picture than the judgment of a single manager. A problem for using other types of data instead of survey responses to assess performance stems from the diversity of the sample. Due to large variations in the type of work the participating teams do, a rela-tively general measurement of performance is required. The used scale offers the pos-sibility to collect performance information, which is still comparable across teams.
The current research has given some interesting insights into goal setting in public sector teams. The key contributions of this study lie in the empirical study of teams in public organizations, the transfer of goal setting theory to the team level, and particu-larly in this combination of studying to what extent goal setting in public sector teams affects their performance. Given the widespread adoption of performance manage-ment, for which clear goals are of great importance, and the growth in self-managing teams in public organizations, such research is very relevant. The main findings can be summed up as a confirmation of the utility of goal setting theory within the public sec-tor at the team level, which is a step beyond the existing research supporting validity in both a team and a public sector context. Moreover, the importance of self-managing behavior of teams to organize their work and accomplish team goals for team perfor-mance has been demonstrated. Still, many questions are left to be answered. Several suggestions for future research have been presented above to address these. Examining performance management’s assumption about the benefits of focusing on output remains a relevant topic both for science and for practice, which means that goal set-ting research should remain on the agenda.
Declaration of Conflicting Interests
The author(s) declared no potential conflicts of interest with respect to the research, authorship, and/or publication of this article.
Funding
The author(s) received no financial support for the research, authorship, and/or publication of this article.
Note
1. The scale employed to measure goal clarity was originally intended to capture the concept of goal dependency (Groeneveld & Kuipers, 2014). Goal dependency is a layered concept, consisting of goal clarity and goal sharedness. Given this overlap in meaning, we consid-ered the used items to offer a meaningful measure of goal clarity in teams.
References
Andersen, J. A. (2010). Public versus private managers: How public and private managers differ in leadership behavior. Public Administration Review, 70, 131-141.
Bandura, A. (2012). On the functional properties of perceived self-efficacy revisited. Journal of Management, 38, 9-44.
Bandura, A. (2013). The role of self-efficacy in goal-based motivation. In E. A. Locke & G. P. Latham (Eds.), New developments in goal setting and task performance (pp. 147-157). New York, NY: Routledge.
Bliese, P. D. (1998). Group size, ICC values, and group-level correlations: A simulation. Organizational Research Methods, 1, 355-373.
Bliese, P. D. (2000). Within-group agreement, non-independence, and reliability: Implications for data aggregation and analysis. In K. J. Klein & S. W. J. Kozlowski (Eds.), Multilevel theory, research, and methods in organizations: Foundations, extensions, and new direc-tions (pp. 349-381). San Francisco, CA: Jossey-Bass.
Bliese, P. D., & Halverson, R. R. (1998). Group size and measures of group-level properties: An examination of eta-squared and ICC values. Journal of Management, 24, 157-172. Bronkhorst, B., Steijn, B., & Vermeeren, B. (2015). Transformational leadership, goal
set-ting, and work motivation: The case of a Dutch municipality. Review of Public Personnel Administration, 35, 124-145.
Campion, M. A., Medsker, G. J., & Higgs, A. C. (1993). Relations between work group char-acteristics and effectiveness: Implications for designing effective work groups. Personnel Psychology, 46, 823-850.
Cheney, G., Christensen, L. T., Zorn, T. E., Jr., & Ganesh, G. (2011). Organizational communi-cation in an age of globalization: Issues, reflections, practices (2nd ed., pp. 215-251). Long Grove, IL: Waveland Press.
Chun, Y. H., & Rainey, H. G. (2005). Goal ambiguity in U.S. federal agencies. Journal of Public Administration Research and Theory, 15, 1-30.
Cohen, S. G., & Bailey, D. E. (1997). What makes teams work: Group effectiveness research from the shop floor to the executive suite. Journal of Management, 23, 239-290.
Dalal, D. K., & Zickar, M. J. (2012). Some common myths about centering predictor variables in moderated multiple regression and polynomial regression. Organizational Research Methods, 15, 339-362.
Davis, R. S., & Stazyk, E. C. (2015). Developing and testing a new goal taxonomy: Accounting for the complexity of ambiguity and political support. Journal of Public Administration Research and Theory, 25, 751-775.
Dawson, J. F. (2014). Moderation in management research: What, why, when, and how. Journal of Business Psychology, 29, 1-19.
Day, D. V., & Unsworth, K. L. (2013). Goals and self-regulation: Emerging perspectives across levels and time. In E. A. Locke & G. P. Latham (Eds.), New developments in goal setting and task performance (pp. 158-176). New York, NY: Routledge.
De Vaus, D. (2014). Surveys in social research (6th ed.). Abingdon, UK: Routledge.
De Vocht, A. (2012). Basishandboek SPSS 20 [Basic manual SPSS 20]. Utrecht, The Netherlands: Bijleveld Press.
Delarue, A., Van Hootegem, G., Procter, S., & Burridge, M. (2008). Teamworking and orga-nizational performance: A review of survey-based research. International Journal of Management Reviews, 10, 127-148.
Diefenbach, T. (2009). New Public Management in public sector organizations: The dark sides of managerialistic “enlightenment.” Public Administration, 87, 892-909.
Groeneveld, S., & Kuipers, B. S. (2014, August). Teamwork in the public cage: Antecedents of self-management of teams in public organizations. Paper presented at the Academy of Management 2014 Annual Meeting, Philadelphia, PA.
Hoegl, M., & Gemuenden, H. G. (2001). Teamwork quality and the success of innovative proj-ects: A theoretical concept and empirical evidence. Organization Science, 12, 435-449. Hoegl, M., & Parboteeah, K. P. (2003). Goal setting and team performance in innovative
proj-ects: On the moderating role of teamwork quality. Small Group Research, 34, 3-19. Hollensbe, E. C., & Guthrie, J. P. (2000). Group pay-for-performance plans: The role of
spon-taneous goal setting. The Academy of Management Review, 25, 864-872.
Hood, C. (1991). A public management for all seasons? Public Administration, 69, 3-19. House, R. J., & Rizzo, J. R. (1972). Role conflict and ambiguity as critical variables in a
model of organizational behavior. Organizational Behavior and Human Performance, 7, 467-505.
Hughes, O. E. (2012). Public management and administration: An introduction. Basingstoke, UK: Palgrave Macmillan.
Jakobsen, M., & Jensen, R. (2015). Common method bias in public management studies. International Public Management Journal, 18, 3-30.
Jung, C. S. (2011). Organizational goal ambiguity and performance: Conceptualization, mea-surement, and relationships. International Public Management Journal, 14, 193-217. Kleingeld, A., Van Mierlo, H., & Arends, L. (2011). The effect of goal setting on group
perfor-mance: A meta-analysis. Journal of Applied Psychology, 96, 1289-1304.
Kramer, W. S., Thayer, A. L., & Salas, E. (2013). Goal setting in teams. In E. A. Locke & G. P. Latham (Eds.), New developments in goal setting and task performance (pp. 287-310). New York, NY: Routledge.
Kuipers, B., & de Witte, M. C. (2005). Teamwork: A case study on development and perfor-mance. The International Journal of Human Resource Management, 16, 185-201.
Kuipers, B., & Vermeeren, B. (2013). Inrichting van publieke organisaties [Design of public organisations]. In B. Steijn & S. M. Groeneveld (Red.), Strategisch HRM in de publieke sector [Strategic HRM in the public sector] (2de ed., pp. 57-79). Assen, The Netherlands: Koninklijke Van Gorcum.
Langfred, C. W. (2005). Autonomy and performance in teams: The multilevel moderating effect of task interdependence. Journal of Management, 31, 513-529.
Latham, G. P., Borgogni, L., & Petitta, L. (2008). Goal setting and performance management in the public sector. International Public Management Journal, 11, 385-403.
Latham, G. P., & Locke, E. A. (1991). Self-regulation through goal setting. Organizational Behavior and Human Decision Processes, 50, 212-247.
Latham, G. P., & Locke, E. A. (2013). Goal setting theory, 1990. In E. A. Locke & G. P. Latham (Eds.), New developments in goal setting and task performance (pp. 3-15). New York, NY: Routledge.
Leach, D. J., Wall, T. D., Rogelberg, S. G., & Jackson, P. R. (2005). Team autonomy, perfor-mance, and member job strain: Uncovering the teamwork KSA link. Applied Psychology: An International Review, 54, 1-24.
Locke, E. A., & Latham, G. P. (2013). Goal setting theory: The current state. In E. A. Locke & G. P. Latham (Eds.), New developments in goal setting and task performance (pp. 623-630). New York, NY: Routledge.
Mathieu, J. E., Maynard, M. T., Taylor, S. R., Gilson, L. L., & Ruddy, T. M. (2007). An exami-nation of the effects of organizational district and team contexts on team processes and per-formance: A meso-mediational model. Journal of Organizational Behavior, 28, 891-910. Meier, K. J., & O’Toole, L. J. (2013). Subjective organizational performance and measurement
error: Common source bias and spurious relationships. Journal of Public Administration Research and Theory, 23, 429-456.
Morgeson, F. P., & Humphrey, S. E. (2006). The Work Design Questionnaire (WDQ): Developing and validating a comprehensive measure for assessing job design and the nature of work. Journal of Applied Psychology, 91, 1321-1339.
Neuman, W. L. (2004). Qualitative and quantitative measurement. In W. L. Neuman (Ed.), Basics of social research: Quantitative and qualitative approaches (International ed., pp. 105-130). Boston, MA: Pearson.
Pandey, S. K., & Rainey, H. G. (2006). Public managers’ perceptions of organizational goal ambiguity: Analyzing alternative models. International Public Management Journal, 9, 85-112.
Pandey, S. K., & Wright, B. E. (2006). Connecting the dots in public management: Political environment, organizational goal ambiguity, and the public manager’s role ambiguity. Journal of Public Administration Research and Theory, 16, 511-532.
Perry, J. L., Mesch, D., & Paarlberg, L. (2006). Motivating employees in a new governance era: The performance paradigm revisited. Public Administration Review, 66, 505-514.
Pollitt, C., & Bouckaert, G. (2011). Public management reform: An international comparison (3rd ed.). Oxford, UK: Oxford University Press.
Poulton, B. C., & West, M. A. (1999). The determinants of effectiveness in primary health care teams. Journal of Interprofessional Care, 13, 7-18.
Rainey, H. G. (2014). Understanding and managing public organizations (5th ed.). San Francisco, CA: Jossey-Bass.
Rainey, H. G., & Jung, C. S. (2015). A conceptual framework for analysis of goal ambiguity in public organizations. Journal of Public Administration Research and Theory, 25, 71-99. Richter, A. W., Dawson, J. F., & West, M. A. (2011). The effectiveness of teams in
organiza-tions: A meta-analysis. The International Journal of Human Resource Management, 22, 2749-2769.
Rizzo, J. R., House, R. J., & Lirtzman, S. I. (1970). Role conflict and ambiguity in complex organizations. Administrative Science Quarterly, 15, 150-163.
Seijts, G. H., & Latham, G. P. (2000). The effects of goal setting and group size on performance in a social dilemma. Canadian Journal of Behavioural Science, 32, 104-116.
Stewart, G. L., Courtright, S. H., & Manz, C. C. (2011). Self-leadership: A multi-level review. Journal of Management, 37, 185-222.
Sun, S. H., & Frese, M. (2013). Multiple goal pursuit. In E. A. Locke & G. P. Latham (Eds.), New developments in goal setting and task performance (pp. 177-194). New York, NY: Routledge. Tjosvold, D., Tang, M. M. L., & West, M. (2004). Reflexivity for team innovation in China: The contribution of goal interdependence. Group & Organization Management, 29, 540-559. Van Dick, R., Van Knippenberg, D., Hägele, S., Guillaume, Y. R. F., & Brodbeck, F. C. (2008).
Group diversity and group identification: The moderating role of diversity beliefs. Human Relations, 61, 1463-1492.
Van Knippenberg, D., De Dreu, C. K. W., & Homan, A. C. (2004). Work group diversity and group performance: An integrative model and research agenda. Journal of Applied Psychology, 89, 1008-1022.
Van Mierlo, H., Vermunt, J. K., & Rutte, C. G. (2009). Composing group-level constructs from individual-level survey data. Organizational Research Methods, 12, 368-392.
Vashdi, D. R. (2013). Teams in public administration: A field study of team feedback and effec-tiveness in the Israeli public healthcare system. International Public Management Journal, 16, 275-306.
West, M. A., & Anderson, N. R. (1996). Innovation in top management teams. Journal of Applied Psychology, 81, 680-693.
West, M. A., Brodbeck, F. C., & Richter, A. W. (2004). Does the “romance of teams” exist? The effectiveness of teams in experimental and field settings. Journal of Occupational and Organizational Psychology, 77, 467-473.
Whisman, M. A., & McClelland, G. H. (2005). Designing, testing, and interpreting interactions and moderator effects in family research. Journal of Family Psychology, 19, 111-120. Wright, B. E. (2001). Public sector work motivation: A review of the current literature and
a revised conceptual model. Journal of Public Administration Research and Theory, 11, 559-586.
Wright, B. E. (2004). The role of work context in work motivation: A public sector applica-tion of goal and social cogniapplica-tion theories. Journal of Public Administraapplica-tion Research and Theory, 14, 59-78.
Author Biographies
Marieke van der Hoek is a PhD candidate in the Institute of Public Administration at Leiden University, the Netherlands. Her research interests concern public management, organizational behavior, and performance management. In her PhD research, she focuses on public leadership at universities in international perspective.
Sandra Groeneveld is professor of public management in the Institute of Public Administration at Leiden University, the Netherlands. Her research interests include the structure and manage-ment of public organizations, focusing particularly on diversity managemanage-ment, leadership, and organizational change.
![Table 4. Regression Analyses Team Effectiveness (n = 105). B (95% confidence intervals) SE B β t p Model 1 Constant 3.82 [3.72, 3.92] 0.05 77.99 .000 Team size −0.01 [−0.01, 0.00] 0.00 −.17 −1.76 .081 Sector −0.04 [−0.17, −0.08] 0.06 −.07 −0.68 .501](https://thumb-us.123doks.com/thumbv2/123dok_us/8230328.2181794/14.648.64.574.111.699/table-regression-analyses-effectiveness-confidence-intervals-constant-sector.webp)


