DYNAMIC THRESHOLD RELATIONS OF STORMFLOW RUNOFF IN HUMID HEADWATER CATCHMENTS OF THE COWEETA HYDROLOGIC LABORATORY
Charles Isaac Scaife
A thesis submitted to the faculty of the University of North Carolina at Chapel Hill in partial fulfillment of the requirements for the degree of Master of Arts in the Department of Geography
Chapel Hill 2015
iii ABSTRACT
Charles Isaac Scaife: Dynamic Threshold Relations of Stormflow Runoff in Humid Headwater Catchments of the Coweeta Hydrologic Laboratory
(Under the direction of Lawrence E. Band)
This thesis examines the long-term threshold response of rainfall-runoff relationships at the Coweeta Hydrologic Laboratory located in the Southern Appalachian Mountains of North Carolina. Threshold relationships between total stormflow and antecedent wetness represent an important emergent behavior that has been observed in previous studies. These studies are limited to only several years of analysis, which raises questions about longer term
iv
ACKNOWLEDGEMENTS
This thesis is a culmination of the support and efforts of many people, agencies, and institutions that played a role in everything from its conception as a project to its evolution into a scientific story. My deepest of gratitude is given to my advisor, Dr. Lawrence Band, whose expertise and patience guided this research. He strengthened my understanding of the field and challenged me to visualize solutions to scientific problems from several angles. His influence extends beyond this thesis into the very nature of my curiosity for the field and in my
development as a researcher. My committee, Dr. Diego Riveros-Iregui and Dr. Aaron Moody, also deserve thanks. Without their invaluable input, this thesis would not have thoroughly addressed key implications of our findings. Also, Dr. Taehee Hwang who is now at Indiana University, is owed acknowledgement for introducing me to the field site and helping with data collection. He also played a key role in assisting with my analysis and his feedback on final drafts of this thesis shaped much of the discussion. The unending support from fellow graduate students including Jonathan Duncan and Brian Miles guided me through effectively analyzing and visualizing data. Lastly, I’d like to thank the support of family and friends who encouraged me throughout this journey.
v
vi
TABLE OF CONTENTS
LIST OF TABLES ... vii
LIST OF FIGURES ... viii
1 INTRODUCTION ... 1
2 BACKGROUND ... 3
3 DATA AND METHODS ... 10
3.1 Study Site ... 10
3.2 Long-term Climate and Hydrology ... 12
3.3 Field Measurements ... 15
3.4 Storm and Threshold Definition ... 16
4 RESULTS ... 18
4.1 Threshold Stormflow Response ... 18
4.2 Temporal Dependence of Threshold Behavior ... 22
4.3 Long-term hydroclimate and threshold pattern variation ... 29
5 DISCUSSION ... 33
5.1 Interannual variability in threshold dynamics ... 33
5.2 Drivers of threshold variation ... 34
5.3 Non-linearity and Runoff Generation Mechanisms ... 40
6 CONCLUSIONS ... 44
vii
LIST OF TABLES
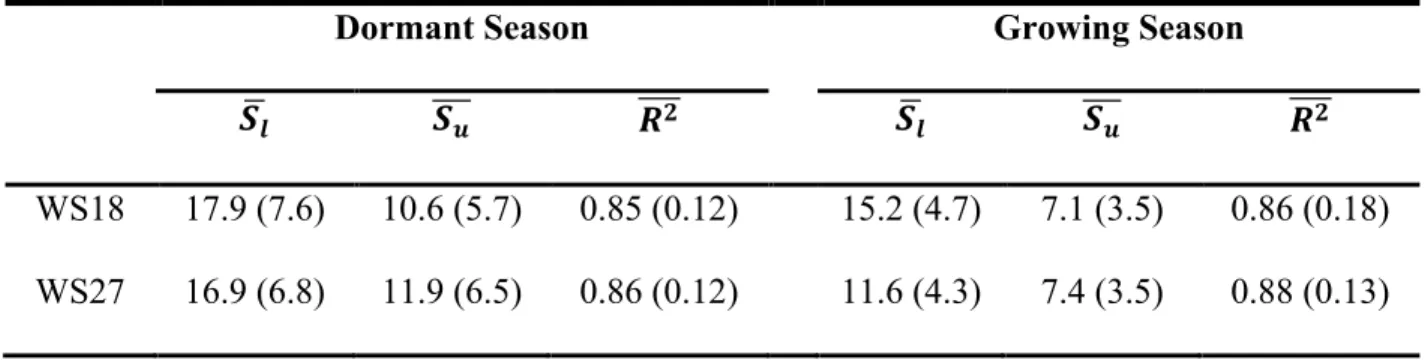
Table 4.1 Summary statistics from interannual threshold analysis in WS18 and WS27 for the average number of storms below the threshold (Sl),
above the threshold (Su), and the combined correlation coefficient
viii
LIST OF FIGURES
Figure 3.1. A hillshade map of the (a) the Coweeta Basin at the Coweeta Hydrologic Laboratory in SW North Carolina, USA, with
precipitation stations, (b) WS14 with its 18 soil moisture plots in
three transects, and both LTER Catchments (c) WS18 and (d) W27. ... 14 Figure 4.1. Summary of the storm event results where total stormflow is
plotted as a function of (1) gross storm event precipitation (a, d, g), (2) antecedent soil moisture index (b, e, h), and (3) the sum of gross precipitation and ASI combined (c, f, i). Measurement period for WS14 is Jul. 2011-Jan. 2013 and for WS18/WS27 is Feb. 1999-Oct.
2014. ... 21 Figure 4.2 Dormant (a) and growing (b) season response of total
stormflow to gross precipitation and ASI in WS14 for the period 07/2011 to 1/2013. Threshold values are represented by black vertical lines and storms on either side of the threshold are fit separately. Their respective r2 values and slopes (mu,l) are shown. (* p < 0.05, **
p < 0.01) ... 24 Figure 4.3. Long-term growing and dormant season response of total
stormflow to gross precipitation and ASI in WS18 (a, b) and WS27 (c, d) between 1999-2014. Thresholds are averaged over all years for each season (black line) and over each individual year (dashed line). The distribution of yearly thresholds is expanded above each plot to
show their corresponding year. ... 25 Figure 4.4 WS18 and WS27 long-term datasets restricted to the WS14
measurement period from July 2011 to January 2013. Storm events are separated into dormant season (a, c) and growing season (b, c) with linear regressions (solid red line) computed for storms below and above the threshold. Respective r2 (* p < 0.05, ** p < 0.01) and
slopes (mu,l) of each regression are also displayed. ... 27
Figure 4.5. Dormant (a) and growing (b) season thresholds in WS18 (circles and solid line) and WS27 (triangles and dotted line) plotted as
a timeseries. ... 28 Figure 4.6 Dormant and growing season response of rainfall-runoff
thresholds to total seasonal rainfall in WS18 and WS27. Local
phenology was determined for WS18 and WS27 separately following
ix
Figure 4.7 Dormant and growing season threshold response to prior season
precipitation in WS18 and WS27. ... 31 Figure 4.8. Interannual slope calculations of storms above the threshold
identified for long-term dormant and growing season response in WS18 (a, b) and WS27 (c, d) between 1999-2014. Each point represents a single year and colors correspond to total seasonal
rainfall. ... 32 Figure 5.1 Conceptual representation of stormflow response in an
ecosystem that is healthy (dashed lines) and in the same ecosystem following a drought (solid lines) assuming identical antecedent soil moisture conditions and gross precipitation. Units are unspecified as stormflow response and time may vary with ecosystem, storm size,
1
1 INTRODUCTION
Runoff generation processes at the hillslope scale involve complex processes that are difficult to measure empirically and include an integration of flow times spanning several orders of magnitude (Sivapalan, 2003, Tetzlaff et al., 2008). The interactions of soil moisture (Western et al., 2002), preferential flow (Mosley, 1982), and the connectivity of saturated regions (Hewlett and Nutter, 1970; Dunne and Black, 1970) scale non-linearly to catchment runoff generation (Dunne et al., 1975). A number of complex, process-oriented simulation models have been developed over the past few decades to attempt to integrate surface, subsurface, and ecosystem processes to predict catchment runoff behavior under different conditions, constituting a “bottom-up” approach. Alternatively, using a top-down approach, complex runoff generation processes can be simplified into emergent behaviors (Sivapalan, 2003).
2
units (Dooge, 1986). The expectation is that the properties that emerge with increasing scale integrate hydrologic complexities and heterogeneities into well-defined spatiotemporal patterns. Common forms of these emergent patterns include: 1) threshold flow generation (Tromp van Meerveld and McDonnell, 2006a, Detty and McGuire 2010, Graham et al., 2010); 2) stormflow traveltime distributions (McGuire et al 2005); and 3) catchment-scale hysteresis of soil moisture and streamflow (Rosenbaum et al., 2012).
Studies investigating emergent patterns are often limited by measurement period, and those with long-term datasets do not directly address issues of non-stationarity raising questions concerning long-term stability of emergent patterns. We use well-established soil moisture, rainfall, and discharge measurements collected from the Coweeta Hydrologic Laboratory in the southwest Appalachian Mountains of North Carolina, which span 15-years of continuous
measurement allowing us to consider short- and long-term rainfall-storage-runoff behavior. This study examines the formation of emergent patterns using threshold response behavior of
stormflow and addresses the following questions:
(1) Do thresholds in stormflow response exist in Coweeta and do they persist over long-term monitoring sites?
3
2 BACKGROUND
Threshold behavior in stormflow response, as an emergent pattern, has the potential to discriminate between runoff generation processes linking sub-hillslope processes to catchment discharge. A major question is whether simple, threshold-based storage-runoff response models can adequately reproduce and summarize behavior of the number of complex, interacting processes active at the hillslope and catchment level. A number of recent research studies have investigated this question. Tromp van Meerveld and McDonnell (2006a) excavated a 20 m long trench in the Panola Mountain Research Watershed (PMRW) where they measured subsurface pipe flow and matrix flow. They found total pipe flows greater than 1 mm at the trench face when total storm event rainfall exceeded 55 mm and when soil moisture prior to storm events was high. Detty and McGuire (2010a, b) directly combined antecedent soil moisture integrated with depth and total storm precipitation to evaluate similar threshold response for the Watershed 3 catchment at the Hubbard Brook Experimental Forest. Their study showed total quickflow generation followed a strongly linear correlation when the sum of storm event precipitation and antecedent soil moisture exceeded some threshold. Events above this threshold had
4
response. In events with interstorm periods that exceeded 10 days, stormflow response to rainfall was delayed requiring almost 80 mm of precipitation before significant stormflow was observed. Penna et al. (2011) showed similar non-linear controls of antecedent soil moisture on stormflow generation and runoff ratios. Their study in Rio Vauz Basin of the Italian Alps consisted of 26 plots sampled synoptically over two years during June and July with portable soil moisture probes, in addition to four continuous soil moisture sites that measured from June to October.
Mechanisms of non-linear stormflow response in forested catchments have generally been attributed to the activation of subsurface macropore flow, but hillslope connectivity to near-stream riparian areas may be essential in forming non-linear stormflow responses (Freer et al., 2002). Tromp-van Meerveld et al. (2006b) proposed the fill and spill hypothesis that describes the importance of bedrock topography and flow at the soil-bedrock interface as a major
5
moisture and rainstorm size and intensity influence the relative contribution of pipe flow and fracture flow contributing to non-linear stormflow response (Tromp-van Meerveld et al., 2006a).
Vegetation also plays a critical role in hillslope hydrology that manifests as emergent patterns. Phenology, fine root growth, succession, rates of evapotranspiration, rooting depth, and landscape pattern influence runoff generation processes with increasing spatiotemporal
complexity (Western et al., 1999; 2002). Local hydrologic controls exerted by vegetation are shown to shift towards non-local controls (e.g. topography) with senescence and higher seasonal rainfall (Grayson et al., 1997). During the dormant season, less evapotranspiration and greater lateral redistribution increase runoff sensitivity to rainfall. Lateral redistribution during the growing season is inhibited by plant water uptake altering hillslope connectivity and subsurface flows. This observation highlights competition among runoff and transpiration outputs over limited root-zone soil moisture, particularly in deep forested soils where streamflow generation is predominately shallow subsurface flow (Hewlett and Hibbert, 1967). Significant runoff generation relies on increased levels of hillslope connectivity under wetter soil moisture in the shallow subsurface, but transpiration during the growing season actively removes soil water in this zone. The effects of shifting plant phenology and transpiration combined with interannual hydroclimate variability (Hwang et al., 2011; 2014) may alter well-established emergent patterns over time frames on the order of several years to a decade.
In forested ecosystems, transpiration is a major pathway for rainfall inputs comprising more than half of the annual rainfall in Coweeta (Swift et al., 1988). Recent research has shown that hydroclimate extremes, in particular drought, can have prolonged effects on tree
6
are reduced leaf area (Grier and Running, 1977; Golz, 1982) and increased rooting depths (Hacke et al., 2001), but under severe droughts leaf (Maseda and Fernandez, 2006; Bucci et al., 2005) and fine root abscission (Maseda and Fernandez, 2006) can occur in addition to hydraulic impairment resulting from embolisms forming within the xylem (Tyree and Sperry, 1989). During recovery, transpiration capacity of trees is reduced and may persist from several months to years (Hacke et al., 2001).
Ring-porous xylem anatomies have transpiration rates limited by lower stem conductance in comparison to their stomatal conductance. As a result, species with this xylem anatomy sustain lower rates of transpiration overall and tend to leave stomata open even through dry periods making them more susceptible to cavitation and mortality during severe droughts (Ford et al., 2010). However, diffuse-porous xylem anatomies mediate water through stomatal closure and exhibit quicker response to changes in vapor pressure deficits. They are capable of higher rates of transpiration but can become stressed after numerous dry periods resulting in leaf
senescence and reduced leaf area. Scaling differences in drought response of individual trees and functional types to the catchment can have profound effects on well-established rainfall-runoff relationships following droughts (Ford et al., 2010). Thus, characterizing long-term controls of vegetation on emergent behavior is important for expanding these principles to longer hydrologic studies and to other climates.
7
typically assume zero or close to zero slopes below the threshold, which may overlook more gradual processes contributing to stormflow such as expanding variable source area.
To date, studies have utilized seasonal to several year datasets to characterize emergent patterns of stormflow response with respect to measured rainfall and storage in forested
catchments. Penna et al., (2011) showed strongly non-linear response of streamflow and shallow groundwater to soil moisture limited to only two summer periods due to winter snowpacks. Uchida et al. (2005) analyzed four watersheds, including PMRW comprising up to 2.5 years of continuous data ranging from 16 to 147 storm events (Tromp-van Meerveld 2006a,b). Detty and McGuire (2010) demonstrated compelling results that isolate simple threshold behavior by combining meteorology and antecedent soil moisture. However, their study spanned a single wet-up period from August to January, which included 14 storms. By far the most
comprehensive analysis was at HJ Andrews Experimental Forest (Graham and McDonnell, 2010), but their 50+ years of data only included rainfall and catchment runoff using interstorm period to approximate antecedent wetness, which makes identifying mechanisms of threshold behavior difficult. Also, most of the rainfall is received during a single winter season in a mature coniferous forest making phenologic drivers of thresholds moot.
8
Previous studies have also shown the importance of subsurface flow in Coweeta supplying streamflow (Hewlett and Hibbert, 1967), especially within the rooting zone, which requires consideration of vegetation response in developing these emergent patterns. We pose a set of four hypotheses that serve our central objective of characterizing long-term threshold behavior:
• We hypothesize that watersheds in Coweeta exhibit well-defined thresholds at short
timescales on the order of a single season to a year, but longer measurement periods (>10 years) introduce variability as a result of non-stationarity in these hydroecological systems.
• We hypothesize a correlation between threshold values and seasonal rainfall due to
vegetation response to hydroclimate extremes. The influence of hydroclimate extremes will also affect long-term catchment memory resulting in a correlation of threshold values with long-term rainfall totals.
• We further hypothesize that differences in dominant vegetation types between
catchments will result in distinct threshold sensitivities to seasonal rainfall. In particular, catchments dominated by ring-porous species will exhibit greater sensitivity to seasonal rainfall totals due to water-use mediated by stem
9
• Lastly, we hypothesize that thresholds computed over long measurement periods
10
3 DATA AND METHODS
3.1 Study Site
The Coweeta Hydrologic Laboratory, located in North Carolina, USA is a USDA Forest Service site, jointly funded by the National Science Foundation Long Term Ecological Research (LTER) program. It is located in the southern Appalachians and was originally established in the 1930s to study the effects of land management practices and vegetation cover on streamflow generation. Rainfall-runoff records extend back 80 years for a set of the gaged catchments. Research at Coweeta has since expanded to include community ecology, forest ecophysiology and dynamics, stream biogeochemistry, and aquatic and terrestrial biota.
Coweeta is an east-facing, bowl-shaped basin with a drainage area of 1626 ha and elevation range of 1000 m (Swank and Crossley, 1988). It is further subdivided into paired watersheds that represent a variety of treatments and environmental gradients. The soils are sandy loam Inceptisols and Ultisols (Velbel, 1988) underlain by folded schist and gneiss
formations (Hatcher, 1988; Hales et al., 2009). Soil catenary processes lead to coarser loams on ridges and side slopes with finer colluvium of sandy loams in hollows and downslopes areas. The Nantahala Escarpment runs along the exterior boundaries of high elevation watersheds (Wooten et al., 2007; Band et al., 2012). Watersheds that border the Nantahala Escarpment transition from colluvial low slope bottomlands to steep rocky slopes with outcrops (Band et al., 2012).
11
(CS01) around 1700 mm and a strong orographic effect that leads to annual rainfall amounts exceeding 2500 mm at the highest elevations (Swift et al., 1988). Rainfall is evenly distributed throughout the year with higher intensity convective storms during the summer and frontal precipitation in the winter (Laseter et al., 2012). Snow is uncommon at Coweeta even at high elevations. The area is also prone to tropical storms that can trigger landslides especially around the Nantahala Escarpment (Wooten et al., 2007; Hales et al., 2009; Band et al., 2012).
Furthermore, increasing long-term hydroclimate variability has increased extreme wet and dry periods that can impact timing of vegetation senescence (Hwang et al., 2014).
Forest community composition varies across elevation and moisture gradients from oak-pine dominance along dry, low elevation ridges to northern hardwood dominance in wetter, high elevation regions (Day and Monk, 1974). At low elevations, forest types are predominantly
12
Our study focuses on three headwater catchments with variable basin morphology and environmental conditions (Figure 3.1). WS14 and WS18 are neighboring low elevation
catchments with similar aspects. WS14 is a 62.4 ha northwest facing control watershed with an undisturbed mixed hardwood forest. Relief in WS14 is 285m implying little orographic effect on precipitation. The watershed is divided into two main drainage stems of first and second stream orders. A thrust fault intersects WS14 midway downslope (Hatcher, 1988) creating rocky, steep channels downslope that transition to gentler gradients and banks upstream. WS18 is 12.3 ha with a similar mixed hardwood-oak stand that has been undisturbed since 1927. The basin is elongated with steeper slopes, but a relief comparable to WS14. WS27 is a 39.8 ha, high elevation control catchment with an elevation range of 393m (Swank and Crossley, 1988) and relatively higher rainfall and runoff ratios (Swift et al., 1988). Due to milder temperatures, the growing season in WS27 is shortened by almost a month (Hwang et al., 2011). WS27 backs up to the Nantahala Escarpment giving it steeper slopes higher in the catchment that decrease towards the outlet (Wooten et al., 2008; Hales et al., 2009).
3.2 Long-term Climate and Hydrology
13
rain gages above (RG31) and below (RG55) the catchment were averaged to account for
precipitation gradients. Daily discharge from each catchment is measured using v-notched weirs with continuous discharge data dating back to the mid-1930s. This study subsets the long-term discharge measurements to coincide with in situ soil moisture measurements that began in 1999.
Climate and hydrology data for Watersheds 18 and 27 were trimmed to correspond to 15-years of soil moisture measurements recorded from 1999-2014. This time domain includes wet and dry precipitation extremes and several hurricanes. A prolonged drought occurred at the onset of the study lasting from 1999-2001. It peaked in 2000 and 2001 when rainfall was below the long-term annual average of 1796 mm by 31% and 22%, respectively. A wetter period between 2002 and 2005 followed where average precipitation was 1946mm, the wettest of which was 2003 (+17%). Another severe drought occurred starting in 2006, which included the driest year on record in 2007 where rainfall was 32% below average. The drought ended in 2009 with subsequent years switching between wet and dry. This included the two wettest years on record, 2009 and 2013, where rainfall was 2374mm (+31.8%) and 2368mm (+32.1%), respectively. Several hurricanes also occurred, including Hurricane Frances and Ivan in 2004, which caused deadly landslides throughout the region. Overall, rainstorms at Coweeta are typically spaced 4 days apart but during droughts were as long as 39 days.
14
Figure 3.1. A hillshade map of the (a) the Coweeta Basin at the Coweeta Hydrologic Laboratory in SW North Carolina, USA, with precipitation stations, (b) WS14 with its 18 soil moisture plots in three transects, and both LTER Catchments (c) WS18 and (d) W27.
" )
" ) " ) ")")")")")")
" )")") " ) " )") " )")")")") " )
#
#
#
#
#
#
#
#
#
#
#
RG55 RG31 RG6 RG41 RG96 14 27 18 ")")") " )")") " )")") " ) " ) " ) " )")")")") " )
14
^ _ " ) " ) " ) ! ( #18
318 218 118#
rain gagesweirs
"
) plots
0
±
0.5 1km"
) ")
"
)
"
) ")
"
)
"
) ") ")
" ) " ) " ) " ) "
)") ")
" ) " ) T1A T2C T3C T3B T3A T2A T1BT1C T1F T1E T1D T2F T2E T3F T3E T3D T2B T2D
012.525m
15 3.3 Field Measurements
In catchments WS18 and WS27, five soil moisture plots were established along a terrestrial ecohydrologic gradient by the LTER (Figure 3.1c-d). WS18 has three gradient plots located along a moisture gradient including a xeric pine-oak stand (118), an intermediate mixed oak stand (318), and a mesic cove hardwood stand (218). WS27 has one plot in a mesic mixed oak stand (427) and a second plot in a high elevation northern hardwood stand (527). Water content at each plot is measured every 15 minutes by four Campbell CS616 time-domain reflectometer (TDR; Campbell Scientific Inc., Logan, UT, USA) probes totaling 20 probes throughout both LTER catchments and has been collected continuously since 1999. The 15 minute interval measurements are averaged to daily times steps. Probes are inserted at two depths (0-30cm & 30-60cm) and are located at two topographic positions (upper and lower) within each plot. A more detailed description of the terrestrial gradient plots can be found at the Coweeta LTER website (https://coweeta.uga.edu/dbpublic/dataset_details.asp?accession=1013).
WS14 is part of a hillslope-scale study concerned with ecohydrologic patterns, with soil moisture plots confined to a single hillslope, so sites in WS14 are not meant to be statistically representative of the entire catchment. Convergence zones along topographic flowlines were preferentially selected as sites for soil moisture plots because this region is likely where
16
polynomial factory calibration, where soil moisture is calculated as a volumetric wetness content (VWC) from period (T) in microseconds. Quadratic calibration functions are ideal for soils with high moisture variability because they reduce error at moisture extremes.
3.4 Storm and Threshold Definition
Following previous event-based studies, storms were defined as beginning with rainfall greater than 1 mm/day and ending when stormflow returns to zero (Hewlett and Hibbert, 1967; Detty and McGuire, 2010). This requires a hydrograph separation, which we estimated using the USGS HYSEP algorithm, adapted in MATLAB 2014b (The Mathworks, Inc.; Natwick, MA). This method utilizes a local minimum method (Pettyjohn and Henning, 1979) for calculating baseflow and quickflow from total discharge. We define storm events following Detty and McGuire (2010) and adapt it for daily timesteps to account for our extensive long-term discharge and soil moisture data that has a daily temporal resolution. We use this method for consistency and comparison with previous findings and do not claim it clearly separates specific sources of runoff.
17
Thresholds were calculated using an algorithm that minimizes the least-squares of residuals by computing the linear-regression of two discrete subsets of the data adapted in MATLAB 2014b (The Mathworks, Inc.; Natwick, MA). This method differs from previous rainfall-runoff studies by minimizing the sum of squares residuals on both sides of the threshold simultaneously rather than visually estimating. It also identifies strong breaks in slope between total event wetness and total stormflow indicating possible changes in subsurface flow processes. By identifying breaks in slope, this method can produce non-zero slopes below the threshold and signify accelerating subsurface stormflow generation processes (e.g. increasing near-stream saturation) whereas previous work assumed negligible stormflow response below the threshold (Detty and McGuire, 2010; Graham and McDonnell, 2010). Also, a least-squares approach can identify thresholds during periods of low stormflow variability. For example, during dry years, the maximum observed total stormflow may be significant (> 5mm) but a threshold may not be obviously identified using visual methods.
To calculate breaks in slope, the data was iteratively divided into upper (su) and lower (sl)
subsets that varied in size from su=3 to su =n-3 conserving the total number of storms (n), so that su+sl=n. Within each iteration, a linear regression was computed for each subset using
18
4 RESULTS
4.1 Threshold Stormflow Response
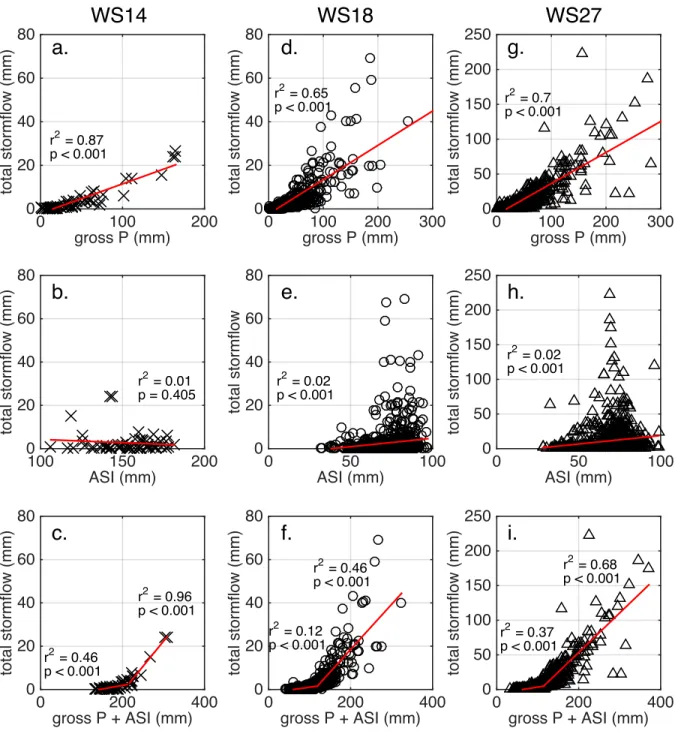
Total stormflow response from all three watersheds exhibit threshold behavior as a function of gross precipitation and ASI. Measurements made over 19 months in WS14 demonstrate a strong break in slope, as seen in Detty and McGuire (2010). Of the 67 storms observed occurring between July 2011 and January 2013, eight were not analyzed due to instrument outage of TDR and 11% of the remaining 59 storms showed significant stormflow response above 5 mm/day (Figure 4.1a-c). The maximum total stormflow peaked at 26.8 mm/day during the study period, which was notably smaller than long-term stormflow records from WS18 and WS27. Despite a smaller range in total storm discharge, gross precipitation was still significantly correlated (r2=0.87; Figure 4.1a) with stormflow independent of ASI, when fit with a simple linear regression. ASI showed no linear relationship with total stormflow (r2=0.01;
Figure 4.1b). Thresholds became more evident when ASI and gross storm precipitation were combined, which was consistent across all three watersheds.
19
than WS14. Stormflow in WS18 was linearly related to precipitation (Figure 4.1d) but had no linear correlation with ASI (Figure 4.1e), which was consistent with WS14. Over 15 years of measurements, ASI plotted against total stormflow showed no linear trends in either WS18 and WS27, but variability in stormflow runoff did increase at higher values of ASI (Figure 4.1e,h). When ASI is low, relatively smaller stormflows are produced than at mid- to high-values of ASI where stormflow is highly variable. Combining ASI and total precipitation created a strongly non-linear relationship.
A comparison of thresholds across all three watersheds shows an overall weaker
correlation in the long-term data (Figure 4.1c, f, i). Also, the multi-phase linear regression used to define threshold behavior showed stronger total correlations in data above the threshold when gross precipitation and ASI were combined, which is consistent with findings from Detty and McGuire (2010). Figure 4.1(c, f, i) shows the results of our threshold method applied to the sum of gross precipitation and ASI, where storms above and below the threshold are fit with
20
21
Figure 4.1. Summary of the storm event results where total stormflow is plotted as a function of (1) gross storm event precipitation (a, d, g), (2) antecedent soil moisture index (b, e, h), and (3) the sum of gross precipitation and ASI combined (c, f, i). Measurement period for WS14 is Jul. 2011-Jan. 2013 and for WS18/WS27 is Feb. 1999-Oct. 2014.
gross P (mm)
0 100 200
total stormflow (mm)
0 20 40 60 80
r2 = 0.87 p < 0.001
ASI (mm)
100 150 200
total stormflow (mm)
0 20 40 60 80
r2 = 0.01 p = 0.405
gross P + ASI (mm)
0 200 400
total stormflow (mm)
0 20 40 60 80
r2 = 0.46 p < 0.001
r2 = 0.96 p < 0.001
gross P (mm)
0 100 200 300
total stormflow (mm)
0 20 40 60 80
r2 = 0.65 p < 0.001
ASI (mm)
0 50 100
total stormflow 0 20 40 60 80
r2 = 0.02 p < 0.001
gross P + ASI (mm)
0 200 400
total stormflow (mm)
0 20 40 60 80
r2 = 0.12 p < 0.001
r2 = 0.46 p < 0.001
gross P (mm)
0 100 200 300
total stormflow (mm)
0 50 100 150 200 250
r2 = 0.7 p < 0.001
ASI (mm)
0 50 100
total stormflow (mm)
0 50 100 150 200 250
r2 = 0.02 p < 0.001
gross P + ASI (mm)
0 200 400
total stormflow (mm)
0 50 100 150 200 250
r2 = 0.37 p < 0.001
r2 = 0.68 p < 0.001
WS14
WS18
WS27
22 4.2 Temporal Dependence of Threshold Behavior
An analysis of soil moisture, precipitation, and discharge data over the 19 month period in WS14 show growing and dormant season shifts in thresholds that are not statistically
significant. The computed growing season threshold was 192 mm, whereas the dormant season threshold was 206 mm with standard deviations of 11.1 mm and 6.7, respectively (Figure 4.2). Total stormflows were larger in the growing season but storms producing significant runoff (> 5mm) were more numerous in the dormant season. Seasonal differences in the coefficients of determination showed stronger correlations in the growing season. In Figure 4.2, linear regressions were strongest above the threshold in both seasons. Relative differences between lower and upper slopes within each season were greatest during the growing season. Differences in slope for rainstorms below the threshold were not significantly different between seasons, but this was not the case for slopes above the threshold (growing season mu= 0.23; dormant season mu= 0.08).
Applying the same analysis to our 15 year dataset in WS18 and WS27, long-term stormflow response patterns diverge from observations in WS14. Unlike WS14, the maximum total stormflow observed was not significantly higher in the growing season and the average long-term thresholds were greatest during the dormant season (Figure 4.3). The magnitudes of stormflow response were comparable between seasons, however their average thresholds for the study period were roughly 118 mm in the dormant season and 103 mm in the growing season in WS18 and WS27. Like WS14, seasonal threshold differences were not significantly different. Correlation coefficients were computed for linear regressions above and below the threshold and for the total fit of all storms. Table 1.1 summarizes the number of storms with respect to
23
the dormant season had a greater proportion of storms above the threshold. WS18 had a greater number and proportion of storms below the threshold in both seasons, while WS27 had the highest proportion of storms above the threshold (41.3%). Correlation coefficients were similar in all watersheds and season ranging from 0.85 to 0.88.
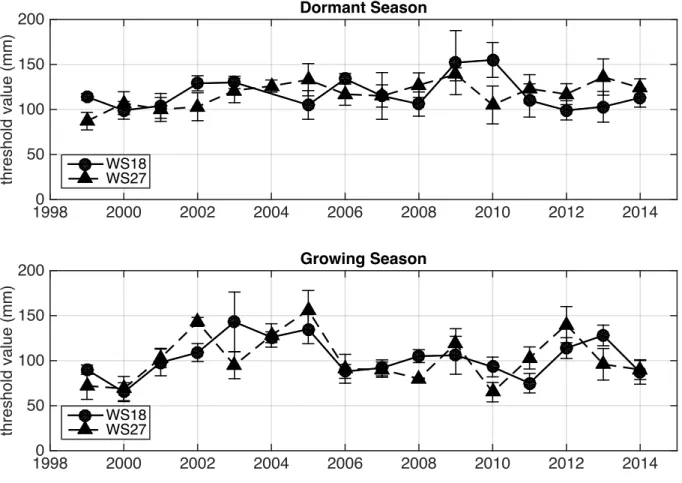
Figure 4.3 also shows that over a 15 year measurement period, the thresholds that define significant stormflow production vary interannually. This variation is greatest during the growing season and the most in WS27 (SD18,growing = 21.7 mm; SD27,growing = 27.5 mm). Interannual
thresholds during the dormant season are relatively more clustered (SD18,dormant = 18.1 mm;
SD27,dormant = 14.2 mm). Analyzing yearly thresholds through time reveal that WS18 and WS27
follow similar paths (Figure 4.5). In the dormant season, interannual variations are gradual and lack obvious trends, but during the growing season thresholds slightly trend upward from 2000 to 2005 and drop drastically in 2006. They remain low until they increase again in 2010 and 2011 for WS27 and WS18, respectively. This continues for two years after which they decline again.
24
Figure 4.2 Dormant (a) and growing (b) season response of total stormflow to gross precipitation and ASI in WS14 for the period 07/2011 to 1/2013. Threshold values are
represented by black vertical lines and storms on either side of the threshold are fit separately. Their respective r2 values and slopes (mu,l) are shown. (* p < 0.05, ** p < 0.01)
gross precipitation + ASI (mm)
0 100 200 300
total stormflow (mm)
0 10 20 30 40 50 60 70 80
r2 = 0.25*
ml = 0.02
r2 = 0.51*
mu = 0.08
192 mm
gross precipitation + ASI (mm)
0 100 200 300
total stormflow (mm)
0 10 20 30 40 50 60 70 80
r2 = 0.53**
m
l = 0.03
r2 = 0.96**
m
u = 0.23
25
Figure 4.3. Long-term growing and dormant season response of total stormflow to gross precipitation and ASI in WS18 (a, b) and WS27 (c, d) between 1999-2014. Thresholds are averaged over all years for each season (black line) and over each individual year (dashed line). The distribution of yearly thresholds is expanded above each plot to show their corresponding year.
gross precipitation + ASI (mm)
0 100 200 300
total stormflow (mm)
0 50 100 150 200 250
1999 2001 2002
2010 2000 2007 2006 2012 2003 2011 2014 2004 2008
2005 2013 2009
117.5 mm
gross precipitation + ASI (mm)
0 100 200 300
total stormflow (mm)
0 50 100 150 200 250 2010 2000 1999 2008 2007 2014 2006 2003 2013 2001 2011
2009 2004 2012
2002
2005
102.5 mm
gross precipitation + ASI (mm)
0 100 200 300
total stormflow (mm)
0 10 20 30 40 50 60 70 80 2000 2012 2013 2001 2005
2008 2011 2014
1999
2007 2002
2003
2006 2009 2010
2004 no data
117.9 mm
gross precipitation + ASI (mm)
0 100 200 300
total stormflow (mm)
0 10 20 30 40 50 60 70 80
2000 2011 2014
2006 1999 2007 2010 2001 2008 2009
2002 2012 2004
26
Table 4.1 Summary statistics from interannual threshold analysis in WS18 and WS27 for the average number of storms below the threshold (Sl), above the threshold (Su), and the combined
correlation coefficient when each subset is fit with a linear regression.
Dormant Season Growing Season
𝑺𝒍 𝑺𝒖 𝑹𝟐 𝑺𝒍 𝑺𝒖 𝑹𝟐
27
Figure 4.4 WS18 and WS27 long-term datasets restricted to the WS14 measurement period from July 2011 to January 2013. Storm events are separated into dormant season (a, c) and growing season (b, c) with linear regressions (solid red line) computed for storms below and above the threshold. Respective r2 (* p < 0.05, ** p < 0.01) and slopes (mu,l) of each regression are also
displayed.
gross precipitation + ASI (mm)
0 100 200 300
total stormflow (mm)
0 50 100 150 200 250
r2 = 0.41* ml = 0.13
r2 = 0.79** m
u = 0.48 116.3 mm
gross precipitation + ASI (mm)
0 100 200 300
total stormflow (mm)
0 50 100 150 200 250
r2 = 0.49** ml = 0.13
r2 = 0.86* mu = 0.89 150.7 mm
gross precipitation + ASI (mm)
0 100 200 300
total stormflow (mm)
0 10 20 30 40 50 60 70 80
r2 = 0.52** m
l = 0.03
r2 = 0.75** mu = 0.1
105.2 mm
gross precipitation + ASI (mm)
0 100 200 300
total stormflow (mm)
0 10 20 30 40 50 60 70 80
r2 = 0.69** m
l = 0.03
112.7 mm
WS18
WS27
c. d.
28
Figure 4.5. Dormant (a) and growing (b) season thresholds in WS18 (circles and solid line) and WS27 (triangles and dotted line) plotted as a timeseries.
1998 2000 2002 2004 2006 2008 2010 2012 2014
threshold value (mm)
0 50 100 150
200 Dormant Season
WS18 WS27
1998 2000 2002 2004 2006 2008 2010 2012 2014
threshold value (mm)
0 50 100 150
200 Growing Season
29
4.3 Long-term hydroclimate and threshold pattern variation
Variations in thresholds are correlated with recent meteorology but have no relationship with longer term hydroclimate. Figure 4.6 shows interannual threshold behavior as a function of seasonal hydroclimate. Significant positive correlations between threshold values and total seasonal rainfall persisted during the growing season and were strongest in WS18. Meanwhile, during the dormant season significant correlations between threshold and seasonal rainfall totals do not exist. In WS27, weak but significant correlation during the dormant season appears signifying catchment differences that are unique from WS18. In Figure 4.7, threshold values are plotted against the prior seasons’ rainfall total to show memory effects of moisture storage on rainfall-runoff relationships, however linear regressions did not show significant trends in WS18 or WS27 during the dormant or growing season.
30
Figure 4.6 Dormant and growing season response of rainfall-runoff thresholds to total seasonal rainfall in WS18 and WS27. Local phenology was determined for WS18 and WS27 separately following Hwang et al., 2011.
total seasonal rainfall (mm)
0 500 1000 1500
threshold value (mm)
40 60 80 100 120 140 160 180 200
r2 = 0.03 p = 0.56
r2 = 0.29 p = 0.032
Dormant Season
WS18
WS27
total seasonal rainfall (mm)
0 500 1000 1500
threshold value (mm)
40 60 80 100 120 140 160 180 200
r2 = 0.76 p < 0 r2 = 0.53
p = 0.001
Growing Season
WS18
31
Figure 4.7 Dormant and growing season threshold response to prior season precipitation in WS18 and WS27.
previous season precip (mm) 0 500 1000 1500
threshold value (mm)
40 60 80 100 120 140 160 180 200
r2 = 0.15 p = 0.173
r2 = 0.02 p = 0.598 Dormant Season
WS18
WS27
previous season precip (mm) 0 500 1000 1500
threshold value (mm)
40 60 80 100 120 140 160 180 200
r2 = 0.06 p = 0.369
r2 ~ 0 p = 0.922 Growing Season
WS18
32
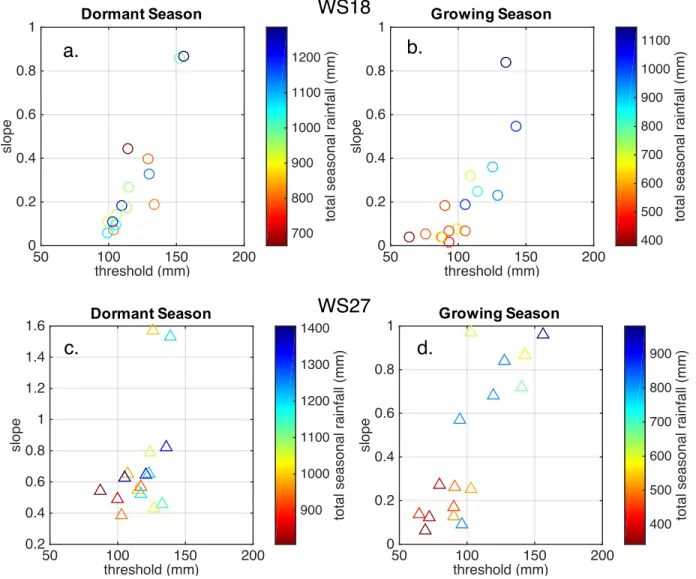
Figure 4.8. Interannual slope calculations of storms above the threshold identified for long-term dormant and growing season response in WS18 (a, b) and WS27 (c, d) between 1999-2014. Each point represents a single year and colors correspond to total seasonal rainfall.
threshold (mm)
50 100 150 200
slope 0.2 0.4 0.6 0.8 1 1.2 1.4 1.6
total seasonal rainfall (mm)
900 1000 1100 1200 1300 1400 threshold (mm)
50 100 150 200
slope 0 0.2 0.4 0.6 0.8 1
total seasonal rainfall (mm)
400 500 600 700 800 900 threshold (mm)
50 100 150 200
slope 0 0.2 0.4 0.6 0.8 1
total seasonal rainfall (mm)
700 800 900 1000 1100 1200 threshold (mm)
50 100 150 200
slope 0 0.2 0.4 0.6 0.8 1
total seasonal rainfall (mm)
33
5 DISCUSSION
5.1 Interannual variability in threshold dynamics
As in prior studies, our 15 year analysis of precipitation, soil moisture, and discharge data show that threshold relations are a function of antecedent soil moisture and total storm event precipitation at Coweeta, however we also found that thresholds vary with seasonal rainfall totals. When Detty and McGuire (2010) combined precipitation with antecedent soil moisture conditions to isolate threshold behavior during a single wet up period from August to January, they found stronger threshold definition than our long-term results, but were unable to look at multi-year relationships. Other long-term studies by Graham and McDonnell (2010) showed threshold response from 50 years of rainfall-runoff data was a result of pre-event wetness, however their study focused on identifying a single long-term threshold and did not directly account for interannual variability.
34
gradient from xeric to wet sites across the entire catchment, whereas WS27 has only a mesic and wet site.
Our interannual analysis also showed a greater response of stormflow with larger threshold values that covaried with climate during the growing season (Figure 4.6). During dry conditions, stormflow response above the threshold was relatively insensitive to changes in antecedent moisture and gross precipitation compared to wet periods. One hypothesis, is that dominant runoff generation mechanisms shift between seasons due to differences in the types of rainstorms. Our method does not allow us to explicitly distinguish between runoff mechanisms, but dormant period stormflow generation could reflect expanding variable source area, whereas during the growing season there is greater activation of the macropore network in accordance with seasonal storm intensity. Convective rain storms with high intensity precipitation are frequent in the summer months and transition to low intensity frontal storms in winter.
5.2 Drivers of threshold variation
The role of climate in structuring non-linear behavior supports previous short-term findings of stormflow response. However, our results suggest long-term climate does not
35
permeability. Longer drainage times between storms and greater PET increase thresholds, while low bedrock permeability decreases thresholds. Throughout Coweeta, bedrock permeability is low (Hewlett, 1961) and thus we assume it does not vary significantly interannually, leaving climate as the primary driver under this framework. The absence of fracture flow at Coweeta can be replaced by other mechanisms that contribute to both slow and fast runoff processes discussed in the next section.
Controlling for saturation deficit with ASI, our results show that shifting interannual thresholds may be in response to altered transpiration capacity of vegetation. Transpiration capacity is the total amount of water that can be transpired given the current state of the ecosystem. Recall that transpiration is responsible for over half of the annual water budget in Coweeta and removes a significant amount of water from the shallow subsurface – an important runoff generation zone in Coweeta (Hewlett and Hibbert, 1967). Small changes in transpiration capacity at the catchment scale may profoundly alter the amount of stormflow generation measured at the outlet. Figure 4.6 showed that thresholds have significant positive correlations with seasonal rainfall amounts only in the growing season. Because these correlations exist during the growing season when vegetation is most active, it suggests that the ecosystem capacity to transpire water may contribute to structuring rainfall-runoff relationships. In
particular, response and recovery of ecosystems to dry periods may reduce transpiration capacity resulting in increased stormflow with similar antecedent conditions and gross precipitation (Figure 5.1). If patterns observed in Figure 4.6 were solely an effect of our threshold estimation method, we would also expect similar strength relationships during the dormant period.
36
Bucci et al., 2005; Zweiniecki and Holbrook, 2009, Ford et al., 2010) modifying transpiration capacity across the catchment, which may account for positive trends in threshold values and seasonal rainfall observed in Figure 4.6. Recovery from survival mechanisms such as decreased leaf area (Grier and Running, 1977), early leaf senescence, abscission of fine roots (Maseda and Fernandez, 2006; Bucci et al., 2005), or in extreme cases emboli formation in xylem (Tyree and Sperry, 1989) can reduce transpiration rates even after drought subsides. In places like Coweeta, transpiration accounts for a large portion of rainfall (Swift et al., 1988), so reductions in
transpiration capacity can significantly alter runoff ratios. A conceptual representation of this effect is presented in Figure 5.1. Under various drought response mechanisms given identical antecedent soil moisture and rainfall depth, the amount of stormflow generated from an event would be relatively greater in ecosystems still recovering from dry periods than in those unaffected by a drought. Figure 5.1 shows this hypothetical increase in stormflow production under these reduced rates of transpiration capacity.
Ford et al. (2010) also showed that differences in xylem anatomy were responsible for how tree species responded to drought in Coweeta. We hypothesized that differences between ring-porous and diffuse-porous species would result in significantly different threshold responses with seasonal rainfall between WS18 and WS27 during the growing season. WS18 is dominated by ring-porous and semi-ring porous species, like oaks and hickories, which were observed to be less sensitive to changes in vapor pressure deficit, a short-term response, and appeared to recover from droughts more slowly, a long-term response (Ford et al., 2010). Slow recovery following dry periods in oak-hickory forests represent a loss of stem conductance and long-term
diffuse-37
porous dominated forests. WS27, a northern hardwood forest with diffuse-porous species, preserves stem conductance during drought through stomatal closure, but severe drought can lead to early leaf senescence and root abscission. WS27 could feasibly recover more quickly with the following growing season resulting in more stable transpiration capacities and less sensitivity of thresholds to seasonal rainfall. Patterns observed in Figure 4.6b do not show significant differences in their respective threshold sensitivity to seasonal rainfall. The lack of significance could result from several simultaneously occurring drought responses that are difficult to observe yet confound our results, including changes to leaf area, root distribution, and partial cavitation.
Vegetation-climate interactions span several timescales and thus we must consider both short- and long-term controls this relationship exerts on runoff production. Variability in
thresholds may be a result of differences in response mechanisms to dry periods and the length of time required to recover. Roughly half of all rainfall at Coweeta has the potential to be
evapotranspired, most of which occurs during the growing season. This underscores the
importance of transpiration capacity, both seasonally and interannually, on stormflow production particularly during and after dry periods. Our study period spanned two severe, multi-year droughts, that may have caused long-term reductions in transpiration capacity due to severe water stress response. Time-lagged recovery can create greater runoff response in wetter years following a drought.
38
growing season can cause a reduction in transpiration capacity lasting later into the season. Ford et al. (2010) observed that drought during the onset of leaf-out disproportionally affected oaks and hickories reducing transpiration even after the drought subsided. The effects of rainfall timing on transpiration capacity must be considered both seasonally and interannually, especially in mixed hardwood forests of the Southern Appalachians.
Other differences in catchment properties between WS18 and WS27, suggest an opposite correlation between thresholds and seasonal rainfall than what we observed. Referring to
39
40
5.3 Non-linearity and Runoff Generation Mechanisms
From our analysis, interannual variation of rainfall-runoff relationships manifests as simultaneous shifts in threshold and slope. Concomitant increases in threshold and steepening of slopes suggests that these relationships do not exhibit strict threshold behavior. Over several years or more, stormflow response to antecedent soil moisture and total precipitation forms a continuous, non-linear function. Subsetting the long-term data to specific years or seasons reveals well-defined thresholds, but even then these thresholds are not constant. Another
indication of non-linear stormflow response is the steepening of slopes in years with large storms or during the growing season when convective storms are common. If simple threshold behavior was uniquely defined, we would expect the slopes above the threshold to be similar, independent of storm size and seasonal wetness. Also, if positive correlations of slope and threshold were solely an effect from our method being sensitive to years with high rainfall, then we would observe this pattern in the dormant season, as well. While dormant season demonstrates a correlation between threshold and slope like the growing season, the effect of total seasonal rainfall is more random in WS18 and to some degree in WS27 (Figure 4.8).
41
describe differences in seasonal storm hydrographs as a result of variable source area dynamics. Greater winter wetness causes a dual peak hydrograph caused by initial rain falling on saturated areas near the stream that contribute directly to flow, while the second peak is driven by slower subsurface processes. More recently, studies have explicitly focused on hillslope connectivity and macropore flow networks as drivers of rapid stormflow response (Band et al., 2014). Yeakley et al. (1998) showed increased connectivity and subsurface drainage response to storm events when soil moisture was high prior to rainfall. This pattern was disrupted by interstorm transpiration, which highlights the importance of throughflow contribution to streamflow, especially in the root zone. In Coweeta, subsurface flow is believed to be responsible for stormflow (Hewlett and Hibbert, 1967), making soil water, and subsequently stormflow, in the shallow root zone susceptible to evapotranspiration. At the PMRW, significant trench flow was measured showing greater macropore flow with higher antecedent wetness (Tromp van Meerveld and McDonnell, 2006a,b). Additionally, stormflow continues after rainfall has ceased. During this recessional period, transpiration may be most active yielding strong seasonal differences in the receding limbs of dormant versus growing season hydrographs. Data from our 15 year analysis lacks small enough time steps to resolve differences in seasonal storm hydrographs. In WS14, 15-min interval soil moisture and discharge data can demonstrate differences in seasonal storm hydrographs but this analysis is beyond the scope of this paper. These runoff generation processes combine and scale across the entire catchment to form repeatable emergent patterns of rainfall and runoff that are affected by catchment properties and ecosystem response to climate but do not clearly exhibit simple threshold response.
42
thresholds allowed non-zero slopes to be calculated for storms occurring below the thresholds. Low slopes prior to the threshold, as opposed to zero slopes, represent gradual increases in stormflow response with increasing precipitation and antecedent moisture. These low slopes were demonstrated in our short-term analysis of WS14 (Figure 4.2) and persisted in our interannual analyses of WS18 and WS27. Representing low flow responses is especially important for storms that occur after relatively long interstorm periods with less total rainfall. These smaller storms occurring on drier hillslopes are likely activating slower processes with smaller variable source areas, generating modest stormflow. Slowly accelerating stormflow response with greater antecedent soil moisture and precipitation below the threshold may
indicate that variable source areas are expanding. Subsurface stormflow via preferential flowpath activation, pore pressure waves or flow at the soil-bedrock interface produce faster and greater stormflow responses but require wetter antecedent conditions. Our study design cannot directly discriminate between these processes but our long-term data indicate a complex integration of runoff generation mechanisms that create accelerating stormflow response with increased antecedent soil moisture and precipitation.
43
stormflow response (Tromp-van Meerveld and McDonnell, 2006a). However, the transition from low slope to high slope, as observed during the growing season in WS14 (Figure 4.2), was not observed as strongly in the long-term data due to interannual shifts in thresholds and slopes. This was not the case when the data was truncated to shorter time periods (Figure 4.4). Long
44
6 CONCLUSIONS
In this study, we showed that threshold behavior in stormflow response could be identified in Coweeta by characterizing hillslope wetness as the sum of total storm precipitation with antecedent soil moisture. The Southern Appalachian Region has experienced greater
hydroclimate variability, so non-stationarity in these emergent behaviors was also considered using a 15 year dataset of soil moisture, precipitation, and discharge from two watersheds. We also investigated the critical role of vegetation dynamics in threshold relationships by
considering them with respect to dormant and growing season. Transpiration relies on root-zone soil moisture in the shallow subsurface, which is also an important zone for runoff generation in Coweeta.
We tested four hypotheses that stated that (1) watersheds in Coweeta will display well-defined threshold behavior at short timescales but that this varied with long-term data, (2) thresholds would vary interannually with seasonal rainfall, (3) threshold response to seasonal rainfall would vary by dominant forest type and (4) vegetation-climate interactions would suggest non-stationarity and non-linear stormflow response over long measurement periods.
From the four posed hypotheses we concluded the following:
45
Seasonal variation between growing and dormant season produced lower thresholds in the growing season suggesting the importance of vegetation in structuring stormflow response.
(2) Interannual variation in thresholds is a function of hydroclimate potentially associated with shifting ecosystem transpiration capacity in the growing season. Transpiration capacity is the amount of water that can be transpired by an
ecosystem given its current state. Drought-driven impairment and delayed recovery of transpiration capacity may explain smaller thresholds in drier years. Future studies will examine how changes in transpiration capacity alter storm hydrographs at shorter timescales using 15-min interval data.
(3) Threshold sensitivity to seasonal rainfall did not show significant differences between catchments dominated by ring-porous versus diffuse-porous species. This was likely an effect of several confounding drought-response mechanisms influencing transpiration capacity.
(4) Threshold values were also positively correlated with slope computed for storms above the threshold suggesting non-linear stormflow response rather than a simple well-defined threshold.
46
47
REFERENCES
Band, L. E., Hwang, T., Hales, T. C., Vose, J., & Ford, C. (2012). Ecosystem processes at the watershed scale: Mapping and modeling ecohydrological controls of landslides.
Geomorphology. http://doi.org/10.1016/j.geomorph.2011.06.025
Band, L. E., McDonnell, J., Duncan, J. M., Barros, A., Bejan, A., Burt, T., et al. (2014). Ecohydrological flow networks in the subsurface. Ecohydrology, 7(4), 1073–1078.
http://doi.org/10.1002/eco.1525
Beven, K., & Germann, P. (1981). Water Flow in Soil Macropores II. A Combined Flow Model. Journal of Soil Science, 32(1), 15–29. http://doi.org/10.1111/j.1365-2389.1981.tb01682.x
Beven, K. J., & Germann, P. (2013). Macropores and water flow in soils revisited. Water Resources Research. http://doi.org/10.1029/WR018i005p01311/full
Bucci, S. J., Goldstein, G., Meinzer, F. C., Franco, A. C., Campanello, P., & Scholz, F. G. (2004). Mechanisms contributing to seasonal homeostasis of minimum leaf water potential and predawn disequilibrium between soil and plant water potential in Neotropical savanna trees. Trees, 19(3), 296–304. http://doi.org/10.1007/s00468-004-0391-2
Day, F. P., & Monk, C. D. (1974). Vegetation Patterns on a Southern Appalachian Watershed.
Ecology, 55(5), 1064–1074.
Day, F. P., Jr, Phillips, D. L., & Monk, C. D. (1988). Forest communities and patterns. Forest Hydrology and Ecology at Coweeta. http://doi.org/10.1007/978-1-4612-3732-7_10
Detty, J. M., & McGuire, K. (2010a). Threshold changes in storm runoff generation at a till-mantled headwater catchment. Water Resources Research, 46(7), n/a–n/a.
http://doi.org/10.1029/2009WR008102
Detty, J. M., & McGuire, K. (2010b). Topographic controls on shallow groundwater dynamics: implications of hydrologic connectivity between hillslopes and riparian zones in a till mantled catchment. Hydrological Processes, 24(16), 2222–2236.
http://doi.org/10.1002/hyp.7656
Dooge, J. C. I. (1986). Looking for hydrologic laws. Water Resources Research, 22(9S), 46S– 58S. http://doi.org/10.1029/WR022i09Sp0046S
Dunne, T., Moore, T. R., & Taylor, C. H. (1975). Recognition and prediction of runoff-producing zones in humid regions. Hydrol Sci Bull.
48
Elliott, K. J., & Vose, J. M. (2011). The contribution of the Coweeta Hydrologic Laboratory to developing an understanding of long-term (1934-2008) changes in managed and unmanaged forests. Forest Ecology and Management, 261(5), 900–910.
http://doi.org/10.1016/j.foreco.2010.03.010
Fatichi, S., Pappas, C., & Ivanov, V. (in review). Modelling plant-water interactions: an ecohydrological overview from the cell to the global scale. WIREs Water, 1–64.
Ford, C. R., Hubbard, R. M., & Vose, J. M. (2010). Quantifying structural and physiological controls on variation in canopy transpiration among planted pine and hardwood species in the southern Appalachians. Ecohydrology, 4(2), 183–195. http://doi.org/10.1002/eco.136
Freer, J., McDonnell, J., Beven, K. J., Peters, N. E., Burns, D. A., Hooper, R. P., et al. (2002). The role of bedrock topography on subsurface storm flow. Water Resources Research,
38(12), –5–16. http://doi.org/10.1029/2001WR000872
Gholz, H. L. (1982). Environmental Limits on Aboveground Net Primary Production, Leaf Area, and Biomass in Vegetation Zones of the Pacific Northwest. Ecology, 63(2), 469–481.
http://doi.org/10.2307/1938964?ref=no-x-route:2aee91b2a90827915960a697d2dc2a6f
Graham, C. B., & McDonnell, J. (2010). Hillslope threshold response to rainfall:(2) Development and use of a macroscale model. Journal of Hydrology.
http://doi.org/10.1016/j.jhydrol.2010.03.008
Grayson, R. B., Western, A. W., & Chiew, F. (1997). Preferred states in spatial soil moisture patterns: Local and nonlocal controls. Water Resources Research.
http://doi.org/10.1029/97WR02174
Grier, C. C., & Running, S. W. (1977). Leaf Area of Mature Northwestern Coniferous Forests - Relation to Site Water-Balance. Ecology, 58(4), 893–899.
Grimm, N. B., Faeth, S. H., Golubiewski, N. E., & Redman, C. L. (2008). Global change and the ecology of cities. Science. http://doi.org/10.1126/science.1150195
Hacke, U. G., Stiller, V., Sperry, J. S., Pittermann, J., & McCulloh, K. A. (2001). Cavitation fatigue. Embolism and refilling cycles can weaken the cavitation resistance of xylem. Plant Physiology, 125(2), 779–786. http://doi.org/10.1104/pp.125.2.779
Haga, H., Matsumoto, Y., & Matsutani, J. (2005). Flow paths, rainfall properties, and antecedent soil moisture controlling lags to peak discharge in a granitic unchanneled catchment. Water Resources Research. http://doi.org/10.1029/2005WR004236
Hales, T. C., Ford, C. R., Hwang, T., & Vose, J. M. (2009). Topographic and ecologic controls on root reinforcement. Journal of Geophysical Research: Earth Surface (2003–2012),
49
Hatcher, R. D. (1988). Bedrock Geology and Regional Geologic Setting of Coweeta Hydrologic Laboratory in the Eastern Blue Ridge. In W. T. Swank & D. A. Crossley (Eds.), Forest Hydrology and Ecology at Coweeta (Vol. 66, pp. 81–92). New York, NY: Springer New York. http://doi.org/10.1007/978-1-4612-3732-7_5
Hewlett, J. D. (1961). Soil moisture as a source of base flow from steep mountain watersheds. Hewlett, J. D., & Hibbert, A. R. (1963). Moisture and energy conditions within a sloping soil
mass during drainage. Journal of Geophysical Research.
Hewlett, J. D., & Hibbert, A. R. (1967). Factors affecting the response of small watersheds to precipitation in humid areas. Forest Hydrology.
Hewlett, J. D., & Nutter, W. L. (1970). The varying source area of streamflow from upland basins, Symposium of Interdisciplinary Aspects of Watershed Management. American Society of Civil Engineers.
Horton, J. H., & Hawkins, R. H. (1965). Flow Path of Rain From the Soil Surface to the Water Table. Soil Science, 100(6), 377–383. http://doi.org/10.1097/00010694-196512000-00001
Hwang, T., Band, L. E., Miniat, C. F., Song, C., Bolstad, P. V., Vose, J. M., & Love, J. P. (2014). Divergent phenological response to hydroclimate variability in forested mountain watersheds. Global Change Biology, 20(8), 2580–2595. http://doi.org/10.1111/gcb.12556
Hwang, T., Song, C., & Vose, J. M. (2011). Topography-mediated controls on local vegetation phenology estimated from MODIS vegetation index. Landscape Ecology, 26(4), 541–556.
http://doi.org/10.1007/s10980-011-9580-8
Laseter, S. H., Ford, C. R., Vose, J. M., & Swift, L. W. (2012). Long-term temperature and precipitation trends at the Coweeta Hydrologic Laboratory, Otto, North Carolina, USA.
Hydrology Research, 43(6), 890. http://doi.org/10.2166/nh.2012.067
Maseda, P. H., & Fernández, R. J. (2006). Stay wet or else: three ways in which plants can adjust hydraulically to their environment. Journal of Experimental Botany, 57(15), 3963–3977.
http://doi.org/10.1093/jxb/erl127
McDonnell, J., Vaché, K., Dunn, S. M., Grant, G. E., Haggerty, R., Hinz, C., et al. (2007). Moving beyond heterogeneity and process complexity: A new vision for watershed hydrology. Water Resources Research, 43(7). http://doi.org/10.1029/2006WR005467
McGuire, K., McDonnell, J., Weiler, M., Kendall, C., Welker, J. M., & Seibert, J. (2005). The role of topography on catchment-scale water residence time. Water Resources Research,
41(5), n/a–n/a. http://doi.org/10.1029/2004WR003657
50
Penna, D., Meerveld, H. J., & Gobbi, A. (2011). The influence of soil moisture on threshold runoff generation processes in an alpine headwater catchment. Hydrology and Earth System Sciences. http://doi.org/10.5194/hess-15-689-2011
Pettyjohn, W. A., & Henning, R. (1979). Preliminary estimate of ground-water recharge rates, related streamflow and water quality in Ohio. Water Resources Center.
Rosenbaum, U., Bogena, H. R., & Herbst, M. (2012). Seasonal and event dynamics of spatial soil moisture patterns at the small catchment scale. Water Resources Research.
http://doi.org/10.1029/2011WR011518
Sivapalan, M. (2003a). Prediction in ungauged basins: a grand challenge for theoretical hydrology. Hydrological Processes, 17(15), 3163–3170. http://doi.org/10.1002/hyp.5155
Sivapalan, M. (2003b). Process complexity at hillslope scale, process simplicity at the watershed scale: is there a connection? Hydrological Processes, 17(5), 1037–1041.
http://doi.org/10.1002/hyp.5109
Swank, W. T., & Crossley, D. A., Jr. (1988). Introduction and site description. In Forest Hydrology and Ecology at Coweeta. Springer Verlag.
Swift, L. W., Jr, Cunningham, G. B., & Douglass, J. E. (1998). Climatology and Hydrology. In
Forest Hydrology and Ecology at Coweeta (pp. 1–22). Springer Verlag.
Tetzlaff, D., McDonnell, J., Uhlenbrook, S., McGuire, K., Bogaart, P. W., Naef, F., et al. (2008). Conceptualizing catchment processes: simply too complex? Hydrological Processes, 22(11), 1727–1730. http://doi.org/10.1002/hyp.7069
Tromp van Meerveld, H. J., & McDonnell, J. (2006). Threshold relations in subsurface stormflow: 1. A 147-storm analysis of the Panola hillslope. Water Resources Research.
http://doi.org/10.1029/2004WR003778
Tromp-van Meerveld, H. J., & McDonnell, J. J. (2006). Threshold relations in subsurface stormflow: 2. The fill and spill hypothesis. Water Resources Research, 42(2), n/a–n/a.
http://doi.org/10.1029/2004WR003800
Tromp-van Meerveld, H. J., Peters, N. E., & McDonnell, J. (2007). Effect of bedrock
permeability on subsurface stormflow and the water balance of a trenched hillslope at the Panola Mountain Research Watershed, Georgia, USA. Hydrological Processes, 21(6), 750– 769. http://doi.org/10.1002/hyp.6265
Tyree, M. T., & Sperry, J. S. (1989). Vulnerability of Xylem to Cavitation and Embolism.
Annual Review of Plant Physiology and Plant Molecular Biology, 40(1), 19–36.
51
Uchida, T., Tromp van Meerveld, I., & McDonnell, J. (2005). The role of lateral pipe flow in hillslope runoff response: an intercomparison of non-linear hillslope response. Journal of Hydrology, 311(1-4), 117–133. http://doi.org/10.1016/j.jhydrol.2005.01.012
Velbel, M. A. (1988). Weathering and Soil-Forming Processes. In W. T. Swank & D. A. Crossley (Eds.), Forest Hydrology and Ecology at Coweeta (Vol. 66, pp. 93–102). New York, NY: Springer New York. http://doi.org/10.1007/978-1-4612-3732-7_6
Vörösmarty, C. J., Green, P., Salisbury, J., & Lammers, R. B. (2000). Global water resources: Vulnerability from climate change and population growth. Science, 289(5477), 284–288. Western, A. W., & Blöschl, G. (1999). On the spatial scaling of soil moisture. Journal of
Hydrology, 217(3-4), 203–224. http://doi.org/10.1016/S0022-1694(98)00232-7
Western, A. W., Grayson, R. B., & Blöschl, G. (2002). Scaling of Soil Moisture: A Hydrologic Perspective. Annual Review of Earth and Planetary Sciences, 30(1), 149–180.
http://doi.org/10.1146/annurev.earth.30.091201.140434
Whittaker, R. H. (1956). Vegetation of the Great Smoky Mountains. Ecological Monographs,
26(1), 1–69.
Wooten, R. M., Gillon, K. A., Witt, A. C., Latham, R. S., Douglas, T. J., Bauer, J. B., et al. (2008). Geologic, geomorphic, and meteorological aspects of debris flows triggered by Hurricanes Frances and Ivan during September 2004 in the Southern Appalachian Mountains of Macon County, North Carolina (southeastern USA). Landslides, 5(1), 31–44.
http://doi.org/10.1605/01.301-0007545642.2009
Yeakley, J. A., Swank, W. T., & Swift, L. W. (1998). Soil moisture gradients and controls on a southern Appalachian hillslope from drought through recharge. Hydrology & Earth System Sciences.
Zwieniecki, M. A., & Holbrook, N. M. (2009). Confronting Maxwell's demon: biophysics of xylem embolism repair. Trends in Plant Science.Band, L. E., Hwang, T., Hales, T. C., Vose, J., & Ford, C. (2012). Ecosystem processes at the watershed scale: Mapping and modeling ecohydrological controls of landslides. Geomorphology.