Elizabeth McClure is a predoctoral trainee at the Carolina Population Center and Department of Epidemiology, University of North Carolina at Chapel Hill. Lydia Feinstein is an epidemiologist at Social & Scientific Systems, Inc. Sara Ferrando- Martínez is a scientist at MedImmune. Manuel Leal is faculty at the Laboratory of Immu-novirology, Clinic Unit of Infectious Diseases, Microbiology and Preventive Medicine, Institute of Biomedicine of Seville, IBiS, Virgen del Rocio University Hospital, Seville, Spain. Sandro Galea is dean of the Boston Univer-sity School of Public Health. Allison E. Aiello is faculty at the Carolina Population Center and Department of Epidemiology, University of North Carolina at Chapel Hill.
© 2018 Russell Sage Foundation. McClure, Elizabeth, Lydia Feinstein, Sara Ferrando- Martínez, Manuel Leal, Sandro Galea, and Allison E. Aiello. 2018. “The Great Recession and Immune Function.” RSF: The Russell Sage Foundation Journal of the Social Sciences 4(4): 62–81. DOI: 10.7758/RSF.2018.4.4.04. Direct correspondence to: Elizabeth McClure at [email protected]; and Allison E. Aiello at [email protected], 2101C Mcgavran- Greenberg Hall, CB #7435, Chapel Hill, NC 27599.
Open Access Policy: RSF: The Russell Sage Foundation Journal of the Social Sciences is an open access journal. This article is published under a Creative Commons Attribution- NonCommercial- NoDerivs 3.0 Unported Li-cense.
conditions during the Great Recession, it is not surprising that emerging evidence has linked economic stressors over this period to a range of negative health outcomes, including de-creases in self- rated health, poor mental health, and substance abuse (Burgard, Seefeldt, and Zelner 2012; Riumallo- Herl et al. 2014; Mulia et al. 2014; Bacigalupe and Escolar- Pujolar 2014; McLaughlin et al. 2012; Tsai 2015; Cagney et al. 2014; Pollack et al. 2011). Other sources of stress
The Great Recession and
Immune Function
elizabeth mcclure, lydia feinstein, sar a ferr ando-
martínez, manuel leal, sandro galea, and
allison e. aiello
The Great Recession precipitated unprecedented home foreclosures increases, but documentation of related neighborhood changes and population health is scant. Using the Detroit Neighborhood Health Study (N = 277), we examined associations between neighborhood- level recession indicators and thymic function, a life course immunological health indicator. In covariate- adjusted multilevel models, each 10 percentage point increase in abandoned home prevalence and 1 percentage point increase in 2009 home foreclosures was as-sociated with 1.7- year and 3.3- year increases in thymic aging, respectively. Associations attenuated after adjustment for neighborhood- level social cohesion, suggesting community ties may buffer recession- related immune aging. Effects of neighborhood stressors were strongest in middle- income households, supporting theory of excess vulnerability in this group. Future research should assess whether ongoing foreclosure and blight reduction efforts improve health for residents of recession impacted neighborhoods.
Keywords: neighborhood, social determinants of health, Detroit, immunity, immunosenescence, thymic function
were likely experienced at the community level. One of the most profound impacts was a steep rise in home foreclosures that fueled a prolif-eration of abandoned homes across the coun-try. Despite the magnitude of home vacancies that followed the economic downturn, little is known about how this fundamental change in the neighborhood physical environment has impacted the health of residents in highly af-fected communities.
The economic impact of the Great Recession was especially profound in the state of Michi-gan: in the wake of the crisis, the unemploy-ment rate doubled from an average of 6 percent before the crisis (2000–2007) to approximately 14 percent by 2009 (Bureau of Labor Statistics 2015). Even among residents fortunate enough to retain their jobs, many faced steep declines in asset values, including homes and equities. Indeed, median home values fell nearly 30 per-cent from their pre- crisis peak, and between 2005 and 2010 more than four hundred thou-sand residential units in both urban and rural areas faced a foreclosure auction filing (Michi-gan Foreclosure Task Force 2016). Although economic conditions worsened across the state, Detroit’s economy was suffering before the Great Recession. Relative to its population peak in 1950, Detroit lost half of its residents by the beginning of the recession (Sugrue 2014). Detroit’s history of racial segregation and in-dustrial losses before the Great Recession uniquely left many neighborhoods in the city of Detroit particularly vulnerable to home fore-closures and other economic stressors (Lichter, Parisi, and Taquino 2015).
The quality of the neighborhood physical environment is increasingly being implicated as a key determinant of population health (Kawachi and Berkman 2003). Indeed, poor neighborhood physical environments contrib-ute to the degradation of communities in the form of increased exposure to violence and re-ductions in social cohesion, both of which have been linked to negative health outcomes (Smith et al. 1998; Diez Roux et al. 2001; Giurgescu et al. 2015; Drukker and van Os 2003; Kruger, Reis-chl, and Gee 2007; Curry, Latkin, and Davey- Rothwell 2008; Tonorezos et al. 2008; Wilson- Genderson and Pruchno 2013; Blair et al. 2014).
To date, the biological mechanisms through
which the neighborhood environment influ-ences health are poorly understood (Steptoe and Marmot 2002). Prior studies linking individual- level socioeconomic stressors to de-creased immune response (Dhabhar 2014; Dowd and Aiello 2009) suggest that the im-mune system may be an important biological pathway for understanding how neighborhood- level economic stressors may affect health (Steptoe 2012). Nonetheless, few studies have incorporated salient immunological biomark-ers into population- based research on the so-cial determinants of health. This dearth of re-search has made it difficult to examine the role of the immune systems as a central biological barometer of exposure to stressors. Studies ex-amining neighborhood- level social determi-nants and immune function are currently lim-ited to downstream immune biomarkers, such as indicators of elevated levels of inflammation and antibodies to cytomegalovirus infection (Keita et al. 2014; Lantos et al. 2015; Ford and Browning 2015).
particular community- level characteristics through which the neighborhood physical en-vironment may influence stress- related immu-nological alterations, or whether individual characteristics may buffer these area- level in-fluences with regard to immune function.
The need and the opportunity to under-stand the mechanisms through which area- level economic stressors affect population health are pressing. We conducted the first analysis of this type using data from the Detroit Neighborhood Health Study (DNHS), a population- based cohort study of primarily Af-rican AmeAf-rican adults that began data collec-tion in 2008, near the very beginning of the eco-nomic downturn. The purpose of this study was to begin to develop hypotheses for the mecha-nisms through which the social environment affects health through the immune system. Fig-ure 1 presents a conceptual model informed by the population health evidence and theory de-scribed, which suggests that immune function may be sensitive to acute and chronic neighborhood- level economic stress. Further, it shows two pathways through which these area- level stressors are embodied in dimin-ished immune function—increased exposure to crime and decreased social cohesion. Finally, the literature indicates that individual socio-economic status may buffer the negative im-pacts of area- level stressors on immune func-tion, but none of the pathways shown has been assessed analytically. We hypothesized that
liv-ing in a neighborhood with a higher prevalence of abandoned homes and home foreclosures would be associated with lower thymic func-tion, in part due to increased exposure to neigh-borhood crime and loss of neighneigh-borhood social cohesion. Further, because evidence suggests that the Great Recession was particularly harm-ful to those with middle- class incomes (Acker-man, Fries, and Windle 2012), we additionally hypothesized that low- and high- income indi-viduals would be less susceptible to effects of increases in foreclosures or abandoned homes, resulting in smaller decreases in thymic func-tion, whereas middle- income individuals would experience the largest decrease in thy-mic function.
Motivated by our conceptual model, we first assessed the association between neighborhood- level environmental stressors associated with the Great Recession—including the prevalence of abandoned homes and home foreclosures— and thymic function; second, we characterized the roles of neighborhood crime and social co-hesion as potential mediators of these associa-tions; and third, we determined whether the effects of increases in foreclosures and aban-doned homes on thymic function were modi-fied by individual- level socioeconomic status.
meThodS
The DNHS was conducted in five waves from 2008 to 2013. In the first study wave (2008–2009), 1,547 participants were recruited using a two- Figure 1. Conceptual Model, Neighborhood Economic Stressors on Immune Function
Source: Authors’ calculations.
Vulnerability by individual income Low
High
Low
Low Middle High
Income Neighborhood economic
stressors
Social cohesion Crime
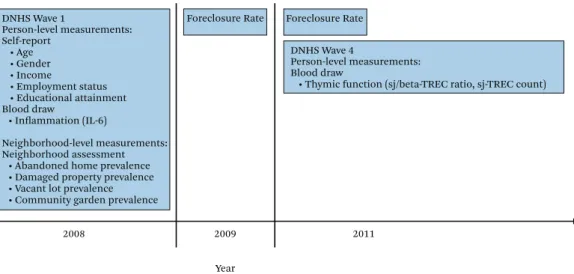
stage area probability sample of households in the city limits (Goldmann et al. 2011). A tele-phone survey captured participants’ demo-graphic and socioeconomic information, health characteristics, social support, and ex-posure to trauma. In addition to the telephone survey, participants also had the option to pro-vide a venous blood sample at their homes. Par-ticipants for whom thymic function was as-sessed and for whom complete residential location and covariate information was avail-able were eligible for inclusion in the present analysis, resulting in a final sample size of 277. Figure 2 summarizes the DNHS study design and timing of each measurement described.
Measures
Of Detroit’s fifty- four historically defined neigh-borhoods, fifty- two included DNHS study par-ticipants with available data for analysis (Hill and Gallagher 2002). We used these historically defined neighborhoods as the boundaries for neighborhood analyses. To capture character-istics of the neighborhood physical and social environment, a baseline neighborhood assess-ment was conducted by trained observers in 2008, many of whom were Detroit residents (Momper et al. 2012). Observers were assigned road sections for direct observation and as-sessed the presence of environmental factors, like abandoned homes (yes or no), on each
street segment. Areas not directly assessed were assigned a value using spatial kriging of the di-rectly assessed areas, as previously done in spa-tial analyses of urban environment (Auchin-closs et al. 2007). The scores for each indicator were aggregated to the neighborhood level, with the prevalence measure representing the pro-portion of block segments in the neighborhood for which the answer to the abandoned homes question was yes (Momper et al. 2012). Other indicators of physical environmental quality— prevalence of damaged properties, vacant lots, and community gardens—were also measured as part of the neighborhood assessment. The score for each indicator was assessed indepen-dently and as a combined physical environmen-tal quality score, all measured continuously at the neighborhood level for the present analysis. Community garden prevalence was reverse coded for the composite score.
The number of foreclosed properties in 2009 and 2011 by census tract were obtained from RealtyTrac, an authoritative source for historic United States real estate statistics and foreclo-sure trends (RealtyTrac 2011). Proportions were constructed as number of foreclosed properties divided by the number of total mortgages in each year within neighborhoods. The tion for each year and the change in propor-tions between 2009 and 2011 was assessed in relation to thymic function.
Figure 2. Timeline for Relevant Measurements, Detroit Neighborhood Health Study
Source: Authors’ calculations from the Detroit Neighborhood Health Study, 2008–2013. DNHS Wave 1
Person-level measurements: Self-report
• Age • Gender • Income
• Employment status • Educational attainment Blood draw
• Inflammation (IL-6)
Neighborhood-level measurements: Neighborhood assessment
• Abandoned home prevalence • Damaged property prevalence • Vacant lot prevalence • Community garden prevalence
Foreclosure Rate Foreclosure Rate
DNHS Wave 4
Person-level measurements: Blood draw
• Thymic function (sj/beta-TREC ratio, sj-TREC count)
2008 2009 2011
Outcome: Thymic Function
Participant DNA was extracted from venous whole blood samples, frozen and stored at −70°C, and shipped on dry ice to the Labora-tory of Immunovirology at the University of Se-ville for thymic function quantification. T- cell receptor (TCR) excision circles (TRECs) are nonreplicated extrachromosomal DNA by- products of alpha (signal joint) and beta chain TCR rearrangements that occur during the pro-duction of new T- cells (Lynch and Sempowski 2013). In this analysis, thymic function was measured by the ratio of signal joint to beta TRECs (sj/beta- TREC ratio). The sj/beta- TREC ratio was assessed in genomic DNA and analy-ses included a two- round quantitative PCR (qPCR) protocol, which is described in various studies (Ferrando- Martínez et al. 2010, 2013; Feinstein et al. 2016). The thymus is located near the heart, so direct measurement of its function is clinically contraindicated. The quantification of sjTREC is a more widely used indirect measurement of thymic function than the sj/beta- TREC ratio (Douek et al. 1998; Dion et al. 2007). However, sjTREC may be diluted by proliferation of naïve T- cells in peripheral blood, which can result in a reduction in num-ber of sjTREC without a reduction in thymic function (Dion et al. 2004). The sj/beta- TREC ratio measure, used in this analysis, was devel-oped to address the issue because it enables more direct estimation of intrathymic prolif-eration of T- cells, with regard to peripheral ac-tivity (Dion et al. 2004; Ferrando- Martínez et al. 2010). Thymic function was assessed in blood collected during the fourth study wave (2011) and is treated here as a continuous outcome, natural log- transformed to approximate a nor-mal distribution.
Covariates
Neighborhood levels of social cohesion and crime were examined as potential mediators of the association between the prevalence of abandoned homes and thymic function. Social cohesion was assessed in the first study wave by asking respondents whether they agreed on a 5- point Likert scale (1 = strongly disagree, 5 = strongly agree) with a series of statements re-lated to whether their neighborhood is unified,
residents are willing to help each other, neigh-bors get along, neighneigh-bors share common val-ues, and neighbors can be trusted (McLaughlin et al. 2012). Responses were summed for each respondent, averaged at the neighborhood level, and treated as continuous scores out of 100, such that lower scores represent a lower degree of social cohesion.
Neighborhood crime levels were assessed using geocoded crime incidents occurring from January 1, 2009, through December 31, 2009, extracted from the Detroit Police Department’s CrisNet/NetRMS records management system (Detroit Police Department 2009). Incidents with valid geocodes were summed at the neigh-borhood level and modeled in the present anal-ysis as number of incidents per square mile, weighted for neighborhood population density.
Age, gender (male or female), baseline im-munological status, and socioeconomic status were identified a priori as potential confound-ers via a directed acyclic graph (Greenland, Pearl, and Robins 1999) and included as covari-ates in adjusted models. Because thymic func-tion was available only in wave 4, we quantified and controlled for a proxy for immunological status which was measured at the time of the baseline survey, serum levels of Interleukin- 6 (IL- 6), a marker of inflammation (DelaRosa et al. 2006; Hunter and Jones 2015) that has been shown to strongly predict thymic function in the DNHS population (Feinstein et al. 2016). Employment status at the time of the baseline survey was included as a marker of socioeco-nomic status and categorized into three levels: employed, unemployed, and other (such as re-tired, homemaker, student, on maternity or pa-ternity leave, sick leave, and on disability). Ad-ditional indicators of socioeconomic status collected at baseline included education, di-chotomized as high school or less versus be-yond high school, and an ordinal indicator of household income (less than $25,000, $25,000 to less than $50,000, or $50,000 or more per year).
Statistical Analyses
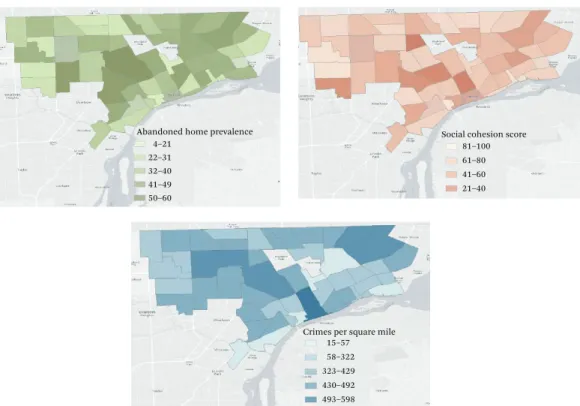
continuous variables. Counts and percentages were assessed for categorical variables. We used descriptive spatial analyses to generate maps displaying the unadjusted foreclosure preva-lences, prevalence of abandoned homes, social cohesion scores, and population- density weighted crime incidents per square mile by neighborhood.
Two- level random intercept linear regres-sion models, with participants nested within neighborhoods, were used to estimate the as-sociation between neighborhood prevalence of abandoned homes and thymic function (Sub-ramanian and O’Malley 2010). Next, analyses were conducted to assess whether changes in proportion of homes foreclosed during the Great Recession influence thymic function. Models were run to examine the association between thymic function and neighborhood foreclosure proportions in 2009, 2011, and the change in proportion between these two peri-ods. To further untangle the specificity of the foreclosure effect, we examined three addi-tional neighborhood physical quality measures in relation to thymic function—prevalence of damaged properties, vacant lots, and commu-nity gardens—as well as a composite measure derived as a sum of all four exposures, with the community gardens prevalence reverse coded. Models were first adjusted only for participant age and then additionally sex, baseline immu-nological status, and employment status. Age was modeled in all analyses using a four- node cubic spline to better fit any curvature in the age- thymic function relationship (Howe et al. 2011).
To assess whether neighborhood levels of social cohesion and crime mediated the asso-ciations of both 2009 prevalence of foreclosures and neighborhood prevalence of abandoned homes with thymic function, we first examined the extent to which these potentially mediating variables were independently associated with neighborhood foreclosures and abandoned homes, as well as with thymic function. We then examined whether the overall association of foreclosures and neighborhood prevalence of abandoned homes with thymic function was attenuated by additionally adjusting for social cohesion, then crime.
To assess effect modification by individual- level socioeconomic status, we then examined the associations between neighborhood aban-doned home prevalence as well as neighbor-hood foreclosure measurement and participant thymic function in analyses stratified by annual household income level (less than $25,000, $25,000 to less than $50,000, or $50,000 or more per year). A separate model was run for each stratum, adjusting for age, sex, and baseline immunological status. Statistical significance of modification was tested with an interaction term in the full model between income and each exposure (abandoned home prevalence and neighborhood foreclosures).
Spatial analyses and aggregation were com-pleted in ArcMaps 10.3.1 (Environmental Sys-tems Research Institute, Redlands, CA). All other statistical analyses were conducted in SAS 9.4 (SAS Institute, Inc.).
Sensitivity Analyses
We conducted a sensitivity analysis using the absolute number of sjTREC per million whole blood, rather than sj/beta- TREC ratio as the outcome. The sjTREC number remains the most commonly applied measure of thymic function in the literature (Douek et al. 1998; Dion et al. 2007). It may have logistical advan-tages for application in large- scale population- based studies compared to the sj/beta- TREC ratio, which requires a more extensive labora-tory methodology for analysis (Lynch et al. 2009). We also tested associations using base-line IL- 6 as the outcome.
To determine whether our overall models were sensitive to the marker of socioeconomic status included, we examined the association between neighborhood prevalence of aban-doned homes and thymic function as mea-sured by the sj/beta- TREC ratio adjusting for education and then household income instead of employment status.
reSulTS
Overall, participants were a median of fifty- six years old (IQR: forty- seven to sixty- seven years), had a median IL- 6 measure of 3 pg/mL (IQR: 2–4 pg/mL), 61 percent were female, 35 percent were currently employed, 14 percent were unemployed, and 51 percent were retired, students, homemakers, or other (employment status). The median neighborhood prevalence of abandoned homes was 34 percent (IQR: 23 to 45 percent), that of damaged properties was 33 percent (IQR: 25 to 42 percent), vacant lots was 30 percent (IQR: 13 to 52 percent), and community gardens was 0 percent (IQR: 0 to 1 percent). Median neighborhood foreclosure
proportion was 3 percent (IQR: 2 to 4 percent) in 2009 and 2 percent (IQR: 1 to 2 percent) in 2011. The median change in foreclosure pro-portion between 2011 and 2009 was –1 (IQR: –2 to 0) percentage points. Participants living in areas with a higher prevalence of aban-doned homes (more than 15 percent) were more likely to be unemployed than those liv-ing in a neighborhood with a lower prevalence of abandoned homes (16 percent versus 3 per-cent unemployed, respectively). Those living in areas with a higher prevalence of aban-doned homes were also slightly younger and more likely to be male. Respondents living in Table 1. Sample Characteristics by Prevalence of Abandoned Homes, Detroit Neighborhood
Health Study
Measure
Full Sample (N = 277)
Prevalence < 15% (N = 125)
Prevalence > 15% (N = 152)
Age, median (IQR) 56 (47–67) 59 (53–71) 56 (47–66)
Female, N (%) 167 (61) 74 (69) 93 (61)
Employed, N (%) 96 (35) 11 (32) 85 (35)
Unemployed, N (%) 39 (14) 1 (3) 38 (16)
Other employment status, N (%)a 142 (51) 22 (65) 120 (49)
Interleukin 6 (IL-6), median (IQR) 3 (2–4) 4 (2–5) 3 (2–5)
Neighborhood prevalence of abandoned homes, median (IQR)
34 (23–45) 14 (9–14) 35 (28–45)
Neighborhood prevalence of damaged properties, median (IQR)
33 (25–42) 14 (5–16) 38 (29–43)
Neighborhood prevalence of vacant lots, median (IQR)
30 (13–52) 6 (2–13) 33 (15–53)
Neighborhood prevalence of community gardens, median (IQR)
0 (0–1) 0 (0–0) 0 (0–1)
Neighborhood foreclosure prevalence 2009, median (IQR)
3 (2–4) 2 (1–3) 3 (2–5)
Neighborhood foreclosure prevalence 2011, median (IQR)
2 (1–2) 2 (1–2) 2 (1–2)
Neighborhood foreclosure rate change 2009– 2011, median (IQR)
–1 (–2–0) –2 (–3–1) 1 (–1–2)
Neighborhood social cohesion score, median (IQR)
52 (40–60) 60 (48–72) 48 (36–60)
Crimes per square mile, median (IQR) 436 (374–516) 436 (369–492) 587 (410–593) sj/beta-TREC ratio, median (IQR) 5 (1–19) 5 (1–19) 5 (1–18)
Source: Authors’ calculations from the Detroit Neighborhood Health Study, 2008, and Detroit Police Department 2009.
neighborhoods with a lower prevalence of abandoned homes were more likely to live in areas with greater social cohesion (60 percent versus 48 percent) and less crime (436 versus 587 crimes per square mile), damaged proper-ties (14 percent versus 38 percent), vacant lots (6 percent versus 33 percent), and foreclosures in 2009 (2 versus 3 percent) than respondents living in neighborhoods with more abandoned homes. Measured characteristics in our sam-ple differed slightly from those in the entire study population at wave 1. Our study sample had an older median age and a larger propor-tion female, unemployed, and of low income (table 2).
Main Findings
Thymic function, as measured by the sj/beta- TREC ratio, was at a statistically significant lower level among participants living in neigh-borhoods with more abandoned homes. A 10 percentage point increase in the prevalence of abandoned homes was associated with a –0.03 (95% CI: –0.05, –0.01) log- unit decrease in sj/ beta- TREC ratio, after controlling for age, sex, baseline IL- 6, and employment status. Similar to the association with abandoned homes, neighborhood foreclosure proportions in 2009 and 2011 were associated with thymic function such that a one- unit increase in foreclosure pro-portion was associated with a –0.06 (95% CI: –0.11, –0.01) log- unit decline in sj/beta- TREC
ratio in 2009 and a –0.04 (95% CI: –0.09, 0.00), log- unit decline in 2011. The association by change in foreclosure proportion over this pe-riod was not significant, β = –0.19 (95% CI: –0.62, 0.24).
None of the three other neighborhood char-acteristics assessed were statistically signifi-cantly associated with thymic function:
preva-lence of damaged property, β =–0.04 (95% CI:
–0.10, 0.09); prevalence of vacant lots, β =–0.02 (95% CI: –0.12, 0.08); and prevalence of com-munity gardens, β =0.00 (95% CI: –0.10, 0.10). In addition, we combined all of these measures into an aggregate neighborhood disorder score by summing them with community garden prevalence reverse coded. The aggregate score was associated with reduced thymic function, but was not statistically significant, β =–0.02 (95% CI: –0.11, 0.08) (table 3, table A1).
Mediation Analyses
The median neighborhood social cohesion score was 52 (IQR: 40 to 60). A 10 percent higher neighborhood prevalence of abandoned homes was significantly associated with lower social cohesion scores, β =–0.27 (95% CI: –0.43, –0.11)
as was 2009 foreclosure proportion β =–0.09
(95% CI: –0.14, –0.04). The neighborhood social cohesion score was positively associated with thymic output. A one- unit increase in the social cohesion variable was associated with a 0.05 (95% CI: 0.02, 0.07) log- unit increase in sj/beta- Table 2. Sample Characteristics Versus Wave 1 Population, Detroit Neighborhood
Health Study
Measure
Sample (N = 277)
DNHS Wave 1 Population (N = 1,547)
Age, median (IQR) 56 (47–67) 48 (35–56)
Female, N (%) 167 (61) 833 (54)
Employed, N (%) 97 (35) 738 (52)
Income, N (%)
Less than $25,000 141 (51) 738 (48)
$25,000–$49,999 89 (32) 452 (29)
$50,000 or more 47 (17) 357 (23)
TREC ratio. Abandoned homes and foreclosure proportions were similarly distributed spatially, and some spatial consistency in distributions of neighborhood social cohesion was evident (figure 3). Inclusion of social cohesion in the main models estimating the association of neighborhood prevalence of abandoned homes and 2009 foreclosure proportions with thymic function resulted in attenuation of the effect estimates, β =0.00 (95% CI: –0.36, 0.18) (figure 4) and β =–0.03 (–0.06, 0.00) (figure 5), respec-tively.
The median number of population- size ad-justed violent crimes per square mile was 436 (IQR: 374 to 516). A 10 percentage point increase in neighborhood prevalence of abandoned homes was associated with a 0.06 (95% CI: 0.02, 0.10) unit increase in violent crimes per square mile, and a 1 percentage point increase in 2009 foreclosures was associated with a 0.08 (95% CI: 0.00, 0.14) unit increase. Our model findings did not support the theory that crime was as-sociated with a decline in thymic function,
β =0.00 (95% CI: –0.03, 0.01) and therefore did not meet justification for exploring mediation by crime in further analyses.
Stratified Analyses
In analyses stratified by household income level, associations between abandoned home prevalence and foreclosure proportions in 2009 and 2011 were strongest in the middle- income group, β =–0.10 (95% CI: –0.26, 0.06); = β =–0.11
(95% CI: –0.29, 0.07); and β =–0.08 (95% CI:
–0.18, 0.02), respectively. Among the lowest in-come group, associations were weak but the association between change in foreclosure
pro-portions and thymic function was strongest, β
β =–0.21 (95% CI: –0.50, 0.08). Associations
were weakest among the highest income group and no estimates were statistically significant at the α = 0.05 level (table 4). In the full model, including an interaction term did not improve fit, nor was the term (testing heterogeneity of effect across levels of individual- level income) statistically significant.
Table 3. Regression Coefficient Estimates and 95 Percent Confidence Intervals, for the Associations of Neighborhood Prevalences
Neighborhood Characteristic β (95% CI) Adjusted for Age Only β (95% CI) Fully Adjusteda
For each 10 percentage point increase in abandoned home prevalence
–0.02 (95% CI: –0.05, 0.00) –0.03 (95% CI: –0.05, –0.01)*
For each 10 percentage point increase in damaged property prevalence
–0.03 (95% CI: –0.08, 0.06) –0.04 (95% CI: –0.10, 0.09)
For each 10 percentage point increase in vacant lot prevalence
–0.02 (95% CI: –0.09, 0.07) –0.02 (95% CI: –0.12, 0.08)
For each 1 percentage point increase in community garden prevalence
0.01 (95% CI: –0.11, 0.07) 0.00 (95% CI: –0.10, 0.10)
For each 10 percentage point increase in composite environment score
–0.02 (95% CI: –0.11, 0.08) –0.02 (95% CI: –0.11, 0.08)
For each 1 percentage point increase in 2009 foreclosures
–0.07 (95% CI: –0.11, –0.02)* –0.06 (95% CI: –0.11, –0.01)*
For each 1 percentage point increase in 2011 foreclosures
–0.03 (95% CI: –0.07, 0.01) –0.04 (95% CI: –0.09, 0.00)
For each 1 percentage point increase in foreclosure change (2009–2011)
–0.11 (95% CI: –0.54, 0.17) –0.19 (95% CI: –0.62, 0.24)
Source: Authors’ calculations from the Detroit Neighborhood Health Study, 2008, and Detroit Police Department 2009.
a Adjusted for age, sex, baseline IL-6, and employment status. Coefficient estimates represent the change in log sj/beta-TREC ratio associated with a 10 percentage point increase in prevalence of environmental characteristics and a one per 100 mortgage increase in foreclosure rates.
Figure 4. Regression Coefficients and 95 Percent Confidence Intervals, Mediation Analysis, Abandoned Homes
Source: Authors’ calculations from the Detroit Neighborhood Health Study, 2008, and Detroit Police Department 2009.
aModel adjusted for age, sex, baseline IL-6, and employment status.
bModel adjusted for age, sex, baseline IL-6, employment status, abandoned home prevalence, and 2009 foreclosure prevalence.
cModel adjusted for social cohesion, age, sex, and employment status. *significant at the α = .05 level.
Social cohesion score –0.27 (–0.43, –0.11)a*
0.05 (0.02, 0.07)b*
0.00 (–0.36, 0.18)c
Abandoned home prevalence sj/beta-TREC ratio
Figure 3. Spatial Distributions by Neighborhood (N = 52)
Source: Authors’ calculations from the Detroit Neighborhood Health Study, 2008, and Detroit Police Department 2009.
Crimes per square mile 15–57 58–322 323–429 430–492 493–598 Abandoned home prevalence
4–21 22–31 32–40 41–49 50–60
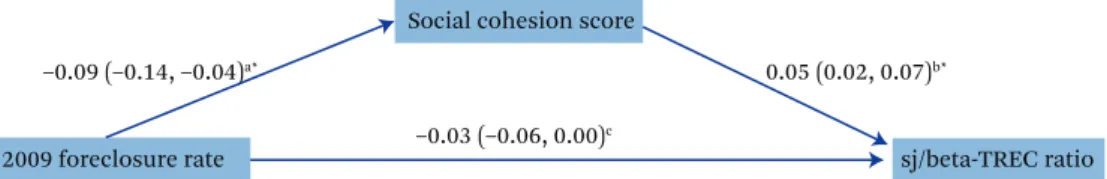
Figure 5. Regression Coefficients and 95 Percent Confidence Intervals, Mediation Analysis, Foreclosure Rate
Source: Authors’ calculations from the Detroit Neighborhood Health Study, 2008, and Detroit Police Department 2009.
aModel adjusted for age, sex, baseline IL-6, and employment status.
bModel adjusted for age, sex, baseline IL-6, employment status, abandoned home prevalence, and 2009 foreclosure prevalence.
cModel adjusted for social cohesion, age, sex, and employment status. *significant at the α = .05 level.
Social cohesion score
2009 foreclosure rate sj/beta-TREC ratio
–0.09 (–0.14, –0.04)a* 0.05 (0.02, 0.07)b*
–0.03 (–0.06, 0.00)c
Table 4. Regression Coefficient Estimates and 95 Percent Confidence Intervals, Associations of Neighborhood Prevalence, by Income Group
Neighborhood Characteristic β(95% CI) Fully Adjusteda
High income (≥$50,000 per year)
For each 10 percentage point increase in abandoned home prevalence
0.01 (95% CI: –0.05, 0.07)
For each 1 percentage point increase in 2009 foreclosures 0.00 (95% CI: –0.10, 0.10) For each 1 percentage point increase in 2011 foreclosures –0.02 (95% CI: –0.10, 0.06) For each 1 percentage point increase in foreclosure change
(2009–2011)
–0.07 (95% CI: –0.15, 0.01)
Middle income ($25,000 to <$50,000 per year)
For each 10 percentage point increase in abandoned home prevalence
–0.10 (95% CI: –0.26, 0.06)
For each 1 percentage point increase in 2009 foreclosures –0.11 (95% CI: –0.29, 0.07) For each 1 percentage point increase in 2011 foreclosures –0.08 (95% CI: –0.18, 0.02) For each 1 percentage point increase in foreclosure change
(2009–2011)
–0.13 (95% CI: –0.29, 0.03)
Low income (≤$25,000 per year)
For each 10 percentage point increase in abandoned home prevalence
–0.02 (95% CI: –0.08, 0.04)
For each 1 percentage point increase in 2009 foreclosures –0.01 (95% CI: –0.03, 0.01) For each 1 percentage point increase in 2011 foreclosures 0.00 (95% CI: –0.12, 0.12) For each 1 percentage point increase in foreclosure change
(2009–2011)
–0.21 (95% CI: –0.50, 0.08)
Source: Authors’ calculations from the Detroit Neighborhood Health Study, 2008, and Detroit Police Department 2009.
Sensitivity Analyses
We examined whether differing individual- level socioeconomic variables affected the associa-tion between abandoned homes and thymic function. The estimated association between abandoned homes and sj/beta- TREC ratio dif-fered little when controlling for income instead of employment status in fully adjusted models for log sj/beta- TREC ratio, β =–0.05 (95% CI: –0.15, 0.05). We had similar findings when con-trolling for education rather than employment status, β =–0.03 (95% CI: –0.13, 0.07), suggest-ing that the influence of individual measures of socioeconomic status are similar and do not fully account for the influence of abandoned homes at the neighborhood level.
When assessing sensitivity to the thymic function measurement approach, neighbor-hood prevalence of abandoned homes was also associated with decline in thymic function as measured by the number of sjTREC per million
whole blood cells, β =–0.02 (95% CI: –0.12,
0.08), but this estimate was not statistically sig-nificant at the α = 0.05 level. Similarly, aban-doned home prevalence was associated with higher baseline inflammation (as measured by IL- 6 level), β = 0.12 (95% CI: –0.02, 0.17), as were
neighborhood foreclosures β =0.08 (95% CI:
–0.05, 0.21).
diScuSSion
In this community- based study of adults living in Detroit in 2009, the height of the Great Re-cession impact on home prices and household wealth (U.S. Census Bureau 2013), we assessed the association between area- level indicators of the economic crisis—including neighbor-hood prevalence of abandoned homes, home foreclosure, and other measures of neighbor-hood disorder—and thymic function, a key measure of immunological well- being. We found that increased neighborhood prevalence of abandoned homes and home foreclosure during the recession were associated with de-creased thymic function, particularly among middle- income individuals. Indeed, even after adjusting for covariates, a 10 percentage point increase in neighborhood prevalence of aban-doned homes was roughly associated with the same decrease in thymic function as we ob-served for a 1.7- year increase in chronological
age, and a 1 percentage point increase in 2009 home foreclosures was associated with the same decrease in thymic function as we ob-served for a 3.3- year increase in chronological age. Additionally, our findings support the hy-pothesis that social cohesion mediates the as-sociation between neighborhood environment and immune function. These findings strengthen the body of evidence supporting the significance of social context in influencing key biological health indicators over the life course, and, more specifically, stress- sensitive markers of immunity.
Given the economic climate and high home foreclosure rate in Detroit during the Great Re-cession, neighborhood prevalence of aban-doned and foreclosed homes is an important source of chronic stress in the study population (Rooney 2008). We observed associations with reduced thymic function when assessing both prevalence of abandoned homes and foreclo-sure proportions. We also examined other mea-sures of the physical environment (such as damaged property, gardens, and vacant lots) and found associations that, though not statis-tically significant, were consistent with our main findings that neighborhood quality af-fects health through immunological pathways. The robust and specific influence of abandoned homes and home foreclosures on our immune function measure underscore the importance of addressing structural factors influencing poor health outcomes and contributing to so-cial health disparities in this population.
Cata-lano et al. 2011). Our work provides additional evidence in support for a potential biological mediator of these reported associations by ex-amining a global measure of immune function, which is critical for fighting disease and pro-moting health.
The potential influence of stressors related to the Great Recession on thymic function is significant because it supports existing evi-dence that exposure to stressors negatively im-pacts the immune system (Dhabhar 2014). It may also influence overall health in adulthood, because the role of the thymus is important for production of naïve T- cells throughout the life course (Poulin et al. 1999). For example, decline in thymic function has been found to be asso-ciated with increased infection susceptibility as well as risk of autoimmune disease, cancer, and mortality (Ferrando- Martínez et al. 2013; Lynch et al. 2009). Further, our earlier research in the DNHS cohort suggests that reduced thy-mic function is associated with increased levels of pro- inflammatory biomarkers and other neg-ative health outcomes, highlighting this mea-sure as an important potential mechanism by which stressors may influence health at the population level (Feinstein et al. 2016).
Although we observed a significant associa-tion between foreclosures in 2009 and thymic function, our analyses did not identify a sig-nificant impact of changes in foreclosure prev-alence from 2009 to 2011. Foreclosures were de-clining on average in that period. Indeed, 2009 showed the largest dip in home sale prices and loss of household wealth; in 2011, these mea-sures began to bounce back (U.S. Census Bu-reau 2013). Therefore, 2011 represents a period of recovery, which may explain our findings. We also may not have captured the period of the most severe recession impacts for all neigh-borhoods. Moreover, Detroit experienced a his-tory of industrial collapse, discriminahis-tory res-idential lending, and racial segregation that had left many parts of the city vulnerable and under resourced decades before the Great Re-cession, which may have augmented the reces-sion impacts in 2009 (Sugrue 2014).
Results of stratified analyses supported the hypothesis that socioeconomic status modifies the effect of abandoned homes and foreclo-sures on thymic function. Although the effects
by income were not significantly different, the subgroup sample sizes did not provide ade-quate statistical power to detect heterogeneity. However, the differences in estimated effects by income group are of substantive interest. Individuals in the middle- income group showed the strongest association between in-creased abandoned home prevalence and prev-alence of foreclosures and poorer immune function. This supports the theory that middle- income individuals were most sensitive to the impacts of area- level foreclosures and home vacancies. We observed that, among those in the lowest income group, changes in home foreclosure proportions from 2009 to 2011 (as opposed to prevalence of foreclosures in 2009, as observed for higher income groups) had the strongest impact on thymic function, suggest-ing that these individuals may have been par-ticularly susceptible to ongoing changes in housing stability following the Great Reces-sion. Previous work has found stronger impacts on physiological manifestations of major, recession- related financial stressors among low- income individuals (Boen and Yang 2016).
Our mediation analyses support the hypoth-esis that social cohesion may lie on the pathway between living in an adverse neighborhood en-vironments and individual- level immune func-tion. A higher prevalence of abandoned homes and foreclosure in the neighborhood were as-sociated with lower social cohesion; higher so-cial cohesion was associated with decreased thymic function. Further, adjustment for social cohesion attenuated the estimated effect of foreclosure and abandoned home prevalence on thymic function toward the null estimate. Our results support the growing literature sug-gesting that the level of social cohesion within neighborhoods is an important protective, me-diating factor for mental health outcomes among African American women (Giurgescu et al. 2015) and the general U.S. population (Druk-ker and van Os 2003; Kruger, Reischl, and Gee 2007) as well as cardiovascular health in the United States (Diez Roux et al. 2001).
of the crime data, we are aware that error is likely to be present in this measure (Black 1970; Biderman and Lynch 2012). Further work using more extensive crime data, such as crowd-sourced crime information, may help support a more robust analysis of this potential media-tor (Shah et al. 2011). In addition to mechanis-tic insights, the roles of crime and social cohe-sion in the association between neighborhood environment and immune function also high-light the potential for community- level inter-vention opportunities for mitigating the delete-rious effects of poor neighborhood physical environments.
Important strengths of this study include data from a predominantly African American, population- based sample and representation from neighborhoods with a wide variance in quality of the physical and social environ-ments. The analyses were also strengthened by the use of a novel measure of immune health, which has been specifically characterized in the DNHS population (Feinstein et al. 2016). How-ever, this study has some limitations. First, al-though the sj/beta- TREC ratio measure ad-dresses peripheral blood dilution of sjTRECs (Dion et al. 2004), not all beta excision circles are captured, complicating interpretations of low function values (Ferrando- Martínez et al. 2010). Second, as in all nonexperimental stud-ies of neighborhood characteristics and health, our study may suffer from issues related to se-lection into neighborhoods that may be related to the outcome (Oakes 2004). Therefore, the estimated effects may be an artifact of unmea-sured factors both enabling some Detroit resi-dents to move to neighborhoods with less fore-closure and causing them to have better immune function. However, the robustness of analyses to confounder adjustment, including a marker of immune health at baseline, provide enough confidence in the association to war-rant further pursuit in a longitudinal or quasi- experimental setting in which a causal effect may be estimated. Third, our measure of aban-doned homes was derived in 2008, only about a year into the Great Recession. We do not have data on duration of abandonment, and there-fore some of the abandoned homes that were quantified may have been abandoned before the recession. Fourth, police department data
are vulnerable to misclassification (approxi-mated to fit available codes). Crime incident data are also biased by the absence of crimes not reported by citizens to the police and by police decisions not to record all crimes re-ported by citizens (Black 1970). Fifth, this anal-ysis may be limited by the conceptualization of neighborhood. Historic administrative units defining neighborhoods in this study may not reflect the true function of the included area- level variables. Regardless, neighborhood defi-nitions based on historically defined boundar-ies are likely a substantial improvement over measurements based on census tracts (Duncan et al. 2014). Sixth, the differences in the distri-bution of some sociodemographic characteris-tics of our study sample relative to the full DNHS study population may limit the general-izability of our results to the entire city of De-troit. We mitigated threats to internal validity by controlling for identified confounders dis-tributed differently between the study sample and overall population. Finally, the analyses were limited by the small sample size of par-ticipants with available thymic function data, which may have under powered analyses to de-tect statistically significant effects in some in-stances, particularly those assessing heteroge-neity of effect by individual income. However, the robust and consistent associations we did observe over multiple measures and despite our relatively small sample size suggest impor-tant immune health impacts of the Great Re-cession in part due to the profound prolifera-tion of home foreclosures and subsequent neighborhood vacancy, which warrant further investigation.
results suggest that social cohesion may be an important buffering community- level factor that could reduce the detrimental impacts of living in neighborhoods during economic de-clines. The finding that social cohesion may mediate the association of abandoned homes and foreclosures with thymic function supports the hypothesis that neighborhoods may
appendix
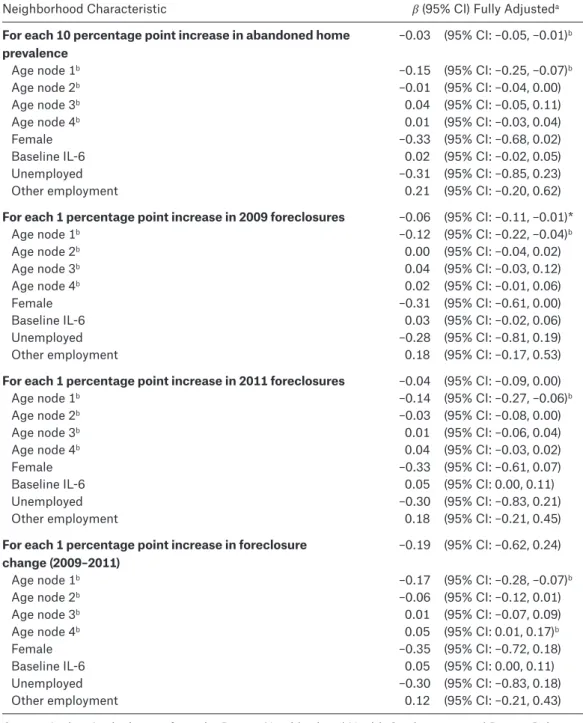
Table A1. Regression Coefficient Estimates and Confidence Intervals, Associations of Neighborhood Prevalence, by Age
Neighborhood Characteristic β (95% CI) Fully Adjusteda
For each 10 percentage point increase in abandoned home prevalence
–0.03 (95% CI: –0.05, –0.01)b
Age node 1b –0.15 (95% CI: –0.25, –0.07)b
Age node 2b –0.01 (95% CI: –0.04, 0.00)
Age node 3b 0.04 (95% CI: –0.05, 0.11)
Age node 4b 0.01 (95% CI: –0.03, 0.04)
Female –0.33 (95% CI: –0.68, 0.02)
Baseline IL-6 0.02 (95% CI: –0.02, 0.05)
Unemployed –0.31 (95% CI: –0.85, 0.23)
Other employment 0.21 (95% CI: –0.20, 0.62)
For each 1 percentage point increase in 2009 foreclosures –0.06 (95% CI: –0.11, –0.01)*
Age node 1b –0.12 (95% CI: –0.22, –0.04)b
Age node 2b 0.00 (95% CI: –0.04, 0.02)
Age node 3b 0.04 (95% CI: –0.03, 0.12)
Age node 4b 0.02 (95% CI: –0.01, 0.06)
Female –0.31 (95% CI: –0.61, 0.00)
Baseline IL-6 0.03 (95% CI: –0.02, 0.06)
Unemployed –0.28 (95% CI: –0.81, 0.19)
Other employment 0.18 (95% CI: –0.17, 0.53)
For each 1 percentage point increase in 2011 foreclosures –0.04 (95% CI: –0.09, 0.00)
Age node 1b –0.14 (95% CI: –0.27, –0.06)b
Age node 2b –0.03 (95% CI: –0.08, 0.00)
Age node 3b 0.01 (95% CI: –0.06, 0.04)
Age node 4b 0.04 (95% CI: –0.03, 0.02)
Female –0.33 (95% CI: –0.61, 0.07)
Baseline IL-6 0.05 (95% CI: 0.00, 0.11)
Unemployed –0.30 (95% CI: –0.83, 0.21)
Other employment 0.18 (95% CI: –0.21, 0.45)
For each 1 percentage point increase in foreclosure change (2009–2011)
–0.19 (95% CI: –0.62, 0.24)
Age node 1b –0.17 (95% CI: –0.28, –0.07)b
Age node 2b –0.06 (95% CI: –0.12, 0.01)
Age node 3b 0.01 (95% CI: –0.07, 0.09)
Age node 4b 0.05 (95% CI: 0.01, 0.17)b
Female –0.35 (95% CI: –0.72, 0.18)
Baseline IL-6 0.05 (95% CI: 0.00, 0.11)
Unemployed –0.30 (95% CI: –0.83, 0.18)
Other employment 0.12 (95% CI: –0.21, 0.43)
Source: Authors’ calculations from the Detroit Neighborhood Health Study, 2008, and Detroit Police Department 2009.
aAdjusted for age, sex, baseline IL-6, and employment status. Coefficient estimates represent the change in log sj/beta-TREC ratio associated with a 10 percentage point increase in prevalence of environmental characteristics and a 1 percentage point increase in foreclosure prevalence. bAge was modeled as a 4-node cubic spline.
referenceS
Ackerman, Robert Argento, Gerhard Fries, and Rich-ard A. Windle. 2012. “Changes in U.S. Family Fi-nances from 2007 to 2010: Evidence from the Survey of Consumer Finances.” Federal Reserve Bulletin 100(4): 1–80.
Auchincloss, Amy H., Ana V. Diez Roux, Daniel G. Brown, Trivellore E. Raghunathan, and Christine A. Erdmann. 2007. “Filling the Gaps: Spatial In-terpolation of Residential Survey Data in the Es-timation of Neighborhood Characteristics.” Epi-demiology 18(4): 469–78.
Bacigalupe, Amaia, and Antonio Escolar- Pujolar. 2014. “The Impact of Economic Crises on Social Inequalities in Health: What Do We Know So Far?” International Journal for Equity in Health 13: 52. DOI: 10.1186/1475- 9276- 13- 52.
Biderman, Albert D., and James P. Lynch. 2012. Un-derstanding Crime Incidence Statistics: Why the UCR Diverges from the NCS. New York: Springer. Black, Donald J. 1970. “Production of Crime Rates.”
American Sociological Review 35(4): 733–48. Blair, Alexandra, Nancy A. Ross, Geneviève Gariepy,
and Norbert Schmitz. 2014. “How Do Neighbor-hoods Affect Depression Outcomes? A Realist Review and a Call for the Examination of Causal Pathways.” Social Psychiatry and Psychiatric Epi-demiology 49(6): 873–87.
Boen, Courtney, and Y. Claire Yang. 2016. “The Phys-iological Impacts of Wealth Shocks in Late Life: Evidence from the Great Recession.” Social Sci-ence & Medicine 150 (February): 221–30. DOI: 10 .1016/j.socscimed.2015.12.029.
Bureau of Labor Statistics. 2015. “Local Area Unem-ployment Statistics Map: Michigan; Unemploy-ment Rates by State; Not Seasonally Adjusted, Annual.” Washington: U.S. Department of Labor. Accessed August 12, 2017. https://www.bls.gov /lau/.
Burgard, Sarah A, Jennifer A. Ailshire, and Lucie Kalousova. 2013. “The Great Recession and Health: People, Populations, and Disparities.” An-nals of the American Academy of Political and So-cial Science 650(1): 194–213.
Burgard, Sarah A., K. S. Seefeldt, and S. Zelner. 2012. “Housing Instability and Health: Findings from the Michigan Recession and Recovery Study.” Social Science & Medicine 75(12): 2215– 24.
Cagney, K. A., C. R. Browning, J. Iveniuk, and N. En-glish. 2014. “The Onset of Depression During the
Great Recession: Foreclosure and Older Adult Mental Health.” American Journal of Public Health 104(3): 498–505.
Catalano, Ralph, Sidra Goldman- Mellor, Katherine Saxton, Claire Margerison- Zilko, Meenakshi Sub-baraman, Kaja LeWinn, and Elizabeth Anderson. 2011. “The Health Effects of Economic Decline.” Annual Review of Public Health 32: 431–50. DOI: 10.1146/annurev- publhealth–031210- 101146. Curry, Aaron, Carl Latkin, and Melissa Davey-
Rothwell. 2008. “Pathways to Depression: The Impact of Neighborhood Violent Crime on Inner- City Residents in Baltimore, Maryland, USA.” So-cial Science & Medicine 67(1): 23–30.
DelaRosa, Olga, Graham Pawelec, Esther Peralbo, Anders Wikby, Erminia Mariani, Eugenio Moc-chegiani, Raquel Tarazona, and Rafael Solana. 2006. “Immunological Biomarkers of Ageing in Man: Changes in Both Innate and Adaptive Im-munity Are Associated with Health and Longev-ity.” Biogerontology 7(5–6): 471–81.
Detroit Police Department. 2009. “CrisNet/NetRMS.” Detroit Open Data. Accessed August 12, 2017. https://data.detroitmi.gov/.
Dhabhar, Firdaus S. 2014. “Effects of Stress on Im-mune Function: The Good, the Bad, and the Beautiful.” Immunological Research 58(2–3): 193– 210.
Diez Roux, Ana V., Sharon S. Merkin, Donna Arnett, Lloyd Chambless, Mark Massing, F. Javier Nieto, Paul Sorlie, Moyses Szklo, Herman A. Tyroler, and Robert L. Watson. 2001. “Neighborhood of Residence and Incidence of Coronary Heart Dis-ease.” New England Journal of Medicine 345(2): 99–106.
Dion, M. L., R. Bordi, J. Zeidan, R. Asaad, M. R. Bou-lassel, J. P. Routy, M. M. Lederman, R. P. Sékaly, and R. Cheynier. 2007. “Slow Disease Progres-sion and Robust Therapy- Mediated CD4+ T- cell Recovery Are Associated with Efficient Thymo-poiesis During HIV- 1 Infection.” Blood 109(7): 2912–20.
Dion, Marie- Lise, Jean- Françoise Poulin, Rebeka Bordi, Myriam Sylvestre, Rachel Corsini, Nadia Kettaf, Ali Dalloul, Mohamed- Rachid Boulassel, Patrice Debré, Jean- Pierre Routy, Zvi Grossman, Rafick- Pierre Sékaly, and Rémi Cheynier. 2004. “HIV Infection Rapidly Induces and Maintains a Substantial Suppression of Thymocyte Prolifera-tion.” Immunity 21(6): 757–68.
Keiser, Earl A. Gage, et al. 1998. “Changes in Thymic Function with Age and During the Treat-ment of HIV Infection.” Nature 396(6712): 690– 95.
Dowd, Jennifer B., and Allison E. Aiello. 2009. “So-cioeconomic Differentials in Immune response.” Epidemiology 20(6): 902–08.
Drukker, Marjan, and Jim van Os. 2003. “Mediators of Neighbourhood Socioeconomic Deprivation and Quality of Life.” Social Psychiatry and Psychi-atric Epidemiology 38(12): 698–706.
Duncan, Dustin T., Ichiro Kawachi, S. V. Subrama-nian, Jared Aldstadt, Steven J. Melly, and David R. Williams. 2014. “Examination of How Neigh-borhood Definition Influences Measurements of Youths’ Access to Tobacco Retailers: A Method-ological Note on Spatial Misclassification.” Amer-ican Journal of Epidemiology 179(3): 373–81. Feinstein, Lydia, Sara Ferrando- Martínez, Manuel
Leal, Xuan Zhou, Gregory D. Sempowski, Derek E. Wildman, Monica Uddin, and Allison E. Aiello. 2016. “Population Distributions of Thymic Func-tion in Adults: VariaFunc-tion by Sociodemographic Characteristics and Health Status.” Biodemogra-phy and Social Biology 62(2): 208–21.
Ferrando- Martínez, Sara, Jaime M. Franco, Ana Hernandez, Antonio Ordoñez, Encarna Gutierrez, Antonia Abad, and Manuel Leal. 2009. “Thymo-poiesis in Elderly Human Is Associated with Sys-temic Inflammatory Status.” Age (Dordr) 31(2): 87–97.
Ferrando- Martínez, Sara, Jaime M. Franco, Ezequiel Ruiz- Mateos, Anna Hernandez, Antonio Ordonez, Encarnacion Gutiérrez- Carretero, and Manuel Leal. 2010. “A Reliable and Simplified sj/beta- TREC Ratio Quantification Method for Human Thymic Output Measurement.” Journal of Immu-nological Methods 352(1–2): 111–17.
Ferrando- Martínez, Sara, Maria C. Romero- Sanchez, Rafael Solana, Juan Delgado, Rafael de la Rosa, Ma Angeles Munoz- Fernandez, Ezequiel Ruiz- Mateos, and Manuel Leal. 2013. “Thymic Func-tion Failure and C- Reactive Protein Levels Are In-dependent Predictors of All- Cause Mortality in Healthy Elderly Humans.” Age (Dordr) 35(1): 251– 59.
Flanagan, Christine, and Ellen Wilson. 2013. “Home Value and Homeownership Rates: Recession and Post- Recession Comparisons from 2007–2009 to 2010–2012.” American Community Survey Brief 12- 20. Washington: U.S. Census Bureau.
Ford, Jodi L., and Christopher R. Browning. 2015. “Exposure to Neighborhood Immigrant Concen-tration from Adolescence to Young Adulthood and Immune Function Among Latino Young Adults.” Health & Place 32(1): 59–64.
Giurgescu, Carmen, Dawn P. Misra, Shawnita Sealy- Jefferson, Cleopatra H. Caldwell, Thomas N. Templin, Jaime C. Slaughter- Acey, and Theresa L. Osypuk. 2015. “The Impact of Neighborhood Quality, Perceived Stress, and Social Support on Depressive Symptoms During Pregnancy in Afri-can AmeriAfri-can Women.” Social Science & Medi-cine 130 (April): 172–80.
Goldmann, Emily, Allison Aiello, Monica Uddin, Jorge Delva, Karestan Koenen, Larry M. Gant, and San-dro Galea. 2011. “Pervasive Exposure to Violence and Posttraumatic Stress Disorder in a Predomi-nantly African American Urban Community: The Detroit Neighborhood Health Study.” Journal of Traumatic Stress 24(6): 747–51.
Gould Ellen, Ingrid, and Samuel Dastrup. 2012. “Housing and the Great Recession.” Stanford Center on Poverty and Inequality, October. Ac-cessed August 12, 2017. http://furmancenter.org /files/publications/HousingandtheGreat Recession.pdf.
Greenland, Sander, Judea Pearl, and James M. Rob-ins. 1999. “Causal Diagrams for Epidemiologic Research.” Epidemiology 10(1): 37–48.
Gruver, Amanda L., and Gregory D. Sempowski. 2008. “Cytokines, Leptin, and Stress- Induced Thymic Atrophy.” Journal of Leukocyte Biology 84(4): 915–23.
Hill, Eric J., and John Gallagher. 2002. AIA Detroit: The American Institute of Architects Guide to De-troit Architecture. Detroit, Mich.: Wayne State University Press.
Howe, Chanelle J., Stephen R. Cole, Daniel J. West-reich, Sander Greenland, Sonia Napravnik, and Joseph J. Eron Jr. 2011. “Splines for Trend Analy-sis and Continuous Confounder Control.” Epide-miology 22(6): 874–45.
Hunter, Christopher A., and Simon A. Jones. 2015. “IL- 6 as a Keystone Cytokine in Health and Dis-ease.” Nature Immunology 16(5): 448–57. Kawachi, Ichiro, and Lisa F. Berkman. 2003.
Neigh-borhoods and Health. Oxford: Oxford University Press.
Area Level Deprivation with the Metabolic Syn-drome and Inflammation Among Middle- and Older- Age Adults.” BMC Public Health 14 (De-cember): 1319.
King, Katherine E., Jeffrey D. Morenoff, and James S. House. 2011. “Neighborhood Context and Social Disparities in Cumulative Biological Risk Fac-tors.” Psychosomatic Medicine 73(7): 572–79. Kruger, Daniel J, Thomas M. Reischl, and Gilbert C.
Gee. 2007. “Neighborhood Social Conditions Me-diate the Association Between Physical Deterio-ration and Mental Health.” American Journal of Community Psychology 40(3–4): 261–71. Lantos, Paul M, Sallie R. Permar, Kate Hoffman, and
Geeta K. Swamy. 2015. “The Excess Burden of Cytomegalovirus in African American Communi-ties: A Geospatial Analysis.” Open Forum Infec-tious Diseases 2(4). DOI: 10.1093/ofid/ofv180. Lichter, Daniel T., Domenico Parisi, and Michael C.
Taquino. 2015. “Toward a New Macro-
Segregation? Decomposing Segregation Within and Between Metropolitan Cities and Suburbs.” American Sociological Review 80(4): 843–73. Lynch, Heather E., Gabrielle L. Goldberg, Ann
Chidgey, Marcel R. M. Van den Brink, Richard Boyd, and Gregory D. Sempowski. 2009. “Thy-mic Involution and Immune Reconstitution.” Trends in Immunology 30(7): 366–73.
Lynch, Heather E., and G. D. Sempowski. 2013. “Mo-lecular Measurement of T Cell Receptor Excision Circles.” Methods in Molecular Biology 979: 147– 59.
McLaughlin, Katie A., A. Nandi, Kyle M. Keyes, Mon-ica Uddin, Allison E. Aiello, Sandro Galea, and Karestan C. Koenen. 2012. “Home Foreclosure and Risk of Psychiatric Morbidity During the Re-cent Financial Crisis.” Psychological Medicine 42(7): 1441–48.
Michigan Foreclosure Task Force. 2016. “Michigan Historical Residential Foreclosure Data.” Johnson Center at Grand Valley State University, October 20, 2016. Accessed August 12, 2017. http://cri-data.org/michiganforeclosuretaskforce/. Mishel, Lawrence, Josh Bivens, Elise Gould, and
Heidi Shierholz. 2012. “Great Recession.” In The State of Working America, 12th ed. Ithaca, N.Y.: Cornell University Press.
Momper, Sandra, Anne Nordberg, Leah James, and Jorge Delva. 2012. “Assessing Neighborhoods’ Physical and Social Environments: Experiences from the Detroit Neighborhood Health Study.”
Paper presented at the Society for Social Work and Research Sixteenth Annual Conference “Re-search that Makes a Difference: Advancing Prac-tice and Shaping Public Policy.” Washington, D.C. (January 11–15, 2012).
Mulia, Nina, Sarah E. Zemore, Ryan Murphy, HiuGuo Liu, and Ralpj Catalano. 2014. “Economic Loss and Alcohol Consumption and Problems During the 2008 to 2009 U.S. Recession.” Alcoholism: Clinical and Experimental Research 38(4): 1026– 34.
Oakes, J. Michael. 2004. “The (Mis) Estimation of Neighborhood Effects: Causal Inference for a Practicable Social Epidemiology.” Social Science & Medicine 58(10): 1929–52.
Piccolo, Rebecca S., Dustin T. Duncan, Neil Pearce, and John B. McKinlay. 2015. “The Role of Neigh-borhood Characteristics in Racial/Ethnic Dispari-ties in Type 2 Diabetes: Results from the Boston Area Community Health (BACH) Survey.” Social Science & Medicine 130 (April): 79–90.
Pollack, Craig E., Shanu K. Kurd, Alice Livshits, Mark G. Weiner, and Julia Lynch. 2011. “A Case- Control Study of Home Foreclosure, Health Conditions, and Health Care Utilization.” Journal of Urban Health 88(3): 469–78.
Poulin, Jean- François, Mohan N. Viswanathan, Jef-frey M. Harris, Krishna V. Komanduri, Eric Wie-der, Nancy Ringuette, Morgan Jenkins, Joseph M. McCune, and Rafick- Pierre Sékaly. 1999. “Di-rect Evidence for Thymic Function in Adult Hu-mans.” Journal of Experimental Medicine 190(4): 479–86.
RealtyTrac. 2011. “Michigan Foreclosures.” Realty-Trac foreclosure activity. Accessed May 21, 2016. http://www.realtytrac.com/ContentManagement/. Riumallo- Herl, Carlos, Sanjay Basu, David Stuckler,
Emilie Courtin, and Maricio Avendano. 2014. “Job Loss, Wealth and Depression During the Great Recession in the USA and Europe.” International Journal of Epidemiology 43(5): 1508–17.
Rooney, Ben. 2008. “Rust and Sun Belt Cities Lean ‘07 Foreclosures: Detroit, Stockton and Las Ve-gas Are Top Activity Centers for Troubled Home-owners, According to New Study.” CNN Money, February 12. Accessed August 12, 2017. http:// money.cnn.com/2008/02/12/real_estate/realty trac/index.htm.
De-vices.” Paper presented at the 19th ACM SIGSPATIAL International Conference on Ad-vances in Geographic Information Systems. Chi-cago (November 1–3, 2011).
Smith, George D., Carole Hart, Graham Watt, David Hole, and Victor Hawthorne. 1998. “Individual Social Class, Area- Based Deprivation, Cardio-vascular Disease Risk Factors, and Mortality: The Renfrew and Paisley Study.” Journal of Epi-demiology and Community Health 52(6): 399– 405.
Steptoe, Andrew. 2012. Socioeconomic Status, In-flammation, and Immune Function. New York: Ox-ford University Press.
Steptoe, Andrew, and Michael Marmot. 2002. “The Role of Psychobiological Pathways in Socio- Economic Inequalities in Cardiovascular Disease Risk.” European Heart Journal 23(1): 13–25. Subramanian, S. V., and A. James O’Malley. 2010.
“Modeling Neighborhood Effects: The Futility of Comparing Mixed and Marginal Approaches.” Epidemiology 21(4): 475–81.
Sugrue, Thomas J. 2014. The Origins of the Urban
Crisis: Race and Inequality in Postwar Detroit. Princeton, N.J.: Princeton University Press. Tonorezos, Emily S., Patrick N. Breysse, Elizabeth C.
Matsui, Meredith C. McCormack, Jean Curtin- Brosnan, D’Ann Williams, Nadia N. Hansel, Pey-ton A. EgglesPey-ton, and Gregory B. Diette. 2008. “Does Neighborhood Violence Lead to Depres-sion Among Caregivers of Children with Asthma?” Social Science & Medicine 67(1): 31–37. Tsai, Alexander C. 2015. “Home Foreclosure, Health, and Mental Health: A Systematic Review of Indi-vidual, Aggregate, and Contextual Associations.” PLoS One 10: e0123182.
U.S. Census Bureau. 2013. “Median and Average Sales Prices of New Homes Sold, Household In-come in the United States.” Accessed August 12, 2017. https://www.census.gov/construction/nrs /pdf/uspricemon.pdf.