Galaxy and Mass Assembly (GAMA): the stellar mass budget of galaxy
spheroids and discs
Amanda J. Moffett,
1‹Rebecca Lange,
1Simon P. Driver,
1,2Aaron S. G. Robotham,
1Lee S. Kelvin,
3Mehmet Alpaslan,
4Stephen K. Andrews,
1Joss Bland-Hawthorn,
5Sarah Brough,
6Michelle E. Cluver,
7Matthew Colless,
8Luke J. M. Davies,
1Benne W. Holwerda,
9Andrew M. Hopkins,
6Prajwal R. Kafle,
1Jochen Liske
10and Martin Meyer
11ICRAR, The University of Western Australia, 35 Stirling Highway, Crawley WA 6009, Australia
2SUPA, School of Physics and Astronomy, University of St Andrews, North Haugh, St Andrews KY16 9SS, UK
3Astrophysics Research Institute, Liverpool John Moores University, IC2, Liverpool Science Park, 146 Brownlow Hill, Liverpool L3 5RF, UK 4NASA Ames Research Center, N232, Moffett Field, Mountain View, CA 94035, USA
5Sydney Institute for Astronomy, School of Physics A28, University of Sydney, NSW 2006, Australia 6Australian Astronomical Observatory, PO Box 915, North Ryde, NSW 1670, Australia
7Department of Physics and Astronomy, University of the Western Cape, Robert Sobukwe Road, Bellville 7535, South Africa 8Research School of Astronomy and Astrophysics, Australian National University, Canberra, ACT 2611, Australia 9University of Leiden, Sterrenwacht Leiden, Niels Bohrweg 2, NL-2333 CA Leiden, The Netherlands
10Hamburger Sternwarte, Universitat Hamburg, Gojenbergsweg 112, D-21029 Hamburg, Germany
Accepted 2016 July 26. Received 2016 July 25; in original form 2016 April 1
A B S T R A C T
We build on a recent photometric decomposition analysis of 7506 Galaxy and Mass Assembly (GAMA) survey galaxies to derive stellar mass function fits to individual spheroid and disc component populations down to a lower mass limit of log(M∗/M)=8. We find that the spheroid/disc mass distributions for individual galaxy morphological types are well described by single Schechter function forms. We derive estimates of the total stellar mass densities in spheroids (ρspheroid =1.24 ±0.49× 10⁸M Mpc −3h0.7) and discs (ρdisc =1.20±0.45
×108M Mpc −3h0.7), which translates to approximately 50 per cent of the local stellar mass density in spheroids and 48 per cent in discs. The remaining stellar mass is found in the dwarf ‘little blue spheroid’ class, which is not obviously similar in structure to either classical spheroid or disc populations. We also examine the variation of component mass ratios across galaxy mass and group halo mass regimes, finding the transition from spheroid to disc mass dominance occurs near galaxy stellar mass∼1011Mand group halo mass∼1012.5Mh−1. We further quantify the variation in spheroid-to-total mass ratio with group halo mass for central and satellite populations as well as the radial variation of this ratio within groups.
Key words: galaxies: elliptical and lenticular, cD – galaxies: fundamental parameters – galaxies: luminosity function, mass function – galaxies: spiral – galaxies: statistics.
1 I N T R O D U C T I O N
Spheroidal and disc galaxy structures are generally considered to result from separate formation mechanisms. In the simplest picture of galaxy structure growth, stellar spheroids arise from dissipation-less accumulation of previously formed stars in mergers (e.g. Cole et al.2000), and discs arise from star formation in the dissipational collapse of high angular momentum gas (e.g. Fall & Efstathiou
E-mail:amanda.moffett@uwa.edu.au
1980). Thus, placing constraints on the balance of mass formed in spheroids and discs should tell us about the balance between the modes of galaxy formation that are dissipationless and dissipational. However, there are many potential complications to this simple pic-ture. For example, it is now argued that galaxy bulges may initially form at high redshift from gas inflows enabled by disc instabilities and be further grown by minor mergers over time (e.g. Parry, Eke & Frenk2009; Hopkins et al.2010; Bournaud et al.2011). The two-phase model of Driver et al. (2013) also envisions a transition from spheroid formation atz1.7, enabled primarily by major mergers, to disc formation atz1.7, enabled primarily by gas accretion.
Considering the role of accretion in more detail, a recent simulation analysis of Sales et al. (2012) suggests that the main influence on the mode of structure formation is actually the alignment of material accreted into the halo, where poorly aligned accretion events result in spheroid structures and well-aligned accretion events result in disc structures.
In galaxy formation simulations, reproduction of realistic galaxy bulge and disc structures has been a longstanding problem. Early issues with the overproduction of bulges in simulations have steadily improved (e.g. as recently reviewed by Somerville & Dav´e2015; Brooks & Christensen2016). Hydrodynamical simulations are now able to produce even extreme bulgeless disc morphologies (e.g. Governato et al.2010; Brook et al.2011). However, it has been noted that similar bulge formation mechanisms lead to bulges that are still somewhat more massive than are typically observed for intermediate mass disc galaxies (see e.g. Christensen et al.2014).
Hydrodynamical simulations of bulge formation have thus far been limited to relatively small samples of objects in zoom-in sim-ulations, but cosmological semi-analytic models are now produc-ing realistic galaxy spheroidpopulations through merger-driven spheroid formation mechanisms, at least for intermediate to high-mass galaxies (see Somerville & Dav´e2015and references therein). Moving forward with both types of models, accurate observational measurements of the galaxy mass assembled in spheroids and discs down to the low-mass regime should provide important constraints on the ability of cosmological simulations to reproduce realistic structural properties for entire galaxy populations.
A number of authors have now produced measurements of the relative mass contribution of galaxy bulge and disc structures at low redshift, with the broad conclusion that galaxy stellar mass is nearly equally divided between spheroid and disc structures (e.g. Benson et al.2007; Driver et al.2007; Gadotti2009). These studies differ subtly in the detailed mass breakdown, however, with estimated disc mass contributions ranging from 35 to 50 per cent (e.g. Benson et al.2007; Gadotti2009; Thanjavur et al.2016) or up to 59 per cent in the case of Driver et al. (2007).
In order to constrain spheroid and disc masses for large galaxy samples, measurements of this type rely on photometric decompo-sitions of composite bulge and disc systems. A number of photo-metric structure decomposition codes have been developed for this purpose, includingGIM2D(Simard et al.2002),BUDDA(De Souza,
Gadotti & dos Anjos2004),GALFIT(Peng et al.2010), and IMFIT
(Erwin2015). Regardless of the decomposition routine used, un-derstanding possible fitting systematics and estimating realistic pa-rameter uncertainties is crucial to making an accurate estimate of the galaxy spheroid and disc mass budget in a large galaxy sample. In a recent analysis usingGALFIT, Lange et al. (2016) address these issues by considering a large grid of structural fits with an array of initial guess parameters for each galaxy. The variety of initial model parameters guards against convergence to local rather than global minima in model fit parameters, and realistic systematic uncertain-ties are derived for fit parameters by quantifying the spread in the full ensemble of fit models for each galaxy.
In this work, we derive a new measurement of the stellar mass budget of galaxy spheroids and discs using the Lange et al. (2016) structural decomposition of Galaxy and Mass Assembly survey (Driver et al.2009,2011) galaxies. We summarize our data and analysis methods in Sections 2 and 3. We then present separate bulge and disc stellar mass function fits for galaxies of various morphological types and derive estimates of the total galaxy stellar mass density of bulges and discs in Section 4, finding a nearly equal division been spheroid and disc mass in the local Universe. We also
quantify the variation of spheroid-to-disc-mass ratio as a function of galaxy mass and group halo mass, finding that spheroid mass is only dominant at the highest galaxy and group halo mass scales. We briefly summarize and discuss these results further in Section 5.
A standard cosmology of (H0,m,)=(70 km s−1Mpc−1, 0.3, 0.7) is assumed throughout this paper, and h0.7 = H0/(70 km s−1 Mpc−1) is used to indicate theH0dependence in
key derived parameters.
2 T H E G A M A I I S T R U C T U R E S A M P L E
Our data is taken from the Galaxy and Mass Assembly survey phase II, known as GAMA II. GAMA is a combined spectroscopic and multi-wavelength imaging survey designed to study both galaxy-scale and large-galaxy-scale structure (see Driver et al.2009,2011for an overview and Hopkins et al.2013for details of the spectroscopic data). The survey, after completion of phase II (Liske et al.2015), consists of three equatorial regions and two non-equatorial regions. The equatorial regions span approximately 5◦in Dec and 12◦in RA, centred in RA at approximately 9h(G09), 12h(G12) and 14.5h
(G15). We use the three equatorial regions in this study, which are
>98 per cent redshift complete tor<19.8 mag (Liske et al.2015) and combined total a sky area of 180 deg2.
Within the GAMA equatorial regions, our structural fitting sam-ple is derived from the GAMA II visual morphology catalogue (Moffett et al. 2016), which contains ∼7500 objects from the GAMA tiling catalogue (TilingCatv44; Baldry et al.2010) with survey_class ≥1, extinction-corrected Sloan Digital Sky Survey (SDSS; York et al. 2000) r-band Petrosian magnitude of r <
19.8 mag, local flow-corrected redshift 0.002 < z < 0.06, and normalized redshift quality nQ>2 (GAMA DistancesFramesv12; Baldry et al.2012). These objects are visually classified into E, S0-Sa, SB0-SBa, Sab-Scd, SBab-SBcd, Sd-Irr, and “little blue spheroid” (LBS) galaxy types. We also judge 25 objects to be non-galaxy targets in the visual classification process (Moffett et al.
2016). These non-galaxy objects are subsequently omitted from our structural fitting sample.
3 M E T H O D S
In this section, we briefly describe the procedure used for the GAMA II structural fitting analysis and our methods for deriving stellar mass function fits to the spheroid and disc populations.
3.1 Structural fitting and decomposition
The structure sample of 7506 galaxies (see Fig.1), excluding non-galaxy targets and one non-galaxy that is too large in angular size for effective analysis, has been fit in the SDSSrband with two-dimensional Sersic (1968) profile models. We use the structural fits described in detail by Lange et al. (2016). This fitting procedure in-volves the use ofGALFIT(Peng et al.2010) as implemented using the SIGMAwrapper code developed for GAMA by Kelvin et al. (2012).
Figure 1. The GAMA II structural decomposition sample in redshift versus stellar mass space (grey points), with green points indicating the sliding volume-limited subsample of galaxies we use to derive spheroid and disc stellar mass function fits. The red line indicates the mass limit as a function of redshift discussed in Section 3.2.
Of the 7506 sample galaxies, 5259 have been morphologically classified as single-component systems, while 2247 have been sified as two-component systems. We use these morphological clas-sifications to inform whether single-S´ersic or double-S´ersic models are most appropriate and default to model parameters derived from single-component fits for E, Sd-Irr, and LBS systems and double-component fits for S0-Sa and Sab-Scd systems. We note that barred galaxies identified in our visual morphology classification (types SB0-SBa and SBab-SBcd) are considered in the same category as their unbarred counterparts, as we find a low ∼12 per cent bar fraction in this sample. Since the most complicated models we fit in this analysis are effectively bulge plus disc models, it is likely that the central component masses for this small population of barred galaxies will actually reflect both bulge and bar masses.
Lange et al. (2016) identify a sample of two-component systems where the final derived fits include S´ersic bulgenvalues that are smaller than the discnvalues. These systems are flagged for exclu-sion in the derived component mass-size relation fits if they have discn>2 or underestimated parameter uncertainties (100 S(B)0-S(B)a and 215 S(B)0-S(B)ab-S(B)cd galaxies excluded). These objects have a similar stellar mass distribution to their parent morphological type categories. We test whether or not the exclusion of these ob-jects would alter the shape of our derived mass function fits and find that the S0-Sa bulge/disc mass function knee and slope parameters are consistent within estimated uncertainties whether these objects are included or excluded. The mass function shape parameters for separate Sab-Scd bulge and disc components differ slightly if these objects are excluded, however as we discuss further in Section 4.1 we find that single-S´ersic fits are sufficient to describe this popula-tion and therefore do not include the Sab-Scd bulge plus disc fits in our final analysis. Since the exclusion of genuine objects would alter our mass function normalization and the shape parameters of the mass functions we employ in our final analysis are not affected by the inclusion/exclusion of these objects, we elect to include them in our analysis.
Our structural fits for two-component systems yield bulge-to-total luminosity ratios, but we do not assume that these ratios translate directly to bulge-to-total mass ratios. Instead, we estimate the stellar mass contained in bulge and disc components separately, using the Taylor et al. (2011) calibration that relates optical colour (g−i) and
mass-to-light ratio to stellar mass (see Lange et al.2016for complete description). Briefly, we calculate this estimate by combining SDSS
r-band bulge and disc magnitudes withgritotal and central PSF magnitudes measured using theLAMBDARphotometry code (Wright
et al.2016). We assume that PSF colours are equivalent to bulge colours and that bulge and disc fluxes sum to equal the total flux in each band. With these assumptions, we derive bulge and discg−i
colours andi-band magnitudes, which we use to estimate component stellar masses according to the Taylor et al. (2011) relation:
logM∗/M = −0.68+0.7 (g−i)−0.4 (Mi−4.58). (1)
For single-component galaxies, we use the total galaxy stellar mass estimates of Taylor et al. (2011) derived using GAMA op-tical photometry and stellar population synthesis modelling with a Chabrier (2003) initial mass function. We include the additional mass scaling factors discussed by Taylor et al. (2011) that account for light missed in finite-size GAMA apertures by comparison to S´ersic measures of total flux from Kelvin et al. (2012).
As has been discussed frequently in the literature, it is impor-tant to consider how internal dust attenuation can alter not only the observed flux but also the structural parameters we infer from photometric data (e.g. Byun, Freeman & Kylafis1994; Evans1994; M¨ollenhoff, Popescu & Tuffs2006; Gadotti, Baes & Falony2010; Pastrav et al.2013a). Particularly relevant to this analysis, Gadotti et al. (2010) and Pastrav et al. (2013b) found that dust effects can cause underestimation of both bulgenvalues and bulge-to-disc ra-tios. Further, Driver et al. (2007) found that theB-band luminosity functions used to infer bulge and spheroid stellar mass densities required significant inclination-dependent corrections for such in-ternal attenuation effects.
As a result of these concerns, we test whether or not our main products, the stellar mass functions of spheroids and discs, may require additional inclination-dependent corrections. First, consid-ering the colours that are used to derive component mass estimates, we find that there is no overall trend between our measured com-ponent colours and the comcom-ponent axial ratios, implying that our colours are not affected by residual reddening in more edge-on ob-jects. Further, we consider the mass functions we infer from both bulge and disc components of our two-component galaxies subdi-vided by inclination ranges. We estimate photometric inclination for each galaxy asi=cos−1((b/a)2−q2
o)/(1−qo2) (whereb/a is the photometric axial ratio and the flattening parameter qo is
assumed to be 0.2). We then split our sample into three broad incli-nation categories chosen to have approximately equal numbers in each category (see Fig.2). Examining the bulge and disc compo-nent mass functions, we find no obvious shift in the mass functions. Some small-scale differences in the three inclination categories can be seen, however the differences in the binned mass functions are in general comparable to the Poisson error bars on these points. As a result, we conclude that despite the fact that internal attenuation should affect structural measurements for individual galaxies in an inclination-dependent fashion, our mass functions averaged over entire populations appear to be insensitive to this effect, at least within the uncertainties implied by our sample and survey size.
3.2 Maximum likelihood stellar mass function fits
97.7 per cent complete and unbiased with respect to galaxy colour. We fit a smooth function to the same mass limits as a function of redshift, given byMlim=4.45+207.2z−3339z2+18981z3, and
require the sample we use for mass function fitting to have stellar mass greater than the appropriate mass limit evaluated at its redshift (see Fig.1). As in Moffett et al. (2016), we also exclude a small number of objects from our sample (26), whose automatedly derived photometric apertures have been flagged as erroneously large and had been assigned erroneously high stellar mass estimates. These objects are primarily in the Sd-Irr class, by far the most numerous class in our sample. The exclusion of these few objects is expected to cause minimal mass incompleteness due to their small fractional contribution to their respective classes.
To derive fits to the stellar mass distributions of the spheroid and disc populations of GAMA II, we employ a parametric maximum likelihood fitting method (e.g. Sandage, Tammann & Yahil1979; Efstathiou, Ellis & Peterson1988), which is also used by Moffett et al. (2016) to derive morphologically defined stellar mass func-tion fits. Our approach is similar to that described by Robotham, Phillipps & de Propris (2010), where the probability density func-tion (PDF) for each galaxy in mass space is represented by a single Schechter (1976) type functional form:
(logM)d logM =ln(10)×φ∗10log(M/M∗)(α+1)
×exp(−10log(M/M∗))d logM (2)
where M∗is the characteristic mass corresponding to the position of the ‘knee’ in the mass function, whileαandφ∗refer to the low-mass slope of the low-mass function and the normalization constant, respectively.
For this fitting method, the PDF that represents each galaxy must integrate to a total probability of one over the stellar mass range of detection. Since our sample is apparent magnitude limited, the relevant stellar mass interval for this integration varies as a function of redshift, and for each galaxy in our sample, the lower integration limit is set by the sample mass limit at its redshift, i.e. the sliding sample mass limit function described previously. For the individ-ual structuralcomponentsof multi-component galaxies, applying a lower integration limit set by the systemic mass limit would lead to integration limits that do not necessarily encompass the measured component mass itself (depending on the component-to-total-mass ratio). As a result, we take the lower integration limits for compo-nents to be equal to the systemic mass reduced by the component-to-total-mass ratio of each component. To avoid biasing the mass function fits for the separate components, we must also consider whether or not individual component masses would fall below the overall sample mass limit if they were found in isolation. Thus, we omit galaxy components from our fits if they are below our over-all mass fitting limit. We do not attempt to fit mass distributions below a global limit of log(M∗/M)=8, below which we expect significant surface-brightness-based incompleteness in GAMA (see Baldry et al.2012for further details). Through this variable mass limit approach, each galaxy or galaxy component’s PDF is nor-malized to account for our redshift-dependent selection function, analogous to the application ofV/Vmaxsample weights.
The galaxy PDFs are summed over the entire chosen sample to give the likelihood function that is then maximized to derive the most likely Schechterαand M∗parameters. We use a Markov Chain Monte Carlo (MCMC) procedure for this analysis, implemented in
the contributedRpackageLaplacesDemon.1We choose to use the
Componentwise Hit-And-Run Metropolis (CHARM) algorithm in this package and specify only a flat/uniform prior on fit parameters. We perform a minimum of 10 000 iterations for each fit (fits are also carried out 10 times for each class in order to derive jackknife errors on the fit parameters as discussed in Section 4) but also check for convergence using theConsortfunction ofLaplacesDemonand in-crease iterations performed for some classes where necessary. Since this procedure does not directly fit for the overallφ∗normalization parameter, we derive this value for each population through compar-ison to its observed number density. We require that the integrated Schechter function match the summed galaxy number distribution over a mass interval in which galaxy populations are well sampled (9<log(M∗/M)<10 for all types except Es where we sum up to log(M∗/M)=11 for improved statistics).
4 R E S U LT S
Fig.3illustrates the derived spheroid and disc stellar mass function fits for the individual morphological type categories in our sam-ple (fit parameters reported in Table1and binned mass function data points provided in an electronic table with columns described in Table2). Single Schechter functions provide a reasonable de-scription of each spheroid/disc population. For the morphological classes considered to be single-component systems (E, LBS, and Sd-Irr), these fits are effectively identical to the global morpho-logical type stellar mass function fits reported by Moffett et al. (2016), which expanded on the GAMA phase I analysis of Kelvin et al. (2014). For the assumed multi-component systems (S0-Sa and Sab-Scd), we derive separate bulge (or central component) and disc (outer component) stellar mass function fits. In both multi-component populations, the bulge and disc stellar mass functions differ significantly for the same galaxy type. Differences inM∗and
αSchechter-function parameters between separate populations are illustrated in Fig.4along with their associated error contours. To derive robust error contours, we use a jackknife resampling pro-cedure that divides our sample into 10 subvolumes and consider the full two-dimensional posterior probability distributions for the parameters of all resulting fits. For the Sab-Scd population, we also illustrate the stellar mass function fit contours derived from a single-component treatment of Sab-Scds in addition to the indi-vidual component fits. As we motivate in the next section, we will choose to proceed with this single-component parametrization of the Sab-Scd population when deriving total mass estimates.
4.1 Combined spheroid and disc stellar mass functions
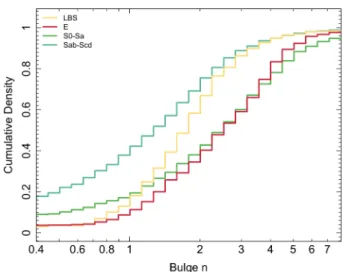
To construct combined mass functions for all spheroid-like and disc-like populations, we consider the single-component systems in the E category to consist of pure spheroids. We consider the single-component systems in the Sd-Irr category to consist of pure discs. As illustrated in Fig.5, the LBS population displays a bulge S´ersicn
distribution that appears more skewed to lownvalues than the pro-totypical spheroids of the E population. This would seem to suggest that LBS galaxies may not closely resemble typical spheroids but rather have more in common with ‘pseudobulges’ that typically dis-play bulgen≤2 (e.g. Kormendy & Kennicutt2004; Fisher & Drory
2008). Pseudobulges are believed to differ from Es/classical bulges structurally, more closely resembling rotating discs (e.g. Carollo
Figure 2. Stellar mass functions for the bulge (left-hand panel) and disc (right-hand panel) components of our two-component (S0-Sa and Sab-Scd) systems. Each population has been divided into three separate, approximately equally sampled, inclination categories. No clear trend in stellar mass function shape as a function of inclination is observed.
Figure 3. Spheroid (left-hand panel) and disc (right-hand panel) stellar mass functions for different morphological classes, as fit by single Schechter functions. Although we do not fit directly to the binned galaxy counts, we show these data along with the fits for illustrative purposes, using common 1/Vmaxweights for
objects in 0.3 dex stellar mass bins as defined by Lange et al. (2015) and with Poisson error bars on the data counts. Error ranges for the individual MSMF fits are indicated by sampling 1000 times from the full posterior probability distribution of the fit parameters and plotting the resulting sampled mass functions with transparency such that darker regions indicate roughly 1σuncertainties on the fits. The combined mass function of all components is shown in black, and we also plot the double Schechter total mass function of Kelvin et al. (2014) for comparison.
1999; Kormendy & Kennicutt2004). However, considerable ambi-guity remains regarding the possibility of separating classical bulge and pseudobulge populations (see the review of Graham2013and references therein). Adding further complexity, Lange et al. (2016) find that the mass versus size relation of LBSs is actually compat-ible with that of Es. Thus, with this ambiguity in mind, we refrain from including this population within either combined spheroid or disc mass function fit at this time and choose to report mass totals for this population separately.
For the multi-component systems of S0-Sa and Sab-Scd types, the obvious choice is to consider the central/bulge component of each class as a part of the spheroid population and the outer component as a part of the disc population. However, as shown in Fig.5, the Sab-Scd bulge S´ersic index (n) distribution again suggests typically low
Table 1. Single Schechter stellar mass function fit parameters for the spheroid and disc stellar mass functions in Figs3and6. Columns are: the knee in the Schechter function (M∗), the slope (α), and
the normalization constant (φ∗). Quoted uncertainties are derived from the spread in each parameter’s
posterior probability distribution from fits carried out in 10 jackknife resampling iterations.
Population log(M∗h0.72/M) α φ∗/10−3
(dex−1Mpc−3h 0.73)
E 11.02±0.055 −0.887± 0.034 0.866+−00..080078
S0-Sa bulges 10.15±0.033 −0.179± 0.056 2.84+−00..08911 S0-Sa discs 10.43±0.036 −0.337± 0.050 2.06+−00..1112 Sab-Scd bulges 9.868±0.033 −0.54± 0.040 2.94+−00..1112
Sab-Scd discs 10.29±0.045 −0.852± 0.032 1.63+−00..1010 Sab-Scd combined 10.40±0.034 −0.736± 0.034 2.42+−00..1515 Sd-Irr 9.647±0.065 −1.58± 0.062 1.67+−00..4231
LBS 9.31±0.11 −1.66± 0.15 0.713+−00..3725
All spheroids 10.60±0.035 −0.623± 0.029 3.70+−00..1515 All discs 10.73±0.033 −1.20± 0.016 1.72+−00..1212
Table 2. Binned stellar mass function data points for individual galaxy populations, as shown in Figs3
and6. This table is provided online in machine readable form, with columns as described below.
Column number Column description
1 stellar mass bin midpoints
2–4 E stellar mass function (lower bound, measurement, upper bound) 5–7 S0-Sa bulge stellar mass function (lower bound, measurement, upper bound) 8–10 S0-Sa disc stellar mass function (lower bound, measurement, upper bound) 11–13 Sab-Scd bulge stellar mass function (lower bound, measurement, upper bound) 14–16 Sab-Scd disc stellar mass function (lower bound, measurement, upper bound) 17–19 Sab-Scd combined stellar mass function (lower bound, measurement, upper bound) 20–22 Sd-Irr stellar mass function (lower bound, measurement, upper bound) 23–25 LBS stellar mass function (lower bound, measurement, upper bound) 26–28 All spheroid stellar mass function (lower bound, measurement, upper bound) 29–31 All disc stellar mass function (lower bound, measurement, upper bound)
Figure 4. 1σand 2σ error contours for separate spheroid and disc stellar mass function fits, divided by morphological type. Contours are derived from a jackknife resampling procedure that considers 10 subvolumes and the two-dimensional posterior probability distributions of all resulting fits.
Figure 5. Cumulative distribution of bulge S´ersic index values by mor-phological type. The majority of Sab-Scd bulges display low S´ersic indices more consistent with discy or pseudobulge structures than classical bulges.
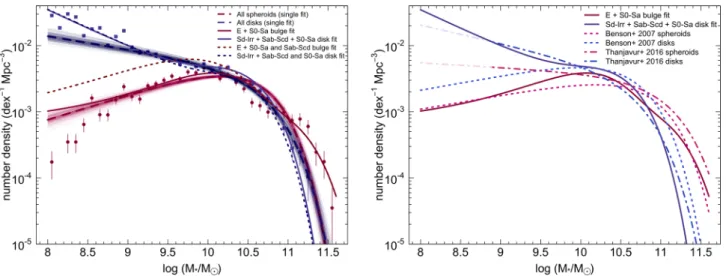
Figure 6. Combined spheroid and disc stellar mass distributions. The left-hand panel shows the spheroid and disc populations fit by single Schechter functions (dark red and blue points and dashed lines, respectively). However, these combined functions are better fit by the summed Schechter function fits to their individual constituents (solid red and blue lines). For comparison, we also show the combined spheroid and disc mass functions that would be derived if Sab-Scd central components were assigned to the spheroid class and Sab-Scd outer components were assigned to the disc class (dotted lines). The right-hand panel compares our preferred combined spheroid and disc mass function fits to those of other authors. Spheroid and disc stellar mass functions from Benson et al. (2007) are plotted with an arbitrary normalization for comparison purposes (red and blue dotted lines), and the equivalent mass functions from Thanjavur et al. (2016) are plotted as red and blue dot–dashed lines (light-coloured line segments indicate the extrapolation of these mass functions below the authors’ mass limit). Data point weights and error ranges are indicated as in Fig.3.
In Fig.6, we show combined spheroid (E plus S0-Sa bulge) and disc (Sab-Scd, Sd-Irr, and S0-Sa disc) stellar mass distributions and Schechter function fits. Both combined spheroid and disc stellar mass functions are poorly fit by a single Schechter function form. As a result, we use the sum of the individual E and S0-Sa bulge Schechter function fits to describe the total spheroid mass distri-bution and the sum of Sab-Scd, Sd-Irr, and S0-Sa disc Schechter function fits to describe the total disc mass distribution. The low-mass end of the combined spheroid low-mass distribution still deviates from this combined function slightly, which is largely due to devia-tions of the E mass function from the best-fitting Schechter function in the lowest few mass bins.
In the right-hand panel of Fig.6, we also compare to the prior combined spheroid disc and stellar mass function results of Ben-son et al. (2007) and Thanjavur et al. (2016). Both sets of results were derived from bulge and disc decomposition analysis of SDSS imaging and were limited in depth by SDSS redshift survey sam-ple magnitude limit (>2 mag brighter than our current sample). Thanjavur et al. (2016) specifically do not fit mass functions below log(M∗/M)=8.9. We indicate the extrapolation of the Thanjavur et al. (2016) mass functions to our nearly one dex lower mass limit by the light-coloured line segments in Fig.6.
Evidently, the Benson et al. (2007) spheroid mass function strongly resembles the spheroid mass function derived in this work, however, the combined disc mass functions diverge significantly, particularly at low mass. The low-mass disc mass function slope we derive is significantly steeper than that of Benson et al. (2007), which suggests that this slope was not well constrained in the ear-lier, relatively shallow sample. The disc mass function of Thanjavur et al. (2016) follows the general shape of our disc mass function over the log(M∗/M)>8.9 fitting region. However, the detailed shapes of these mass functions differ, as the Thanjavur et al. (2016) mass functions are parametrized as single Schechter functions in contrast to our multiple Schechter function combinations.
Our spheroid mass function differs significantly from the Than-javur et al. (2016) mass function at both the high and low-mass end.
Bernardi et al. (2013) specifically discuss apparent discrepancies in the high-mass end of the mass function with reference to ear-lier GAMA-based and SDSS-based results. Bernardi et al. (2013) find that the samez <0.06 upper redshift limit that we currently use eliminates the highest luminosity objects that overlap between the samples. As a result, it is possible that part of this disagree-ment originates from the smaller volume of GAMA, which implies poorer sampling of relatively rare high-mass galaxies. As discussed by Bernardi et al. (2013), differences in the mass-to-light ratios as-sumed for high-mass galaxies can also cause such discrepancies. The reason for our discrepancy compared to the Thanjavur et al. (2016) spheroid mass function at low mass is less clear, however, it likely results from differences in the assignment of components to bulge and disc categories. Thanjavur et al. (2016) use a purely algo-rithmic approach to assigning galaxies to single or multi-component fit categories, which is based on cuts in the probability of various bulge plus disc or single S´ersic models. We use the visual morphol-ogy as a prior on the single or multi-component status, and as a result of the morphology distribution of our sample, the majority of low-mass objects in our sample are fit as single-component, pure disc systems. While the typical B/T values derived by Thanjavur et al. (2016) are low at low mass, these bulges added together create a spheroid mass distribution with a relatively flat low-mass slope. It is currently unclear whether these low-mass bulges are more consistent with discy pseudobulges or classical spheroids.
4.2 Total spheroid and disc mass densities
Fig. 7 illustrates the total stellar mass density (ρ∗) values of spheroid/disc populations as a function of the stellar mass inter-val. For each spheroid/disc category, the peak of the stellar mass density distribution is well sampled, and our total stellar mass den-sity estimates appear to be bounded within the limits of this sample. We derive total stellar mass density estimates for each structural category from both direct data summation usingV/Vmax weights
Figure 7. Total mass density of spheroids and discs in separate classes, where points indicate the data values (with 1/Vmaxweights), and lines indicate values
derived from our Schechter function fits. Mass density estimates are bounded for each individual class. Error ranges on these fits are indicated as in Figs3
and6.
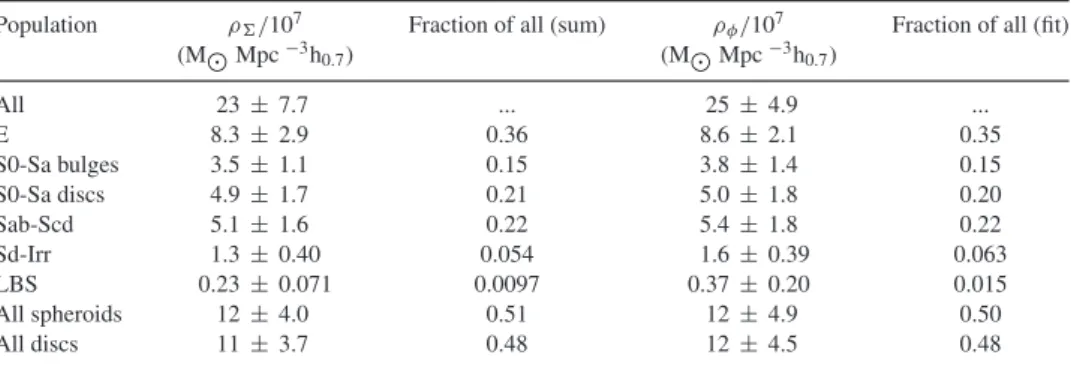
Table 3. Stellar mass densities for each spheroid/disc category, derived both by summation of data withV/Vmax
weights (ρ) and integration of stellar mass functions (ρφ). A fraction of the total stellar mass is also given for each category and method. Quoted uncertainties are derived according to a jackknife resampling procedure as described in Section 4.2. Derived stellar mass density estimates are also subject to an additional 22.3 per cent error contribution from cosmic variance, estimated by the method of Driver & Robotham (2010).
Population ρ/107 Fraction of all (sum) ρφ/107 Fraction of all (fit) (MMpc−3h0.7) (MMpc−3h0.7)
All 23± 7.7 ... 25± 4.9 ...
E 8.3± 2.9 0.36 8.6± 2.1 0.35
S0-Sa bulges 3.5± 1.1 0.15 3.8± 1.4 0.15
S0-Sa discs 4.9± 1.7 0.21 5.0± 1.8 0.20
Sab-Scd 5.1± 1.6 0.22 5.4± 1.8 0.22
Sd-Irr 1.3± 0.40 0.054 1.6± 0.39 0.063
LBS 0.23± 0.071 0.0097 0.37± 0.20 0.015
All spheroids 12± 4.0 0.51 12± 4.9 0.50
All discs 11± 3.7 0.48 12± 4.5 0.48
summarizes the stellar mass density estimates along with uncer-tainties derived using the same jackknife resampling procedure as in Moffett et al. (2016). All such estimates are subject to an addi-tional error term from cosmic variance. With the method of Driver & Robotham (2010), we estimate a 22.3 per cent cosmic variance error contribution within our sample volume.
Integrating our combined stellar mass function fits, we find a total spheroid stellar mass density ρspheroid = 1.24± 0.49 ×
108M
Mpc−3h
0.7, which translates to∼50 per cent of the
to-tal stellar mass density. Breaking down the mass density further, 35 per cent of the total is contributed by Es, and 15 per cent is contributed by S0-Sa bulges. Disc-like structures are found to have mass densityρdisc= 1.20±0.45×10⁸M Mpc−3h0.7, which
The spheroid/disc mass fractions we derive are consistent with previous results that have found approximately equal mass in spheroid and disc structures (e.g., Schechter & Dressler 1987), which include the recent GAMA-based estimates of Kelvin et al. (2014) and Moffett et al. (2016) that used a simple assumption of constant spheroid-to-total mass ratio within each morphology cat-egory. Bracketing our result, Benson et al. (2007) estimated a disc mass fraction of 35–51 per cent, where the lower fraction is deter-mined with a correction to theluminosityfunction bias in the sample inclination distribution (see e.g. Tasca & White2011). Similarly, Gadotti (2009) estimated a lower 36 per cent disc mass fraction but in a sample with a mass limit 2 dex higher than this work. Gadotti (2009) also discuss the comparison to samples with lower mass limit and find that their spheroid/disc mass fractions would indeed be approximately equal within a sample with a significantly lower mass limit.
Similarly, the recent work of Thanjavur et al. (2016) estimates a 37 per cent disc mass fraction in a sample with a mass limit approx-imately one dex higher than this work. As discussed in Section 4.1, the higher spheroid mass fraction results from discrepancies with our spheroid mass function at both high and low masses. It is inter-esting to note that our total mass fraction discrepancy with this result could potentially be resolved through treating our Sab-Scd galaxies as two-component systems. Assuming that the central components of these systems add to the spheroid mass and the outer components add to the disc mass is likely more similar to the Thanjavur et al. (2016) component treatment. In this case, we would find a total disk mass fraction of 39 per cent and a spheroid mass fraction of 59 per cent. However, we find that our actual spheroid massfunction
in this case would still deviate significantly from the Thanjavur et al. (2016) spheroid mass function, as this change primarily affects the shape of the mass function at intermediate masses rather than at low or high mass (see dotted lines in the left-hand panel of Fig.6).
Compared both to this work and to other authors, Driver et al. (2007) derive a slightly higher disk mass fraction of 59 per cent. The higher disk mass fraction may be due in part to the deeper-than-SDSS imaging used in the Driver et al. (2007) analysis, which should enable detection of the outskirts of galaxy disks to lower surface brightness levels than we are able to reach here. Further, the Driver et al. (2007) analysis uses the Millennium Galaxy Catalogue (MGC; Liske et al.2003) sample, which isB-band selected and may plausibly include a larger fraction of blue and likely disk-like objects at fixedmassthan ourr-band selected sample.
The measured balance of spheroid and disk stellar mass atz∼0 provides a fundamental constraint on galaxy formation and evo-lution models, as it effectively results from the detailed interplay between structure formation and destruction processes as they build up the galaxy population over cosmic time. Although we find es-timated disk stellar mass densities slightly lower than Driver et al. (2007), our spheroid and disk stellar mass densities are plausibly consistent with the predicted spheroid/disk stellar mass buildup from the two-phase galaxy formation model of Driver et al. (2013), given the uncertainties and assumptions involved in both. Further, our mass density estimates agree well with an updated version of this model as presented by Andrews et al. (in preparation).
4.3 Variation of the spheroid and disc stellar mass budget
Aside from the global mass balance, the detailed balance between galaxy spheroid and disc mass buildup toz∼0as a function of galaxy mass and environmentcan be measured in both observations and galaxy evolution models. In the following section, we quantify
such variations in the spheroid and disc mass budget using GAMA survey observations.
4.3.1 Spheroid and disc mass as a function of galaxy mass
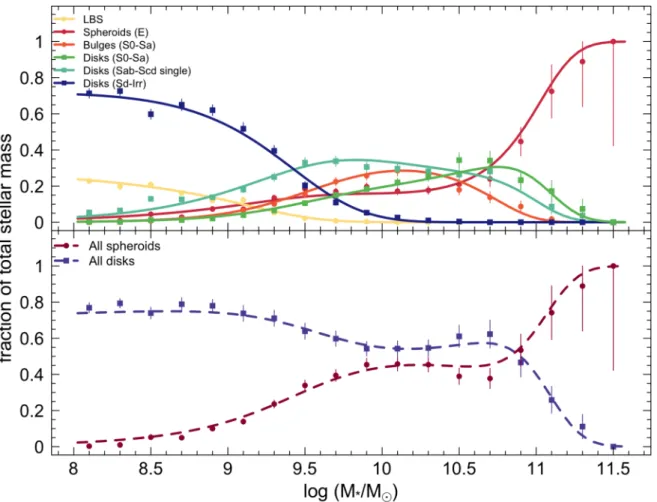
In Fig.8, we show the fraction that each spheroid/disc category in our sample contributes to the total stellar mass density in each galaxy mass bin. The trends shown in this figure are complex, but they reflect a number of expected large-scale galaxy demographic trends, such as the transition from spheroid mass dominance at high mass to disc mass dominance at low mass. For individual galaxy types, we see the E mass dominance at the highest stellar masses give way to S0-Sa discs and bulges at lower mass, then to Sab-Scd galaxies with a broad distribution through the intermediate mass regime, and finally to dwarf Sd-Irr discs with a smaller contribution from LBSs at the lowest masses we probe. The transition between overall spheroid and disc mass dominance occurs at log(M∗/M)
∼10.9 just above the bimodality mass of Kauffmann et al. (2003) at log(M∗/M)∼10.5, where quenched (and presumably spheroid-dominated) galaxies give way to those with recent star formation. Thanjavur et al. (2016) show qualitatively similar trends in the spheroid and disc mass ratios in their fig. 11, but we find more detailed structure in the trends with mass compared to the smooth variation seen in the other work. Thanjavur et al. (2016) also find the transition point between spheroid and disk mass dominance occurs at a slightly lower mass than we find, closer to the bimodality mass.
4.3.2 Spheroid and disc mass as a function of environment
Galaxy structure is well known to vary with the surrounding environment, as through the ‘morphology-density relation’ (e.g. Dressler1980). In Fig.9we examine the balance between spheroid and disc mass as a function of group halo environment specifically, using group identifications derived in the GAMA II group catalogue of Robotham et al. (2011). We also show the division between group central and satellite galaxies as derived from this catalogue. We find that∼54 per cent of the present sample are considered isolated in the GAMA group-finding analysis, i.e. inN=1 haloes. We indi-cate the spheroid-to-total ratios for these points by the red ‘isolated’ points in this figure. A small number (<40) of our sample galaxies are found in slightly lower mass groups than we plot here. How-ever, any bins with Mhalo<1010Mh−1are sparsely populated and
dominated by low-Ngroups (N≤4) for which derived group halo mass estimates are less reliable, so we refrain from analysing these lower mass systems here.
The left-hand panel of this figure illustrates the median and spread in the distribution of spheroid mass divided by total mass of indi-vidual galaxies in both isolated and grouped environments. From this figure, we find that the isolated objects are primarily disc dom-inated, while there is extremely large spread in individual galaxy spheroid-to-total-mass ratios within each halo mass bin. In general, similar degrees of spread in spheroid-to-total-mass ratios are found for both central and satellite galaxies, which could indicate that this spread is driven in part by group-to-group variations within each halo mass bin. The median trend for satellite galaxies (and for the combined sample) rapidly flattens to a typically zero spheroid mass ratio (i.e. pure disc) by group halo mass∼1013M
h−1, however,
the typical spheroid mass fraction among central galaxies remains nonzero to slightly lower group mass∼1012.5M
h−1. This marginal
Figure 8. Fraction of total stellar mass contributed by each population as a function of stellar mass regime, where points indicate data totals and lines are derived from our Schechter function fits. Due to their indeterminate nature, LBSs are excluded from combined spheroid and disc categories.
Figure 10. Spheroid to total mass ratios for satellite galaxies, as a function of projected radius from the group centre position. The left-hand panel shows the per-galaxy median (squares) with estimated 1σerrors on the median (dark bars) and the interquartile range of the data (light bars). The right-hand panel shows the summed total for all objects in each bin with 1σ error bars on the fraction in each bin indicated by vertical bars (due to their indeterminate nature, LBSs are excluded from either spheroid or disk category here).
tend to be more massive than satellites within a given halo mass bin and are correspondingly more likely to be spheroid dominated.
The right-hand panel of Fig.9examines the relationship between spheroid mass ratio and group environment in an integrated sense, where we sum the total stellar mass of all objects in each group environment bin and plot the total spheroid mass in each bin di-vided by the total stellar mass of all components. We find a strong decrease in the spheroid mass fraction going from high to low group halo masses, with the mass fraction for low-mass groups similar to that for isolated systems. For satellite galaxies, spheroids only dom-inate the mass budget for the highest mass groups we probe, above
Mhalo∼1013.5Mh−1. The transition between integrated spheroid
and disc mass dominance for group central galaxies occurs at a lower group halo mass Mhalo∼1012.5Mh−1, again likely
reflect-ing the positive correlation between galaxy mass and spheroid mass ratio.
The simulations of Sales et al. (2012) examined the role of group halo properties in galaxy spheroid/disc formation and found galaxy structure to be poorly correlated with host halo properties but strongly correlated with the alignment of gas accreted into the halo. However, only a narrow range of galaxy host halo masses were considered for this analysis (similar to the halo mass of the Milky Way), which is within the regime where we find flat spheroid mass ratios as a function of group halo mass. In general, there is reason to expect a correlation between host halo environment and structure formation in simulations as well as observations. Haloes in high density environments may be expected to collapse earlier than those in less dense environments and thus be more concentrated and likely to host lower angular momentum, more spheroid-dominated galaxies (e.g. as discussed by Romanowsky & Fall2012). Repro-duction of the mass ratios of galaxy spheroid and disc structures observed across a variety of environments should provide a use-ful test of future developments in cosmological galaxy formation models.
With the GAMA data set, we can also examine spheroid and disc mass trends internal to groups. For the satellite galaxy population specifically, it is likely that the spread in spheroid-to-total mass ratio at fixed halo mass is at least partially driven by residual variations of spheroid mass ratio with distance from each group’s centre. To
investigate this trend, we use the projected distance of each galaxy from the iterative group centre position (R) and scale these radii by a characteristic radius for each group,Rgroup, which we take as
the radius encompassing 50 per cent of the group members from Robotham et al. (2011).
Similar to Fig. 9, Fig. 10 illustrates the variation of spheroid mass ratio with distance from the group centre for both individ-ual galaxies (left-hand panel) and for summed totals in radius bins (right-hand panel). We find that satellite galaxies still display signif-icant per-galaxy variation in spheroid-to-total ratio at fixed radius, which implies that other factors such as group-to-group variations or galaxy mass segregation drive additional scatter at fixed radius. We note, however, that the recent analysis of Kafle et al. (2016) has found no evidence for mass segregation of the satellite popu-lation as a function of radius in the GAMA groups. In spite of the scatter at fixed radius, a clear trend exists whereby spheroid mass fraction increases as distance from the cluster centre decreases. In the cluster outskirts, the typical satellite galaxy is disc dominated, and spheroid-dominated satellite galaxies are only the norm in the lowest radius bin we probe. In an integrated sense, the total mass budget for group satellites becomes spheroid dominated just below the characteristic 50th percentile group radius (as indicated by the dashed lines in Fig.10).
Lackner & Gunn (2013) take a similar quantitative approach in measuring the disc-to-total mass ratios of galaxies, finding a very weak dependence of D/T on local projected fifth nearest neighbour density but a stronger trend between D/T and group crossing time (proportional to distance from the group centre) that matches the sense of our mass ratio trend. Lackner & Gunn (2013) propose that galaxy harassment (Moore et al.1996), which is most effective in high density regions where high-speed galaxy–galaxy encounters are likely, is a plausible explanation for this trend. In this scenario, our results would imply that galaxy harassment is most effective at converting disc mass to bulge mass in relatively rich group/cluster environments and within the 50th percentile group radius.
5 S U M M A RY A N D C O N C L U S I O N S
Using the recently expanded Galaxy and Mass Assembly (GAMA) survey phase II visual morphology sample and the large-scale bulge and disc decomposition analysis of Lange et al. (2016), we derive new stellar mass function fits to galaxy spheroid and disc popula-tions down to log(M∗/M)=8. We find an approximately equal division between the total stellar mass densities of galaxy spheroid and disc populations, which is broadly consistent with prior results albeit with a somewhat lower disc mass fraction than observed by Driver et al. (2007). The fact that Driver et al. (2007) used deeper imaging data than in our current analysis raises the intriguing possi-bility that the planned future extension of GAMA structural analy-sis to use deeper and higher resolution Kilo-Degree Survey imaging (KiDS; De Jong et al.2013) could yield disc galaxies undetected within our current surface brightness limits or larger and more mas-sive discs in existing galaxies. The resolution of KiDS imaging will also allow us to extend the GAMA structural analysis to higher redshift, improving the sampling of high-mass galaxies and poten-tially resolving a discrepancy with the high-mass end of the mass function as seen in the larger SDSS volume. Further, we find a small (few percent) of our total stellar mass density in the LBS (little blue spheroid) population, which is not a clearly identified as either a spheroid or disc population at present. Future investigations with KiDS imaging should allow us to better resolve the structural characteristics of these objects, including their potential for hosting low-surface-brightness outer envelopes.
Finally, we examine the variation of the total disc and spheroid mass balance as a function of galaxy mass and group environment. We find strong overall population trends with both galaxy mass and group halo mass, where spheroids dominate the galaxy mass budget above galaxy stellar mass∼1011M
and above group halo mass∼1012.5M
h−1. Further, we find differences in the mass
bud-get of satellites and centrals, where satellites are only spheroid dominated within higher group halo mass environments (Mhalo>
1013.5M
h−1). This difference is related to the typically lower
masses of satellites compared to centrals at fixed halo mass. We also examine satellite galaxy spheroid-to-total mass ratio trends with radius from the group centre, finding that spheroids dominate the mass budget of satellite galaxies within the 50th percentile group radius. This trend towards spheroid dominance at low group-centric radius is likely due to mechanisms that are most effective at trans-forming morphology where galaxy densities and encounter speeds are high, such as galaxy harassment (Moore et al.1996).
These measurements, which are currently possible from photo-metric galaxy decompositions in large survey samples, provide a useful basis for comparison with the detailed structural demograph-ics of simulated galaxies. In the future as samples of kinematic galaxy surveys continue to grow (e.g. from the SAMI survey of
3000 galaxies to the MaNGA survey of 10 000 galaxies; Bryant et al.2015; Bundy et al.2015), the division between spheroid-like and disc-like galaxydynamicswill be possible on similarly large scales, providing an even more direct constraint on models of galaxy structural evolution.
AC K N OW L E D G E M E N T S
We thank Alister Graham, Anne Samson, and the anonymous ref-eree for helpful comments on this manuscript. SPD and AJM ac-knowledge funding support from the Australian Research Council under Discovery Project 130103505.
GAMA is a joint European–Australasian project based around a spectroscopic campaign using the Anglo–Australian Telescope. The GAMA input catalogue is based on data taken from the Sloan Digital Sky Survey and the UKIRT Infrared Deep Sky Survey. Com-plementary imaging of the GAMA regions is being obtained by a number of independent survey programmes includingGALEXMIS, VST KiDS, VISTA VIKING,WISE,Herschel-ATLAS, GMRT and ASKAP providing UV to radio coverage. GAMA is funded by the STFC (UK), the ARC (Australia), the AAO, and the participating institutions. The GAMA website ishttp://www.gama-survey.org/.
Funding for the SDSS and SDSS-II has been provided by the Alfred P. Sloan Foundation, the Participating Institutions, the National Science Foundation, the U. S. Department of Energy, the National Aeronautics and Space Administration, the Japanese Monbukagakusho, the Max Planck Society, and the Higher Ed-ucation Funding Council for England. The SDSS Web Site is
http://www.sdss.org/. The SDSS is managed by the Astrophysical Research Consortium for the Participating Institutions. The Par-ticipating Institutions are the American Museum of Natural His-tory, Astrophysical Institute Potsdam, University of Basel, Univer-sity of Cambridge, Case Western Reserve UniverUniver-sity, UniverUniver-sity of Chicago, Drexel University, Fermilab, the Institute for Advanced Study, the Japan Participation Group, Johns Hopkins University, the Joint Institute for Nuclear Astrophysics, the Kavli Institute for Par-ticle Astrophysics and Cosmology, the Korean Scientist Group, the Chinese Academy of Sciences (LAMOST), Los Alamos National Laboratory, the Max-Planck-Institute for Astronomy (MPIA), the Max-Planck-Institute for Astrophysics (MPA), New Mexico State University, Ohio State University, University of Pittsburgh, Univer-sity of Portsmouth, Princeton UniverUniver-sity, the United States Naval Observatory, and the University of Washington.
The VIKING survey is based on observations with ESO Tele-scopes at the La Silla Paranal Observatory under the programme ID 179.A-2004.
R E F E R E N C E S
Baldry I. K. et al., 2010, MNRAS, 404, 86 Baldry I. K. et al., 2012, MNRAS, 421, 621
Benson A. J., Dˇzanovi´c D., Frenk C. S., Sharples R., 2007, MNRAS, 379, 841
Bernardi M., Meert A., Sheth R. K., Vikram V., Huertas-Company M., Mei S., Shankar F., 2013, MNRAS, 436, 697
Bournaud F., Dekel A., Teyssier R., Cacciato M., Daddi E., Juneau S., Shankar F., 2011, ApJ, 741, L33
Brook C. B. et al., 2011, MNRAS, 415, 1051
Brooks A., Christensen C., 2016, Galactic Bulges, 418, 317 Bryant J. J. et al., 2015, MNRAS, 447, 2857
Bundy K. et al., 2015, ApJ, 798, 7
Chabrier G., 2003, PASP, 115, 763
Christensen C. R., Brooks A. M., Fisher D. B., Governato F., McCleary J., Quinn T. R., Shen S., Wadsley J., 2014, MNRAS, 440, L51
Cole S., Lacey C. G., Baugh C. M., Frenk C. S., 2000, MNRAS, 319, 168 De Jong J. T. A. et al., 2013, The Messenger, 154, 44
De Souza R. E., Gadotti D. A., dos Anjos S., 2004, ApJS, 153, 411 Dressler A., 1980, ApJ, 236, 351
Driver S. P., Robotham A. S. G., 2010, MNRAS, 407, 2131
Driver S. P., Popescu C. C., Tuffs R. J., Liske J., Graham A. W., Allen P. D., de Propris R., 2007, MNRAS, 379, 1022
Driver S. P. et al., 2009, Astron. Geophys., 50, 12 Driver S. P. et al., 2011, MNRAS, 413, 971
Driver S. P., Robotham A. S. G., Bland-Hawthorn J., Brown M., Hopkins A., Liske J., Phillipps S., Wilkins S., 2013, MNRAS, 430, 2622 Efstathiou G., Ellis R. S., Peterson B. A., 1988, MNRAS, 232, 431 Erwin P., 2015, ApJ, 799, 226
Evans R., 1994, MNRAS, 266, 511
Fall S. M., Efstathiou G., 1980, MNRAS, 193, 189 Fisher D. B., Drory N., 2008, AJ, 136, 773 Gadotti D. A., 2009, MNRAS, 393, 1531
Gadotti D. A., Baes M., Falony S., 2010, MNRAS, 403, 2053 Governato F. et al., 2010, Nature, 463, 203
Graham A. W., 2013, in Oswalt T. D., Keel W. C., eds, Planets, Stars and Stellar Systems Vol. 6. Springer Dordrecht, p. 91
Hopkins P. F. et al., 2010, ApJ, 715, 202 Hopkins A. M. et al., 2013, MNRAS, 430, 2047
Hoyle B., Masters K. L., Nichol R. C., Jimenez R., Bamford S. P., 2012, MNRAS, 423, 3478
Kafle P. R. et al., 2016, MNRAS, in press Kauffmann G. et al., 2003, MNRAS, 341, 33 Kelvin L. S. et al., 2012, MNRAS, 421, 1007 Kelvin L. S. et al., 2014, MNRAS, 444, 1647
Kormendy J., Kennicutt R. C., Jr, 2004, ARA&A, 42, 603 Lackner C. N., Gunn J. E., 2013, MNRAS, 428, 2141 Lange R. et al., 2015, MNRAS, 447, 2603
Lange R. et al., 2016, MNRAS, 462, 1470
Liske J., Lemon D. J., Driver S. P., Cross N. J. G., Couch W. J., 2003, MNRAS, 344, 307
Liske J. et al., 2015, MNRAS, 452, 2087 Moffett A. J. et al., 2016, MNRAS, 457, 1308
M¨ollenhoff C., Popescu C. C., Tuffs R. J., 2006, A&A, 456, 941
Moore B., Katz N., Lake G., Dressler A., Oemler A., 1996, Nature, 379, 613 Parry O. H., Eke V. R., Frenk C. S., 2009, MNRAS, 396, 1972
Pastrav B. A., Popescu C. C., Tuffs R. J., Sansom A. E., 2013a, A&A, 553, A80
Pastrav B. A., Popescu C. C., Tuffs R. J., Sansom A. E., 2013b, A&A, 557, A137
Peng C. Y., Ho L. C., Impey C. D., Rix H.-W., 2010, AJ, 139, 2097 Postman M., Geller M. J., 1984, ApJ, 281, 95
Robotham A., Phillipps S., de Propris R., 2010, MNRAS, 403, 1812 Robotham A. S. G. et al., 2011, MNRAS, 416, 2640
Romanowsky A. J., Fall S. M., 2012, ApJS, 203, 17
Sales L. V., Navarro J. F., Theuns T., Schaye J., White S. D. M., Frenk C. S., Crain R. A., Dalla Vecchia C., 2012, MNRAS, 423, 1544
Sandage A., Tammann G. A., Yahil A., 1979, ApJ, 232, 352 Schechter P., 1976, ApJ, 203, 297
Schechter P. L., Dressler A., 1987, AJ, 94, 563
Sersic J. L., 1968, Observatorio Astronomico, Cordoba, Argentina. Simard L. et al., 2002, ApJS, 142, 1
Somerville R. S., Dav´e R., 2015, ARA&A, 53, 51 Tasca L. A. M., White S. D. M., 2011, A&A, 530, A106 Taylor E. N. et al., 2011, MNRAS, 418, 1587
Thanjavur K., Simard L., Bluck A. F. L., Mendel T., 2016, MNRAS Tran K.-V. H., Simard L., Zabludoff A. I., Mulchaey J. S., 2001, ApJ, 549,
172
Wright A. et al., 2016, MNRAS, 460, 765 York D. G. et al., 2000, AJ, 120, 1579
S U P P O RT I N G I N F O R M AT I O N
Additional Supporting Information may be found in the online ver-sion of this article:
Table 2.Binned stellar mass function data points for individual galaxy populations.
(http://www.mnras.oxfordjournals.org/lookup/suppl/doi:10.1093/ mnras/stw1861/-/DC1)
Please note: Oxford University Press is not responsible for the content or functionality of any supporting materials supplied by the authors. Any queries (other than missing material) should be directed to the corresponding author for the article.