A model for Business Intelligence Systems’ Development
Adela BARA, Iuliana BOTHA, Vlad DIACONIŢA, Ion LUNGU, Anda VELICANU, Manole VELICANU
Academy of Economic Studies, Bucharest, Romania Faculty of Economics Cybernetics, Statistics and Informatics [email protected], [email protected], [email protected],
[email protected], [email protected], [email protected]
Often, Business Intelligence Systems (BIS) require historical data or data collected from var-ious sources. The solution is found in data warehouses, which are the main technology used to extract, transform, load and store data in the organizational Business Intelligence projects. The development cycle of a data warehouse involves lots of resources, time, high costs and above all, it is built only for some specific tasks. In this paper, we’ll present some of the as-pects of the BI systems’ development such as: architecture, lifecycle, modeling techniques and finally, some evaluation criteria for the system’s performance.
Keywords: BIS (Business Intelligence Systems), Data Warehouses, OLAP (On-Line Analytical
Processing), Object-Oriented Modeling
Introduction
The main objective of our research project that we had in one of the multination-al companies from Romania is to develop a decision support system for public institution, so we tried to meet the requests from the ex-ecutives and managers of one national com-pany. We based our work on previous expe-riences, researches, articles and studies that we’d been developed. Thus, we followed the next classical steps: analyze, design, develop and applying for the project lifecycle the framework described in the book [2]. For the implementation phase we used different BI techniques, like data warehousing, OLAP, data mining, portal and we finally succeeded to implement the BI system’s prototype and to validate it with the managers and execu-tives in one national company. The system gathers data, using the ERP system, to extract data from different functional areas or mod-ules such as: financials, inventory, purchase, order management or production. For the ex-ecutives, the system is able to provide analyt-ical reports and dashboards. As the storage solution we designed and build a data ware-house. The major problem is that there will be many more changes in the structure of the organization and the impact of these changes may affect the BI system. So, we need to find a solution, and, based on our previous
re-searches on Object Oriented modeling, we consider it as a good option. In the last years, there have been some proposals to represent MD properties at the conceptual level. As we mentioned in our previous researches, based on the conference paper [1], we defined a set of object-oriented extensions that can be used for modeling the components and require-ments of a data warehouse. Also, we had to consider the system’s development lifecycle that has to be flexible and easy to fulfill. 2 The concept of Business Intelligence Sys-tem
With rapid advances in technology, enter-prises today frequently search for new ways to establish value positions. Well built Busi-ness Intelligence Systems (BIS) can provide the ability to analyze business information in order to support and improve management decision making across a broad range of business activities. They leverage the large data infrastructure investment, for example, in ERP systems made by firms, and have the potential to realize the substantial value locked up in a firm’s data resources [7]. While substantial business investment in BI systems is continuing to accelerate, there is a complete absence of a specific and rigorous method to measure the realized business val-ue, if any. BI systems have the potential to
1
maximize the use of information by improv-ing the company’s capacity to structure a large volume of information and make it ac-cessible, thereby creating competitive advan-tage: “competing on analytics” [15].
BI utilizes a substantial amount of collected data during the daily operational processes, and transforms the data into information and knowledge to avoid the supposition and ig-norance of the enterprises [14].
The main characteristics of a BIS are: the ca-pability of providing representative informa-tion to the high-level management, to support strategic activities such as goal setting, plan-ning and forecasting, and also tracking per-formance, to gather, analyze, and integrate internal and external data into dynamic pro-files of key performance indicators. Based on each executive’s information needs, BIS can
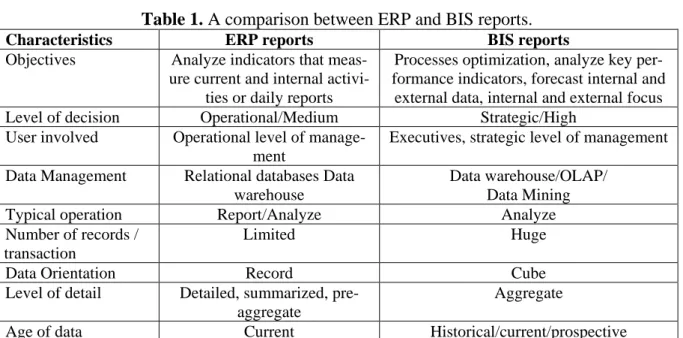
access both historical and real-time data through ad-hoc queries. In essence, managers at every level can have a customized view that extracts information from disparate sources and summarizes it into meaningful indicators. Executives need information for strategic and tactical decision that often re-quires the combination of data from ERP and non-ERP application sources. The usual re-ports developed from daily transactions does not satisfy the business needs, an executive cannot take a real time decision based on a hundred pages per month cash-flow detailed report. Information must be aggregated and presented with a template based on a busi-ness model. In the table below we represent the main differences between ERP reports and BIS reports [2]:
Table 1. A comparison between ERP and BIS reports.
Characteristics ERP reports BIS reports
Objectives Analyze indicators that meas-ure current and internal
activi-ties or daily reports
Processes optimization, analyze key per-formance indicators, forecast internal and
external data, internal and external focus Level of decision Operational/Medium Strategic/High
User involved Operational level of manage-ment
Executives, strategic level of management Data Management Relational databases Data
warehouse
Data warehouse/OLAP/ Data Mining
Typical operation Report/Analyze Analyze
Number of records / transaction
Limited Huge
Data Orientation Record Cube
Level of detail Detailed, summarized, pre-aggregate
Aggregate
Age of data Current Historical/current/prospective
ERP systems are transaction-processing fo-cused and weak on analytics. Strategic and executive manager’s demand for technology solutions that can extract, analyze, and vi-sualize information from ERP and stand-alone systems, and this has provided the mo-tivation for a new type of information tems like BIS. The components of these sys-tems are based on innovative technologies such as data warehousing, OLAP, data min-ing, friendly graphical user interfaces, inte-grating tools capable of collecting, processing, storing and retrieving data from
different sources. The following section de-scribes some of these techniques and the ar-chitecture of the BI systems.
3 Business Intelligence Systems’ Architec-ture
BIS architecture is structured on three dis-tinct levels [2]:
Level 1. Data Management – is represented by relational databases, data warehouses and other type of data sources. At this level is common to use a data warehousing solution that collects and organizes data from both
in-ternal and exin-ternal sources and makes it available for the purpose of analysis. A data warehouse contains both historical and cur-rent data and it is optimized for fast query and analysis. Data warehouses extract, trans-form and process data for high-level integra-tion and analysis.
Although a data warehouse can make it easi-er and more efficient to use the BIS, it is not required for a BIS to be deployed. Organiza-tions can extract data directly from their host system database for their analysis and report-ing purposes, but in a more difficult way.
Level 2. Model Management – is the level of data extraction, transformation and processing. This level is based on different type of models for statistic interpretation, analysis and forecasting data. At this level, we can find technologies like OLAP, data mining and analytical reporting. The OLAP engine is a query generator that provides us-ers with the ability to explore and analyze summary and detailed information from a multi-dimensional database. Traditional rela-tional database systems handle this situation by using multiple queries. In many cases, the queries become so complex that even the de-veloper finds them difficult to maintain. OLAP overcomes this barrier by enabling users to analyze multi-dimensional data. Managers can use an OLAP engine or typical operation like “slice and dice” data by vari-ous dimensions and then drill down into the source data or roll-up to aggregate levels. OLAP provide tools for forecasting data and “what-if” analysis. OLAP can only mark the trends and patterns within the data that was requested. It will not discover hidden rela-tionships or patterns, which requires more powerful tools like data mining (DM). These tools are especially appropriate for large and complex datasets. Through statistical or modeling techniques, data mining tools make it possible to discover hidden trends or rules that are implicit in a large database. Data mining tools can be applied to data from data warehouses or relational databases. Data dis-covered by these tools must be validated and verified and then to become operational data that can be used in decision process. OLAM
(on-line analytical data mining) systems are OLAP systems used for data mining, used to discover new information from multidimen-sional-data.
Level 3. Data Visualization Tools - provide a visual drill-down capacity that can help man-agers examine data graphically and identify complex interrelationships. BIS attempts to present data in a form that is relevant for stra-tegic decisions. At this level, one can find tools for reporting and presenting data in a friendly manner. A very efficient solution that can be used also to integrate data is to develop a business intelligence portal [4]. The main purpose of a BI portal is to inte-grate data and information from a wide range of applications and repositories, in order to allow visualization of a multitude of systems, either internal or external to organizations, through a simple Web interface [5]. There-fore, a BI portal can be seen like a Web-based, secure interface, which can offer a unique integration point for the applications and services used by employees, partners, suppliers and clients of the organization. The main advantage of the information portal is that it can be easily offered as a service to the wide public [16].
4 Business Intelligence Systems’ Develop-ment Lifecycle
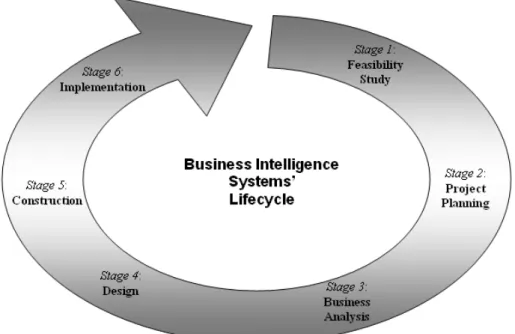
There are some major differences between transactional systems’ lifecycle and BIS life-cycle which depends on decision systems’ characteristics, but the same traditional tech-niques and stages are used for development: initial study, project planning, analysis, de-sign, construction, and implementation (fig-ure 1).
In these stages there are many steps used for modeling BIS characteristics such as [6]:
− orientation towards business opportuni-ties rather than transactional needs;
− the implementation of strategically deci-sions, not only departmental or opera-tional decisions;
− analysis based on business needs, which is the most important of the process;
− cyclical development process, focused on evaluation and improvement of
succes-sive versions, not only building and ma- jor delivering of a singular a final version.
Fig. 1. BIS development lifecycle BIS lifecycle is divided in 6 stages and 16
steps as following [3]:
Stage 1: Justification
Step 1: Business case assessment - business needs and opportunities are identified and then the team proposes an initial solution jus-tified by costs and benefits. A preliminary report is built-up.
Stage 2: Planning
Step 2: Enterprise infrastructure evaluation – this step estimates and values organization’s capabilities to sustain and accomplish the BIS project in terms of: infrastructure, com-ponents, devices, network and also future needs of these equipments. In this step is built organization’s infrastructure.
Step 3: Project planning – BIS involves dy-namical project planning which leads to rapid changes in technology, organization and business needs, human resources and imple-menting team. The project plan is detailed, progressive, each stage and step has checking points and test documents and reports.
Stage 3: Business analysis
Step 4: Defining business needs – interviews and meetings are organized with executives and managers and business needs and re-quirements are identified and defined. An ini-tial solution is proposed, discussed and
adopted.
Step 5: Data analysis – this step involves identifying and designing data sources, de-signing detailed ER diagrams with attributes and references between data. The logical model is designed.
Step 6: Application prototyping – An initial prototype is built and tested in order to vali-date business needs. After testing results are estimated and reported with positive and negative aspects.
Step 7: Metadata analysis – metadata are de-signed and data sources are mapped on meta-data structure. CASE tools are used for de-signing and mapping process.
Stage 4: System design
Step 8: Data design – in this step the logical model is detailed and refined and physical model is designed. The data model for processing and storage are selected from the following options: relational, object oriented and multidimensional model.
Step 9: Designing the ETL process (extract / transform / load) – this step is the most diffi-cult in the entire cycle and depends on quali-ty of data sources. It is recommended that the process should be built in one environment which integrate all modules of the organiza-tion and not separately, on each department.
The rule should be: share one coordinated ETL process.
Step 10: Design metadata repository – if it is used a pdefined solution for metadata re-pository then in this step it is adjusted for project requirements, otherwise a metadata repository is designed in terms of metadata logical model depending on data model: rela-tional, object oriented or multidimensional.
Stage 5: Development
Step 11: ETL development – filtering tools, procedures, operators are used for building ETL process. Data filtering and transforma-tions depends on data sources quality. These sources are different like: files, databases, e-mail, internet, unconventional sources. Step 12: Application development – after prototype validation, building the final appli-cation may be a simple process. Procedures templates and interfaces are re-built; user rights and privileges are granted.
Step 13: Data Mining – executive systems have to implement data mining capabilities in order to succeed and accomplish manager’s requirements. This step involves testing algo-rithms, data mining techniques like clustering, predictive and organizing methods.
Step 14: Developing metadata repository – if the metadata repository has to be built-up then metadata dictionary and data access in-terfaces are developed.
Stage 6: System implementation
Step 15: Implementation – it is the delivering process in which the development team or-ganize training sessions for managers, final documentations and technical support are prepared, data loading process and applica-tion setup is accomplished
Step 16: System testing – after system im-plementation preliminary conclusions are made, costs are estimated and the develop-ment team build a final report in which are describe system performances and also some parts which have to be improved or re-built-up.
5 Business Intelligence Conceptual Design Model
In order to gather data from various sources and ERP systems those are implemented in
an organization from different functional areas or modules such as: financials, invento-ry, purchase, order management, production we need to analyze and design the business model and strategic requests. This model have to be mapped on a logical model and physical model in the data warehouse and al-so used for extracting and presenting data through OLAP technology. These models are known as multidimensional models and basi-cally, they represent an extension of the rela-tional model or ER schema or a multidimen-sional view over facts.
Multidimensional models are classified in two major types: models that are an exten-sion of ER model are based on a star schema and consist in the relationship between some dimensions and facts or measures and n-dimensional cube based models that use a multidimensional view over an individual situation or data.
In Business Intelligence Systems, the multi-dimensional model that is used has to be able to overhear the business requests. All we need is a business vision over data structure so the star schema or the n-cube based mod-els have to design and incorporate business aspects or demands not only the facts or the relationship between data. The managers and executives request a synthetic view over facts and indicators and these key performance in-dicators are built from the entire organiza-tional data or even external data.
Also, the system have to provide a friendly graphical interface with advanced capabili-ties of slicing and dicing through data and easily get a new perspective over data by ro-tating dimensions and drill down or roll up over hierarchical levels. So we need a multi-dimensional model in which these operations can be made easily, in real time and that can it overhead the entire business model with re-lationship between dimensions, facts and hie-rarchies and it is based on the entire organi-zational data at operational level, tactical lev-el and strategically levlev-el.
Based on these considerations we propose an extension of the star or the constellation schema but with aggregate data and hierar-chies in fact tables not only in dimension
tables. The model is structured over three distinct levels and we can call it a pyramidal model with the following structure (for de-tailed description see the book [2]):
− Organizational level (or the base of the pyramid) – containing dimensions and facts with an organizational scope, at a general level, that shape and are common to the entire activities. Such dimensions can be: <time>, <zone>, <product>, <currency> and facts: production, pur-chasing etc. Data are at a detailed level with multiple hierarchies over each di-mension table.
− Departmental level – containing dimen-sions and facts for the departmental le-vels of the organization and particular ac-tivities in these departments or field of in-terests, group by data marts or data cen-ters. Such dimensions can be: <account>, <client>, <vendor> and facts: stocks, payments, sales etc. Data are at a detailed and aggregate level with specialized hie-rarchies over each dimension table.
− Strategically level – containing dimen-sions and facts derived from the base di-mensions and facts, with specific ele-ments for the strategic analysis, like <in-tercompany>, <plan>, <budget> and facts: cash-flow, KPIs. Data are at an ag-gregate, synthetic level with specialized hierarchies over each dimension table. The main characteristic of the model is that between the dimension tables and the facts from different levels of the architecture can be establish a relationship and also the fact tables can have hierarchies and class attributes that can be used for drill down or roll up.
Advantages of the model:
Flexibility – new elements or objects like new dimensions or facts can easily be in-cluded in the model without affecting the ex-isting architecture or remodeling the system and the loading process for a specific level can be made without refreshing the whole da-ta;
Real model of business requirements – the three level architecture is based on the real model of business requirements thus this
model can be mapped on the each level of the pyramid;
Performance in the drill-down or roll-up op-erations – because the dimensions and facts are separated at each level we can easily na-vigate through hierarchies from a level to another;
Incremental development – the model can be built in stages and each stage can be vali-dated and used before the next stage;
EIS, MIS and DSS support – the top level can be used to implement an Executive Informa-tion System (EIS), the bottom and middle le-vels can be used for design and realized a Management Information System (MIS) or a Decision Support System (DSS) because these systems can use the specific dimension and fact tables from these levels.
Disadvantages of the model:
High complexity – because it is containing three different levels, the business model need to be careful analyzed and designed in order to identify the proper and suitable di-mensions and facts and also the hierarchies at each level. An inadequate choice can have a major effect on the performance of the entire system;
Moderate performance of the interrogation process – in order to perform a complex query the model need to establish many rela-tionships and joins between the fact and di-mension tables and this can reduce the per-formance of interrogation;
Top-down and bottom-up development – In order to overhear the entire aspects of the business process we need to build the sys-tems in two directions: first top-bottom to model the strategic requirements and second, bottom-up for validating and setting up the hierarchical flux of data.
The pyramidal model is suited for business needs and can be developed and imple-mented through an object oriented approach, defining classes for dimensions and facts, following the rules of the OO design. The prototype will have the main functionalities of the business model and when there will be any change in this model and a new business requirement appear then new functions or new attributes can be added to the main
classes to complete the demands.
6 Criteria for Evaluating Business Intelli-gence Systems
A problem of BI systems is measuring suc-cess. There are some case studies evidencing benefits generated by organizations that are successful with the use of BIS like the one shown in [8] and [9], but with limited empir-ically validated measures. There have been several studies calling for the development of a measure for evaluating the business per-formance effects of BIS ([10], [11], [12]). In deploying a BIS there are many risks in-volved: system design, data quality, and technology obsolescence. System design risks stem from poor conceptualization of an enterprise’s true business needs before the technology is deployed. Data quality risks re-late primarily to whether or not data has been properly cleansed. Technology obsolescence refers to the failure on the part of the vendor to anticipate new technologies.
Large budgets and strategic information are involved in deploying BIS systems – this is the reason to establish rigorous criteria for evaluating such systems. These criteria are discussed below.
Decisions based on business process
BIS should not be viewed only as a data re-pository or a large set of data. Instead, sys-tem’s implementation should be concern on conceptualizing new data models, processes, and indicators that form the content of BIS; also it should provide extensive understand-ing of the benchmarks that are useful to eva-luate business processes.
Performance
This feature typically refers to the response time that a system provides to its users. Most responses should range from a few seconds to a maximum of 30 seconds for routine que-ries. Response times depend on the com-plexity of the database and the queries being requested.
Flexibility and scalability
Flexibility determines whether a BI solution can continually adapt to changing business conditions after the system has been deli-vered. BIS should be able to accommodate
changes in any type of business process and functions like personnel, services, and processes, as well as new mandates, laws, and regulations requiring the capture of dif-ferent types of data. BIS should be expanda-ble to accommodate data growth and changes to organizational structure. EIS also should allow contributed content to grow without a slowdown in performance.
Integration
Integration involves two types of issues: data integration and system integration.
Data integration is the ability to access data from much different type of systems, so BIS will be particularly effective if it can over-come the challenge of information fragmen-tation, allowing executives to measure fea-tures of business processes that involve in-formation from inside and outside of the or-ganization. System integration refers to two things: the ability to extent the BI software with new capabilities and modules and the system’s ability to coexist with other enter-prise solutions.
Friendly user interface
BIS should be designed to allow managers who are not trained to use query languages and advanced technologies, a fast, easy, and understandable way to navigate into data and identify trends and patterns. BIS should per-mit the user interface to accommodate differ-ent degrees of technical knowledge.
7 Conclusions
BI systems have a powerful impact on stra-tegic decisions quality to reduce the time for making decisions and thus these systems must have the ability to allow managers to view data in different perspective, to drill-down and roll-up to aggregate levels, to na-vigate and on-line query data sets in order to discover new factors that affect business process and also to anticipate and forecast changes inside and outside the organization. BIS improve the quality of management in organization through new type of technology and techniques for extracting, transforming, processing and presenting data in order to provide strategic information.
de-veloping a BIS is the system design that stem from poor conceptualization of an en-terprise’s true business needs before the sys-tems is deployed and for every change in these requirements the prototype must be al-so revised. A al-solution for covering this risk is object oriented modeling of a data ware-house that helps us to improve the designing phase and the development cycle and also we can re-use some parts of the prototype that it was implemented in an organization in order to design and implement another prototype in other organizational environ-ments. So, object types can store structured business data in its natural form in object tables and then allow applications, such as OLAP applications, to work in a multidi-mensional way using the object oriented properties and facilities.
Acknowledgement
This paper presents some results of the re-search project PN II, Ideas Program, Code 820: Informatics solutions for decision sup-port and for the development of knowledge management in public institutions, financed within the framework of IDEI research pro-gram.
This article is a result of the project Doctoral Program and PhD Students in the education research and innovation triangle. This project is co funded by European Social Fund through The Sectoral Operational Program for Human Resources Development 2007-2013, coordinated by The Bucharest Acade-my of Economic Studies.
References
[1] S. Luján-Mora and J. Trujillo, “Extend-ing UML for Multidimensional Model-ling,” Proceedings of the 5th Interna-tional Conference on the Unified Model-ling Language, Germany, 2002.
[2] I. Lungu and A. Bara, Executive Infor-mation Systems, ASE Printing House, Bucharest, 2007.
[3] L. Moss and S. Atre, Business Intelli-gence Roadmap – The complete project lifecycle for decision-support applica-tions, Addison-Wesley, 2004.
[4] A. R. Bologa, R. Bologa and A. Bara, “Technology vs Business Needs in Busi-ness Intelligence Projects,” Proceedings of the International Conference on e-Business (ICE-B 2008), 26-29 July, 2008, Porto, Portugal.
[5] V. Diaconita, I. Botha, A. Bâra, I. Lungu and M. Velicanu, “Two Integration Fla-vors in Public Institutions,” WSEAS Transactions on Information Science and Applications, May 2008.
[6] L. Y. Liang and R. Miranda, “Dash-boards and Scorecards: Executive Infor-mation Systems for the Public Sector,”
Government Finance Review, December 2001.
[7] M. Z. Elbashir, P. A. Collier and M. J. Davern, “Measuring the effects of busi-ness intelligence systems - The relation-ship between business process and orga-nizational performance,” International Journal of Accounting Information Sys-tems, pp. 135–153, 2008.
[8] J. Hesford and K. Antia, A process-oriented view of competitive intelligence and its impact on organizational perfor-mance, Working Paper. Richard Ivey School of Business, The University of Western Ontario, 2006.
[9] M. Edwards, “Best practices and leader-ship in data warehousing award winners 2002,” Bus Intell J, Vol. 7, No. 4, 2002. [10] A. Lönnqvist and V. Pirttimäki, “The
measurement of business intelligence,”
Information Systems Management, Vol. 23, No. 1, pp. 32–40, 2006.
[11] J. Marin and A. Poulter, “Dissemina-tion of competitive intelligence,” Journal of Information Science, Vol. 30, No. 2, pp. 165–80, 2004.
[12] L. Davison, “Measuring competitive in-telligence effectiveness: Insights from the advertising industry,” Competitive Intelligence Review, Vol. 12, No. 4, 2001, pp. 25–38.
[13] Y. C. Lu and H. Cheng, Automated op-timal equity portfolios discovery in a fi-nancial knowledge management system, computational intelligence in economics and finance, Springer-Verlag, 2003, pp.
387–402.
[14] Z. Wang, Business intelligence, DrMas-ter Culture Limited Company, 2005. [15] T. Davenport, “Competing on
Analyt-ics,” Harvard Business Review, 2005. [16] I. Lungu, M. Velicanu, A. Bara, V.
Di-aconita and I. Botha, “Portal based
sys-tem integration – foundation for decision support,” Economic Computation and Economic Cybernetics Studies and Re-search Journal, Vol. 43, No. 1, 2009, pp. 123-135.
Adela BÂRA is a Lecturer at the Economic Informatics Department at the Faculty of Cybernetics, Statistics and Economic Informatics from the Acad-emy of Economic Studies of Bucharest. She has graduated the Faculty of Economic Cybernetics in 2002, holds a PhD diploma in Economics from 2007. She is the author of 7 books in the domain of economic informatics, over 40 published scientific papers and articles (among which over 20 articles are indexed in international databases, ISI proceedings, SCOPUS and 2 of them are ISI indexed). She participated as team member in 3 research projects that have been financed from national research programs. She is a member of INFOREC professional associ-ation. From May 2009, she is the director of the Oracle Excellence Centre in the university, responsible for the implementation of the Oracle Academy Initiative program. Domains of competence: Database systems, Data warehouses, OLAP and Business Intelligence, Executive Information Systems, Decision Support Systems, Data Mining.
Iuliana BOTHA is an Assistant Lecturer at the Economic Informatics De-partment at the Faculty of Cybernetics, Statistics and Economic Informatics from the Academy of Economic Studies of Bucharest. She has graduated the Faculty of Cybernetics, Statistics and Economic Informatics in 2006 and the Databases for Business Support master program organized by the Academy of Economic Studies of Bucharest in 2008. Currently, she is a PhD student in the field of Economic Informatics at the Academy of Economic Studies. She is co-author of two books, 13 published scientific papers and articles (among which two pa-pers are ISI indexed and another 5 are included in international databases). She participated as team member in 3 research projects that have been financed from national research programs. From 2007, she is the scientific secretary of the master program Databases for Business Sup-port and she is also a member of INFOREC professional association. Her scientific fields of interest include: Database Systems, Design of Economic Information Systems, Grid Compu-ting, e-Learning Technologies.
Vlad DIACONIŢA is an Assistant Lecturer at the Economic Informatics Department at the Faculty of Cybernetics, Statistics and Economic Informat-ics from the Academy of Economic Studies of Bucharest. He has graduated the faculty at which he is now teaching in 2005 and studies for his PhD in the field of Cybernetics and Statistics. He is the co-author of 2 books in the do-main of economic informatics, 2 articles in ISI journals, 4 articles in Scopus journals, 4 articles in ISI proceedings, 4 papers in B+ journals and 6 papers in the proceedings of international conferences. He participated as team member in 3 research projects that have been financed from national research programs. He is a member of INFO-REC professional association. Domains of competence: Database systems, Data warehouses, OLAP and Business Intelligence, Integrated Systems, SOA.
Ion LUNGU is a Professor at the Economic Informatics Department at the Faculty of Cybernetics, Statistics and Economic Informatics from the Acad-emy of Economic Studies of Bucharest. He has graduated the Faculty of Eco-nomic Cybernetics in 1974, holds a PhD diploma in EcoEco-nomics from 1983 and, starting with 1999 is a PhD coordinator in the field of Economic Infor-matics. He is the author of 22 books in the domain of economic informatics, 57 published articles (among which 2 articles ISI indexed) and 39 scientific papers published in conferences proceedings (among which 5 papers ISI indexed and 15 in-cluded in international databases). He participated (as director or as team member) in more than 20 research projects that have been financed from national research programs. He is a CNCSIS expert evaluator and member of the scientific board for the ISI indexed journal Eco-nomic Computation and EcoEco-nomic Cybernetics Studies and Research. He is also a member of INFOREC professional association and honorific member of Economic Independence aca-demic association. In 2005 he founded the master program Databases for Business Support (classic and online), who’s manager he is. His fields of interest include: Databases, Design of Economic Information Systems, Database Management Systems, Decision Support Systems, Executive Information Systems.
Anda VELICANU has graduated the Faculty of Economic Cybernetics, Sta-tistics and Informatics of the Bucharest Academy of Economic Studies, in 2008. She is a PhD student in the field of Economic Informatics at the Acad-emy of Economic Studies and since January 2009, she is a Pre-Assistant Lecturer. She teaches Database, Database Management Systems and Eco-nomic Informatics seminars at the following faculties: EcoEco-nomic Cybernetics, Statistics and Informatics, Commerce, Marketing and International Business and Economics. Her research activity can be observed in the following achievements: 5 dip-lomas, 2 scientific awards, 3 proceedings, 2 articles published in scientific reviews, 1 research contract, 1 book and 1 research grant. She is a member of INFOREC professional association. Her scientific fields of interest include: Databases, Database Management Systems, Pro-gramming, Information Systems.
Manole VELICANU is a Professor at the Economic Informatics Department at the Faculty of Cybernetics, Statistics and Economic Informatics from the Academy of Economic Studies of Bucharest. He has graduated the Faculty of Economic Cybernetics in 1976, holds a PhD diploma in Economics from 1994 and starting with 2002 he is a PhD coordinator in the field of Economic Informatics. He is the author of 18 books in the domain of economic infor-matics, 64 published articles (among which 2 articles ISI indexed), 55 scien-tific papers published in conferences proceedings (among which 5 papers ISI indexed and 7 included in international databases) and 36 scientific papers presented at conferences, but un-published. He participated (as director or as team member) in more than 40 research projects that have been financed from national research programs. He is a member of INFOREC pro-fessional association, a CNCSIS expert evaluator and a MCT expert evaluator for the program
Cercetare de Excelenta - CEEX (from 2006). From 2005 he is co-manager of the master pro-gram Databases for Business Support. His fields of interest include: Databases, Design of Economic Information Systems, Database Management Systems, Artificial Intelligence, Pro-gramming languages.