Defending Against Distributed Denial-of-Service
Attacks With Max-Min Fair Server-Centric
Router Throttles
David K. Y. Yau
, Member, IEEE
, John C. S. Lui, Feng Liang, and Yeung Yam
Abstract—Our work targets a network architecture and accom-panying algorithms for countering distributed denial-of-service (DDoS) attacks directed at an Internet server. The basic mech-anism is for a server under stress to install a router throttle at selected upstream routers. The throttle can be the leaky-bucket rate at which a router can forward packets destined for the server. Hence, before aggressive packets can converge to overwhelm the server, participating routers proactively regulate the con-tributing packet rates to more moderate levels, thus forestalling an impending attack. In allocating the server capacity among the routers, we propose a notion of level- max-min fairness. We first present a control-theoretic model to evaluate algorithm convergence under a varitey of system parameters. In addition, we present packet network simulation results using a realistic global network topology, and various models of good user and at-tacker distributions and behavior. Using a generator model of web requests parameterized by empirical data, we also evaluate the impact of throttling in protecting user access to a web server. First, foraggressiveattackers, the throttle mechanism is highly effective in preferentially dropping attacker traffic over good user traffic. In particular, level- max-min fairness gives better good-user protection than recursive pushback of max-min fair rate limits proposed in the literature. Second, throttling can regulate the experienced server load to below its design limit – in the presence of user dynamics – so that the server can remain operational during a DDoS attack. Lastly, we present implementation results of our prototype on a Pentium III/866 MHz machine. The results show that router throttling has low deployment overhead in time and memory.
Index Terms—Congestion control, distributed denial of service, network security, router throttling.
Manuscript received December 27, 2002; revised March 22, 2003; approved by IEEE/ACM TRANSACTIONS ONNETWORKINGEditor V. Paxson. The work of D. K. Y. Yau was supported in part by the National Science Foundation under Grants CCR-9875742 (CAREER) and CNS-0305496, and in part by CERIAS. The work of J. C. S. Lui was supported in part by an RGC Earmarked Grant. The work of F. Liang was supported in part by CERIAS.
D. K. Y. Yau is with the Department of Computer Science, Purdue University, West Lafayette, IN 47907 USA (e-mail: yau@cs.purdue.edu).
J. C. S. Lui is with the Department of Computer Science and Engi-neering, Chinese University of Hong Kong, Shatin, NT, Hong Kong (e-mail: cslui@cse.cuhk.edu.hk).
F. Liang is with the Department of Telecommunications, Zhejiang University of Technology, Zhejiang, P. R. China.
Y. Yam is with the Department of Automation and Computer-aided Engi-neering, Chinese University of Hong Kong, Shatin, NT, Hong Kong (e-mail: yyam@acae.cuhk.edu.hk).
Digital Object Identifier 10.1109/TNET.2004.842221
I. INTRODUCTION
I
N A DISTRIBUTED denial-of-service (DDoS) attack (e.g., [2], [3]), a cohort of malicious or compromised hosts (the “zombies”) coordinate to send a large volume of aggregate traffic to a victim server. In such an episode, server resources are usually under much more stress than resources of the connecting network. There are two reasons. First, commercial servers are typically hosted by ISP’s at web centers quite close to the backbone network with high capacity pipes. Second, the server will generally see the full force of the attack traffic, which has gone through aggregation inside the network. Hence, the server system can become totally incapacitated under extreme overload conditions.We view DDoS attacks as a resource management problem. Our goal in this paper is to protect a server system from having to deal with excessive service request arrivals over a global network. (It is possible to generalize the approach to protecting an intermediate routing point under overload. However, im-plementation issues of having routers initiate control requests will then have to be addressed, which are not considered in the current paper.) To do so, we adopt aproactiveapproach: Before aggressive packets can converge to overwhelm a server, we ask routers along forwarding paths to regulate the contributing packet rates to more moderate levels, thus forestalling an im-pending attack. The basic mechanism is for a server under stress, say , to install arouter throttleat an upstream router several hops away. The throttle limits the rate at which packets destined for will be forwarded by the router. Traffic that exceeds the rate limit can either be dropped or rerouted to an alternate server, although we will focus exclusively on the dropping solution in this paper.
A key element in the proposed defense system is to install appropriate throttling rates at the distributed routing points, such that, globally, exports its full service capacity to the network, but no more. The “appropriate” throttles should depend on the current demand distributions, and so must be negotiated dynamically between server and network. Our negotiation approach is server-initiated. A server operating below the designed load limit needs no protection, and need not install any router throttles. As server load increases and crosses the designed load limit , however, the server may start to protect itself by installing and activating a rate throttle at a subset of its upstream routers. After that, if the current throttle fails to bring down the load at to below , then the
throttle rate is reduced.1 On the other hand, if the server load falls below a low-water mark (where ), then the throttle rate is increased (i.e., relaxed). If an increase does not cause the load to significantly increase over some observation period, then the throttle is removed. The goal of the control algorithm is to keep the server load within whenever a throttle is in effect.
Router throttling has been implemented on the CROSS/Linux software router running on a Pentium III/864 MHz machine. Our implementation results indicate that (i) since throttling re-quires only looking up the IP destination address of a packet, it has essentially the same processing complexity as standard IP forwarding, and adds little computational overhead at a deploy-ment router, and (ii) the amount of state information a router has to keep per throttle is a few bytes, for storing the destination IP address and the throttle value. Although throttling is space-effi-cient, thetotalamount of state information needed at a router is nevertheless linear in the number of installed throttles. Hence, it may not be possible for the routers to maintain state about everyInternet server. However, the approach can be feasible as an on-demand and selective protection mechanism. The premise is that DDoS attacks are the exception rather than the norm. At any given time, we expect at most only a minor portion of the network to be under attack, while the majority remaining por-tion to be operating in “good health”. Moreover, rogue attackers usually target “premium sites” with heavy customer utilization, presumably to cause maximal user disruptions and to generate the most publicity. These selected sites may then elect to protect themselves in the proposed architecture, possibly by paying for the offered services.
A. Our Contributions
Our contributions in this paper are:
• We contribute to the fundamental understanding of router throttling as a mechanism against DDoS attacks. In par-ticular, we advance a control-theoretic model useful for understanding system behavior under a variety of param-eters and operating conditions.
• We present an adaptive throttle algorithm that can ef-fectively protect a server from resource overload, and increase the ability of good user traffic to arrive at the intended server.
• We show how max-min fairness can be achieved across a potentially large number of flows, and the implication of a notion oflevel- max-min fairnesson DDoS attacks. • We study how throttling may impact real application
per-formance. Specifically, we demonstrate via simulations the performance impact on an HTTP web server. • We present system implementation results to quantify the
deployment overhead of router throttling. B. Paper Organization
The rest of this paper is organized as follows. In Sec-tion II, we discuss the practical challenges of deploying router throttling in the Internet. Our system model is introduced in 1Notice that reducing the throttle rate means increasing the extent of throttling, because a router will restrict more traffic destined for S.
Section III. In Section IV, we formally specify a baseline and a fair algorithm for computing throttle rates. In Section V, we present a control-theoretic mathematical model for under-standing system performance under a variety of parameters and operating conditions. To further examine system performance under detailed packet network models, Section VI presents di-verse ns2 simulation results using a realistic network topology. Implementation of router throttling on the CROSS/Linux soft-ware-programmable router, as well as its experimental evalu-ation, is presented in Section VII. Section VIII compares our solution approach with related work in the literature. Section IX concludes.
II. DEPLOYMENTISSUES
The objective of our work is to explore some fundamental is-sues in mitigating DDoS attacks based on controlling aggressive network attackers. We focus on the dynamic resource control problem of giving good users productive access to a server’s re-sources in spite of excessive demands from the attackers. We do not claim to present a complete DDoS solution in the present work. In particular, while our results are promising, several de-ployment issues will have to be resolved to bring the solution approach to bear in practice. These issues, discussed below, are challenging and beyond the scope of this work.
First, our trust model is that routers in the defense network trust each other, but they do not necessarily trust the network users. In particular, these users may spoof packets, disobey congestion signals, initiate bogus network requests, etc. As we push the “defense perimeter” further away from the server to be protected, requests to install router throttles are more likely to cross multiple administrative domains. Establishing trust relationships between the different domains, such that requests originating from one domain will also be honored in the other domains, is challenging and not addressed in the present work. Second, our approach is most useful under the assumption that attackers are significantly more aggressive than regular users. If the assumption is not true, good user traffic can be penalized to a comparable extent as attacker traffic. Our solution is then mainly useful in ensuring that a server under attack can remain functional within the engineered load limits. However, it does require more effort on the part of a malicious entity to assemble a large number of attack machines each behaving as a regular machine.
Third, since attackers can be highly unpredictable, it is in-herently difficult to exhaustively model attacker behavior using only simulation experiments. In view of the problem, we have developed an analytical model that allows us to more basically and systematically study the behavior of our control strategy. Our model brings forth several control parameters that will af-fect system performance of stability and convergence speed. Currently, these parameters must be chosen based on estimates of the operating conditions and user policies to balance system stability versus responsiveness. Adaptively and automatically learning the best control parameters in a general setting is in-teresting and requires further research.
Fourth, we assume that a protected server will send throttle re-quests to deployment routers by multicast because it is the most
natural communication paradigm for our purpose. In practice, we do not need full IP multicast support between routers. For example, using topology information known to routers in an ISP, routers can simply forward a throttle request to upstream routers after incrementing a request hop count by one. Then routers in-stall the throttle when the hop count parameter indicates that they are in the deployment set. In this paper, we do not address the full implementation details of such multicast support.
Fifth, our study assumes that router throttling is supported in a specified set of deployment routers. This simplifies the analysis and experiments. If the assumption is not true, then we must be able to identify at least one alternative supporting router on each network path that sees substantial network traffic. This will then add the overhead of control message exchanges between routers to identify supporting routers. Lastly, priority transmission tech-niques should be investigated to ensure the reliable and timely delivery of throttle messages from source to destination.
III. SYSTEMMODEL
We begin by stating Convention 1 that simplifies our presenta-tion throughout the rest of the paper. Then, we go on to describe our system model.
Convention 1: All traffic rate and server load quantities stated in this paper are in units of kb/s, unless otherwise stated. We model a network as a connected graph , where is the set of nodes and is the set of edges. All leaf nodes are hosts and thus can be a traffic source. Hosts are not trusted. In particular, they may spoof traffic, disobey congestion signals, initiate bogus network requests, etc. An internal node is a router; a router cannot generate traffic, but can forward traffic received from its connected hosts or peer routers. We denote by the set of internal routing nodes. All routers are assumed to be trusted. The set of hosts, , is partitioned into the set of ordi-nary “good” users, , and the set of attackers . models the network links, which are assumed to be bi-directional. Since our goal is to investigate control againstserverresource overload, each link is assumed to have infinite bandwidth. The assump-tion can be relaxed if the control algorithm is also deployed to protect routers from overload.
In our control architecture, routers do not exchange control information between each other beyond passing on throttle requests (unlike, for example, traditional routing). This greatly simplifies the runtime overhead of our solution. Rather, the target server makes all control decisions and then instructs the deployment routers to implement the decisions accordingly.
In our study, we designate a leaf node in as the target server . A good user sends packets to at some rate chosen from the range . An attacker sends packets to at some rate chosen from the range . In principle, while can usually be set to a reasonable level according to how users normally access the service at (and we assume ), it is hard to prescribe constraints on the choice of . In this work, we target in partic-ular the kind of attack in which is significantly higher than (although we will also examine system performance when such a condition is not true). This is because if every attacker sends at a rate comparable to a good user, then an attacker must recruit or compromise a large number of hosts to launch an attack with sufficient traffic volume.
Fig. 1. Network topology illustrating R(3) deployment points of router throttle, and offered traffic rates.
When is under attack, it initiates the throttle defense mech-anism outlined in Section I. The throttle does not have to be de-ployed at every router in the network. Instead, the deployment points are parameterized by a positive integer and are given by . Specifically, contains all the routers that are either hops away from or less than hops away from but are directly connected to a host.
Fig. 1 shows an example network topology. In the figure, a square node represents a host, while a round node represents a router. The host on the far left is the target server . The routers in are shaded in the figure. Notice that the bottom-most router in is only two hops away from , but is included because it is directly connected to a host.
Given our system model, an important research problem is how to achievefairrate allocation of the server capacity among the routers in . To that end, we define the following notion oflevel- max-min fairness:
Definition 1 (Level- Max-Min Fairness): A resource con-trol algorithm achieveslevel- max-min fairness among the routers , if the allowed forwarding rate of traffic for at each router is the router’s max-min fair share of some rate
satisfying .
IV. THROTTLEALGORITHMS A. Baseline Algorithm
We first present a baseline algorithm in which each router throttles traffic for by forwarding only a fraction (
) of the traffic. The fraction is taken to be one when no throttle for is in effect. In adjusting according to current server congestion, the algorithm mimics TCP congestion con-trol. Specifically, is reduced by a multiplicative factor when is congested and sends the router arate reduction signal. It is increased by an additive constant – subject to the condition that – when has extra capacity and sends the router a rate increase signal.
The baseline algorithm that runs is specified in Fig. 2. It is to be invoked when either (i) the current server load (measured as traffic arrival rate to ) crosses , or (ii) a throttle is in effect
Fig. 2. Baseline throttle algorithm specification.
TABLE I
TRACE OF THETHROTTLEFRACTIONf ANDSERVER
LOAD FOR THEBASELINEALGORITHM
and the current server load drops below . In case (i), mul-ticasts a rate reduction signal to ; in case (ii), it multicasts a rate increase signal. The algorithm can take multiple rounds until a server load within is achieved. Also, if the server load is below , and the next rate increase signal raises the server load by an insignificant amount (i.e., by less than ), we remove the throttle. The monitoring window should be set to be somewhat larger than the maximum round trip time between
and a router in .
In the example network shown in Fig. 1, let the number above each host (except ) denote the current rate at which the host sends traffic to . The number above each router denotes the offered rate of traffic at the router, destined for . Also, let
, , , and . Initially, the total
offered load to exceeds , and hence the baseline throttle algorithm is invoked at . A rate reduction signal causes each router to drop half of the traffic for , resulting in a server load of 29.95, still higher than . The next rate reduction signal causes the server load to drop below , at 14.975 and a rate increase signal to be sent, raising the server load to 17.97. Finally, another rate increase signal raises the server to 20.965, which is within
.
Table I shows how and the server load change at each round of the algorithm. When the algorithm terminates, the forwarding rates at the deployment routers (from top to bottom of the figure) are 8.708, 0.077, 5.4285, 6.2055, 0.2135 and 0.3325, respec-tively. The algorithm achieves a server load within the target range of [18, 22]. However, it doesnotachieve level- max-min fairness, since some router is given a higher rate than another router, even though the latter has unmet demands.
Fig. 3. Fair throttle algorithm specification. TABLE II
TRACE OFTHROTTLERATE ANDACHIEVEDSERVER
LOAD FOR THEFAIRALGORITHM
B. Fair Throttle Algorithm
The baseline algorithm is not fair because it penalizes all routers equally, irrespective of whether they are greedy or well behaving. We now present a fair throttle algorithm that installs at each router in , auniformleaky bucket rate (i.e., the throttle rate) at which the router can forward traffic for . Fig. 3 speci-fies the algorithm by which determines the throttle rate to be installed. In the specification, is the current throttle rate to be used by . It is initialized to , where is either some small constant, say 2, or an estimate of the number of throttle points typically needed in . We use a constant additive step, , to ramp up if a throttle is in effect and the current server load is below .
The fair throttle algorithm is to be invoked as with the baseline algorithm. Each time it is called, it multicasts a rate- throttle to . This will cause a router in to regulate traffic des-tined for to a leaky bucket with rate . The algorithm may then continue in the while loop that iteratively adjusts to an appropriate value. Notice that the additive increase/multiplica-tive decrease iteraincrease/multiplica-tive process aims to keep the server load in whenever a throttle is in effect. The termination con-ditions and choice of in the fair algorithm are the same as in the baseline algorithm.
We apply the fair throttle algorithm to the previous example scenario in Fig. 1. We initialize to , and use an additive step of one. Table II shows how and the ag-gregate server load evolve. When the algorithm is first invoked with throttle rate 10, the aggregate load at drops to 31.78. Since the server load still exceeds , the throttle rate is halved to 5, and the server load drops below , to 16.78. As a result, the throttle rate is increased to 6, and the server load becomes 19.78. Since 19.78 is within the target range [18, 22], the throttle
Fig. 4. High-level description of mathematical model for router throttling.
algorithm terminates. When that happens, the forwarding rates of traffic for at the deployment routers (from top to bottom in the figure) are 6, 0.22, 6, 6, 0.61, and 0.95, respectively. This is the max-min fair allocation of a rate of 19.78 among the deploy-ment routers, showing that level- max-min fairness is achieved (in the sense of Definition 1).
V. GENERALMATHEMATICALMODEL
Router throttling is a feedback control strategy. To better understand its stability and convergence behavior, we formulate its control-theoretic model. Using the model, we explore how different system parameters, including feedback delays, the hysteresis control limits , and the number and het-erogeneity of traffic sources, can impact system performance. We point out that our mathematical model can also provide a general framework for studying various multi-source flow control problems.
Fig. 4 gives a high-level description of our mathematical model for router throttling. We model each deployment router as a source of traffic for , where is the server to be protected. Let there be sources and be the instantaneousoffered traffic rate from router has for at time . Given a throttle algorithm and athrottle signal from , router forward traffic for at an instantaneous rate . The instantaneous forwardingrate is a function of the offered traffic rate, , and a throttle rate computed by arate adjustment moduledeployed at router , according to the throttle algorithm used.
Given from each deployment router in , receives an aggregate traffic rate of . Based on the aggregate rate, computes and sends the throttle signal to all the routers in . Notice that the throttle signal may arrive at different routers at different times. We model heterogeneous delaysfrom to different routers in . Specifically, we let denote the network delay from to router . We use a set of coupled differential equations to model the dynamics
of how the throttle signal , the throttle rate , and the forwarding traffic rates , for , change over time.
In general, the server generates a throttle signal as a function of the aggregate traffic workload and the hysteresis control limits . The throttle signal generation is:
if if
otherwise.
(1)
In other words, a throttle signal of indicates that the ag-gregate received traffic rate at is above and a signal of 1 indicates that the aggregate received traffic rate is below . Note that when the aggregate traffic rate is within , the throttle signal will be off (i.e., ).
A. Mathematical Model for the Fair Throttle Algorithm Let us consider the fair throttle algorithm. (Because of space constraint, we do not present the analysis of the baseline algo-rithm in this paper. The interested reader is referred to our tech-nical report [11].) In this case, the server generates a throttle signal as the throttle rate , which is a function of the aggregate server workload, the hysteresis control limits and , and the additive step size . The differential equation expressing the change in the throttle rate is
Essentially, when the server discovers that the aggregate traffic is below , it will increase the throttle rate by . Otherwise, if the aggregate traffic is above , it will reduce the throttle rate by half. The objective is to achieve an aggregate server load within .
Upon receiving the throttle rate , router adjusts its forwarding traffic rate, , to . The differential equation expressing the change in is
for and . Note that the rate of change of the forwarding traffic rate is a function of the throttle rate and the offered traffic rate . If the throttle rate is larger than the offered traffic rate, then there is no need to throttle and the change is simply . On the other hand, if is smaller than , then we throttle and the change in the forwarding traffic rate is . Theorem 1: Assume that the server is overloaded (i.e., the aggregate received traffic rate is above ) at time , the throttle rate by server is
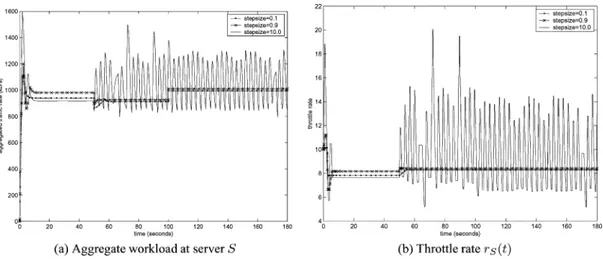
Fig. 5. System performance forU = 1100,L = 900, and variousstep sizes.
where is a constant equal to and is the
initial value of the throttle rate at time . The forwarding traffic rate at router can be closely approximated by
(3) Proof: Please refer to [11].
Theorem 2: Assume that the server is underloaded (i.e., the aggregate received traffic rate is below ) at time , the throttle rate by server is
(4) where is a constant equal to . The forwarding traffic rate at router can be closely approximated by
(5)
Proof: Please refer to [11].
B. Mathematical Analysis
We now study the stability and convergence properties of router throttling. Since the basline algorithm cannot attain the max-min fairness property, we only present results for the fair throttle algorithm. In our presentation, all time units are in sec-onds, except otherwise stated. In the experiments, we consider 100heterogeneoussources. The first eighty are constant sources
wherein for . In each experiment, ten
of these constant sources are switched off at and are activated again at . The network delay between and each of the constant sources is 100 ms. The next ten sources
are sinusoidal sources wherein for
. The network delay for each of these sinusoidal sources is 50 ms. The last ten sources are square-pulse sources wherein
for for
for and . The network delay
for each of these square-pulse sources is 50 ms.
Experiment 1: Handling of heterogeneous sources and system stability.Fig. 5 illustrates the results for the first
exper-iment where and . We consider three
different step sizes, namely . We make two important observations about the results: 1) The proposed fair algorithm is effective in keeping the server load within the target limits, underheterogeneous sourcesandheterogeneous network delays, and 2) the additive step size can affect system stability. As shown, system performance is not stable for the large step size of . Hence, a small step size relative to is needed for the system to operate in a stable region. Experiment 2: Determination of step size for a stable system.Fig. 6 illustrates the results of our second experiment
where and can be 900 or 1050. We observe
that when is large, the system is stable with , and the achieved server workload at convergence is slightly above 1000. On the other hand, when advertises a smaller
target load region, with and , we need
a smaller step size (e.g, ) to have stable performance, and the achieved server workload at convergence is closer to . After experimenting with a large number of different step sizes and many different system configurations, we recommend a small step size of (e.g., ) for system stability.
Experiment 3: Effect of on the convergence rate. Fig. 7 illustrates the results of our third experiment in which we consider how can affect the convergence speed. In the
experiment, and . We experiment
with three different step sizes, namely , 0.1, 0.05. Although the system is stable for all the three step sizes, we observe that if a step size is too small, it takeslongerfor the system to converge. For example, when ten constant sources are activated at , the system converges around
Fig. 6. System performance forU = 1100andL = 900or 1050, and variousstep sizes.
Fig. 7. System performance forU = 1100andL = 1050, and variousstep sizes.
converges around . Another important point is that if is smaller, the achieved server workload at convergence is also smaller. Therefore, in order to have a stable system and, at the same time, achieve a high server workload, we recommend to be between 0.1 and 0.3.
VI. PACKETNETWORKSIMULATIONRESULTS
Our general, high-level control-theoretic results provide basic understanding about algorithm stability and convergence. To further examine system performance, under detailed packet net-work models (including both unreliable UDP and reliable TCP communication), we conduct experiments using the ns2 simu-lator. We present results only for the fair throttle algorithm. A. Performance Metrics
One basic performance measure is how well router throt-tles installed by can floor attackers in their attempt to deny good users of the ability to obtain service from . It is clear that the defense mechanism cannot completely neutralize the effects of malicious traffic – in part because attackers are them-selves entitled to a share of in our model. Hence, good users must see a degraded level of performance, but hopefully are
much less prone toaggressive attack flows than without net-work protection.
Apart from the basic performance measure, it is necessary to evaluate the deployment costs of the proposed defense mecha-nism. Therefore, the following are important evaluation criteria that we adopt:
• The percentage of good user traffic that makes it to the server. Since the control algorithm ensures that the server operates under its maximum designed load, the good user requests that arrive should be adequately served.
• The number of routers involved in protecting . Because throttling clips forwarding rate to some preset ceiling, it is less tolerant to traffic variabilities than best-effort trans-missions. For example, normal traffic that occasionally exceeds the ceiling and cannot be absorbed by the token bucket will get clipped, instead of being served by op-portunistic resource availabilites. We measure the number of routers at which traffic is actually dropped due to the throttle rate limit.
B. Packet Network Results
To evaluate how the proposed throttle mechanism would perform over a real network, we conducted simulations using a global network topology reconstructed from real traceroute
data. The traceroute data set is obtained from the Internet map-ping project at AT&T2. It contains 709 310 distinct traceroute paths from a single source to 103 402 different destinations widely distributed over the entire Internet. We use the single source as our target server , and randomly select 5000 tracer-oute paths from the original data set for use in our simulations. The resulting graph has a total of 135 821 nodes, of which 3879 are hosts. We assume, therefore, that out of all the hosts in the total global network, these 3879 hosts access , either as an attacker or a good user.
1) Evenly Distributed Aggressive Attackers: In our first set of experiments, we modelaggressiveattackers, whose average individual sending rate is several times higher than that of normal users. Specifically, each good user is chosen to send fixed size UDP packets to , where the packet interarrival times are Poisson and the average traffic rate is randomly and uniformly drawn from the range [0, 2]. Each attacker is chosen to send traffic at a rate randomly and uniformly drawn from the range , where is either 10 or 20 according to the particular experiment. Furthermore, we select attackers and good users to be evenly distributed in the network topolgy: each host in the network is independently chosen to be an attacker with probability , and a good user with probability .
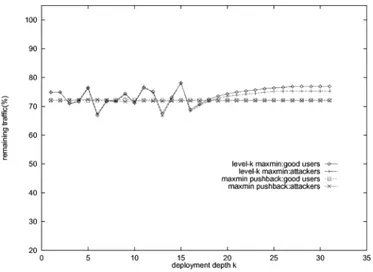
Fig. 8(a) compares the performance of our algorithm (labeled “level- max-min fairness”) with that of the pushback max-min fairness approach in [13], for and . We show the percentage of remaining good user and attacker traffic that passes the router throttles and arrives at the server. Fig. 8(b) and (c) show the corresponding results when and , and and , respectively. We plot the average results over ten independent experimental runs, and show the standard deviation as an error bar around the average.
Notice from the figures that generally, level- max-min fairness gives significantly better protection for good user traffic than pushback max-min fairness. The performance advantage of level- max-min fairness increases as increases, until it levels off at roughly equal to 20. This is because good traffic can aggregate to a significant level near (the increase rate can be exponential), making it hard to distinguish from the attacker traffic at that location. Since pushback always originates control at in our experimental setup (pushback is designed to originate at the point under attack, which can be a congested router in general), it can severely punish good traffic. By initiating control further away from (specifically, about hops away), level- max-min fairness achieves better good user protection.
2) Unevenly Distributed Aggressive Attackers: In this set of experiments, each good user traffic rate is chosen randomly and uniformly from the range [0, 2], while each attacker rate is sim-ilarly chosen from the range [0, 20]. In each experiment, about 20% of the hosts are chosen to be attackers, and the remaining hosts to be good users.
In these experiments, we select the attackers to have different concentrationproperties. Specifically, we pick five disjoint sub-trees from the network topology, labeled in Fig. 9 as 1–5. The five subtrees have properties as shown in Table III. We then de-fine four concentration configurations, 0–3, for the attackers, as
2http://cm.bell-labs.com/who/ches/map/dbs/index.html
Fig. 8. (a) Protection for good users under 20% evenly distributed aggressive attackers: mean attacker rate 10 times mean good user rate. (b) Protection for good users under 40% evenly distributed aggressive attackers: mean attacker rate 10 times mean good user rate. (c) Protection for good users under 40% evenly distributed moderately aggressive attackers: mean attacker rate 5 times mean good user rate.
shown in Table IV. The intention is for attacker concentration to increase as we go from configurations 0 to 3. (Notice that the roots of subtrees 4 and 5 in configuration 3 share a common parent, and so attacker traffic converges more quickly than the subtrees 1 and 3 in configuration 2.)
Fig. 9. Subtrees 1–5 used in attacker concentration experiments.
TABLE III PROPERTIES OFSUBTREES1–5
TABLE IV
CONFIGUREDCONCENTRATIONS OFATTACKERS
Fig. 10(a) shows the percentage of remaining good traffic for the four concentrations, using level- max-min fairness. Fig. 10(b) shows the corresponding results for pushback max-min fairness. Notice that as increases, level- max-min fairness achieves good protection for the good users in all four configurations. For configurations 1–3, however, notice a “dip” in the achieved protection over values between about 6 to 11. For example, the percentage of remaining good traffic for configuration 3 decreases from to , and rises again afterwards.
To explain the dip, consider the case when all attackers are contained inonesubgraph, say , whose root is hops away from . For the traffic seen at , as decreasesfrom to 1, there will be more and more aggregation of good user trafficbut no further aggregation of attack traffic. This will cause a larger fraction of good user traffic to be dropped (its volume is more comparable to attack traffic) as throttling is performed with a smaller , for . This explains the initial rising curves in Fig. 10(a) before the dip. For a few hops larger than , the aggregation situation for both good user and attack traffic is similar to the case of evenly distributed attackers. Hence, we observe increased protection for good user traffic as increases from onwards, where is a small constant. This explains the rising curves shortly after the dip. At the point when just increases past the root of , however, there is progressively less aggregation of attack traffic. This may cause reduced dropping rate for the attack traffic (since its volume at the control points is smaller and more comparable to good user traffic), when com-pared with control after full attack traffic aggregation has oc-curred at the root of . This explains the dip itself.
Fig. 10. (a) Protection for good users, under four different attacker concentrations, using level-k max-min fairness. (b) Protection for good users, under four different attacker concentrations, using pushback max-min fairness. (c) Comparions of good-user protection between level-kand pushback max-min fairness – for configurations 0 and 3 only.
Despite the above “anomaly”, level- max-min fairness con-sistently and signifcantly outperforms pushback max-min fair-ness for . The performance advantage decreases from 0–3, because pushback max-min fairness becomes more effec-tive as attackers get more concentrated. Fig. 10(c) more clearly compares the two approaches by plotting their results together, for configurations 0 and 3.
3) Evenly Distributed “Meek” Attackers: Router throttling is most effective when attackers are significantly more aggres-sive than good users. However, should a malicious entity be able to recruit or compromisemanyhosts to launch an attack, then each of these hosts behaving like a normal user can still together bring about denial of service. It is inherently more difficult to defend against such “meek” attackers. Our experimental results (Fig. 11; see also [11]) show that both level- and max-min fairness may fail to distinguish between the good users and at-tackers, and punish both classes of hosts equally. When this hap-pens, throttling is mainly useful in regulating the server load to within its operational limits.
4) Deployment Extent: The previous two sets of experi-ments suggest that, for aggressive attackers, the effectiveness of level- max-min fairness increases with . At the same time, however, the cost of deployment may also increase, as the number of routers in becomes larger.
Fig. 12 plots the percentage of routers involved in throttling as a function of , for both level- and pushback max-min fairness. (For the level- approach, we count both monitoring and throt-tling routers.) Notice that the two approaches basically require a comparable number of deployment points, although for equal to 4–9, pushback max-min fairness is somewhat more efficient, and for larger , level- max-min fairness is somewhat more ef-ficient. Also, the percentage of deployment points levels off as rises above 20 for both approaches. This is because as in-creases, a throttling node will likely see a progressively smaller rate of traffic destined for . If the rate is small enough, both algorithms avoid the actual use of a throttle.
5) Web Server Performance: To evaluate the impact of throt-tling on real user applications, we simulate the performance of a web server under DDoS attack. The simulations are per-formed using ns2, and clients access the web server via HTTP 1.0 over TCP Reno/IP. (TCP is interesting because the achieved throughput by a client also depends on the rate at which acks are returned from the server to the client.) The simulated network is a subset of the AT&T traceroute topology described above. It consists of 85 hosts, of which 20% (i.e., 17 out of 85) are chosen as attackers. The maximum and average numbers of hops be-tween a client and the server is 30 and 15, respectively.
Attackers generate UDP traffic destined for the server, at a constant rate of 6000 bits/s. Web clients make requests for documents to the server, where the document sizes and times between requests are probabilistically generated according to collected empirical distributions.3 If a request arrives at the server successfully, the server will return the requested document after a random processing time, also chosen according to collected empirical distributions.
We model the web server to have and
. We report two experiments with and , respectively. To compare web server performance with and without throttling, we plot the rates of client requests that are successfully processedby the server in both cases, over time. The aggregate rate at which the clients originally make requests is also shown for baseline comparison. Each experiment runs 3Please see http://http.cs.berkeley.edu/ tomh/wwwtraffic.html for further details.
Fig. 11. Protection for good user traffic under evenly-distributed “meek” attackers, for both level-kand pushback max-min fairness.
Fig. 12. Number of participating routers for level-kand pushback max-min fairness, as a function of the deployment depth.
for 100 seconds of simulated time, and an attack starts at time 10 seconds.
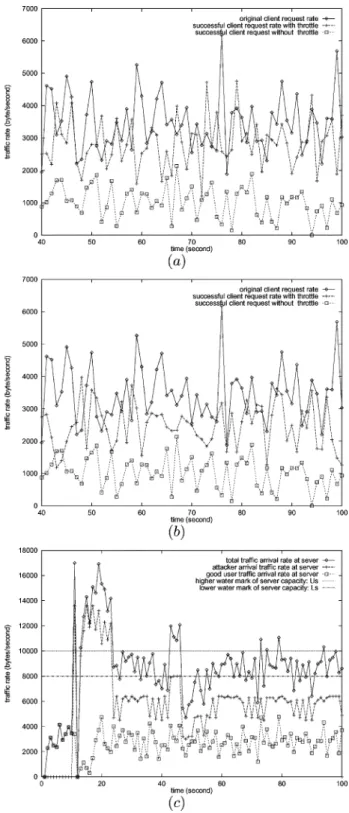
Fig. 13(a) shows the results for . Notice that with throt-tling, the rate of client requests that are successfully processed ismuch closer to the original client request rate, than without throttling (the averages are 3.8, 2.5 and 0.9 kbytes/s, respec-tively). Fig. 13(b) shows the corresponding results for , and supports the same conclusions. Fig. 13(c) shows the web client, attacker, and total traffic arrival rate at the server, for . Notice that our throttle negotiation algorithm is effec-tive in keeping the actual server load between and .
VII. SYSTEMIMPLEMENTATION
We have an implementation of router throttling on the CROSS/Linux software-programmable router [9]. CROSS/Linux allows a pipeline of processing elements to be flexibly configured for flows of network packets. Each element is implemented in C++ as a Linux loadable kernel module, and can be loaded and dynamically linked into a run-ning kernel. An element initially not present at a router can also
Fig. 13. (a) Plot of (i) original client request rate, (ii) rate of successfully processed client requests with level-10 router throttling, and (iii) rate of successfully processed client requests without throttling, over time. (b) Plot of (i) original client request rate, (ii) rate of successfully processed client requests with level-9 router throttling, and (iii) rate of successfully processed client requests without throttling, over time. (c) Plot of total, attacker, and web client traffic arrival rates at server, over time, for level-10 throttling.
be fetched on demand from a remote code repository, through a modified version of the anetd daemon from DARPA’s active network project.
In our implementation, a server, say , requests throttling at a CROSS/Linux router by sending it an IP control packet with the router alertoption being set. The control packet specifies
the IP address of , and the throttle leaky bucket size and token rate. On receiving such a packet, CROSS/Linux checks if the throttle element is already available at the local node. If not, it uses anetd to fetch the throttle code from a designated code server, and links the code dynamically into the kernel, without disrupting existing services. When the throttle element has been linked to the kernel, it is configured into the processing pipeline of packets destined for – just before the IP forwarding path’s send onto the outgoing network interface. The element limits the long-term forwarding rate of packets for to the token rate, and the maximum burst size to the leaky bucket size. Any excess packets are dropped in the implementation.
A. Experimental Results
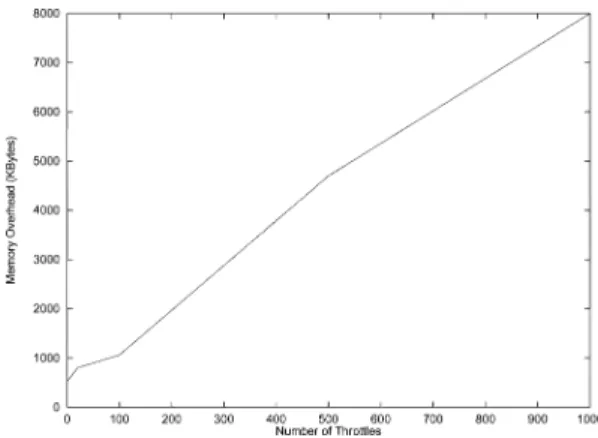
To measure the memory overhead of router throttle, we first load the CROSS/Linux router and the throttle modules into the kernel. Then, using the /proc file system, we note the amount of memory allocated as 540 kbytes. We then install up to 1000 throttles one by one, observing the increase in memory allocated after each throttle installed. Fig. 14 plots the average memory allocated, as a function of the number of throttles installed, over several experiments. The results show that the memory allocated increases largely linearly with the number of throttles, with an average per-throttle memory of about 7.5 bytes.
We break down the delay of throttling into two components: throttle lookup in the packet classifier, and the delay due to the throttle element itself. We found that the delay through the throttle element is about 200 ns, independent of the number of throttles installed. This small and relatively constant delay shows that throttling is not inherently expensive. Throttle lookup depends heavily on the performance of the packet classifier. We currently use a “naive” implementation that does a linear search through all the installed filters. From Fig. 15, notice that the “base” classifier delay (i.e., without any created flows) is about 150 ns. Following that, the delay increases about linearly with the number of throttles installed, reaching about 475 ns for 18 throttles. Notice, however, that throttle lookup on IP destination addresses is not more complicated than IP forwarding table lookup. Hence, leveraging related results in scalable IP lookup (e.g., [19]) will much improve upon the linear increase in delay.
To ascertain how the throttle overhead affects throughput, we measure the maximum achievable forwarding rates of packets through CROSS/Linux, with no throttled flow, to up to 18 flows created for throttling. Fig. 16 shows the average number of 64-byte packets we can forward per second, as a function of the number of throttled flows.
VIII. RELATEDWORK
Probabilistic IP marking is advanced by Savageet al.[16] to identify attackers originating a denial-of-service attack, in spite of source address spoofing. The analysis in [15] confirms the remark in [16] that their form of IP traceback may not be highly effective fordistributedDoS attacks. Subsequently, Song and Perrig [17] improve upon the information convergence rate that allows to reconstruct the attack graph (by eliminating false positives when markers can be fragmented across packets), and
Fig. 14. Router throttle memory overhead, as a function of the number of throttles installed.
Fig. 15. Delay performance of router throttling, as a function of the number of throttles installed.
Fig. 16. Throughput performance of router throttling, as a function of the number of throttles installed.
reduces the time overhead in the reconstruction process itself, for DDoS attacks. These algorithms expose the true attackers, which supposedly facilitates defense actions that can then be taken to curtail an attack. However, the required defense mech-anisms are external to IP trackeback, which in and of itself offers no activeprotectionfor a victim server.
To actively defend against attacks, analysis of routing infor-mation can enable a router to drop certain packets with spoofed source address, when such a packet arrives from an upstream router inconsistent with the routing information. The approach requires sophisticated and potentially expensive routing table
analysis on a per-packet basis. Also, it is not necessary for attackers to spoof addresses in order to launch an attack. The latter observation also limits the effectiveness of ingress filtering approaches [6].
Another approach, adopted by carriers such as AT&T, em-ploys a monitoring infrastructure to detect attacker traffic. Once a network region is determined to be an originator of active attacks, traffic from the region isblackholed[1] and thus elim-inated from the network. Their approach makes it a binary decision whether a region is an originator of attack traffic or not. In our problem, setting the aggressiveness threshold for the decision is not easy. Our approach assumes that aggres-siveness is a matter of degrees, and hence looks at the more fine-grained control problem that regions may have a fraction of the traffic dropped according to howlikely it is an attack region.
A defense approach most similar to ours is proposed by Mahajan et al. [13]. They describe a general framework for identifying and controlling high bandwidth aggregates in a network. As an example solution against DDoS attacks, an aggregate can be defined based on destination IP address, as in our proposal. To protect good user traffic from attacker traffic destined for the same victim server, they study recursive pushbackof max-min fair rate limits starting from the victim server to upstream routers. Similar to level- max-min fairness, pushback defines aglobalnotion of max-min fairness. Unlike level- max-min fairness, the pushback mechanism always starts the resource sharing decision at the congestion point under attack (e.g., the server), where good user traffic may have aggregated to a large volume and thus can be severely punished (see Section VI-B.I). Such aggregation of normal user traffic has been observed to occur in practice [5].
Architecturally, our control algorithm is more of an end-to-end approach initiated by the server, whereas the proposal in Mahajanet al.[13] is more of a hop-by-hop ap-proach in which routers participate more heavily in the control decisions. Hence, our routers have simplified responsibilities, when compared with [13] – they do not need to compute server-centric max-min fair allocations, and are not required to generate and send backstatus messagesabout current resource state to the server.
The use of authentication mechanisms inside the network will also help defend against DDoS attacks, e.g., IPsec [10]. Re-cently, Goudaet al.[8] propose a framework for providinghop integrityin computer networks. Efficient alogrithms for authen-tication and key exchanges are important research questions in this class of solutions. It is possible to refine the criteria used in throttling for identifying attacker traffic, such as [7], [18].
Lastly, our solution operates at a higher level than packet scheduling techniques like fair queueing (e.g., WFQ [14]). Un-like standard congestion control, our solution is not applied at the point of congestion, but is proactive to avoid subsequent aggregation of attack traffc. We also do not require routers to exchange intricate control information (e.g., about resource or congestion states) between each other, greatly simplifying the deployment complexity. Our solution aims to achieve max-min fairness across a potentially large number of flows. Scalable max-min fair allocation in such a situation is studied in [4],
where the optimal sharing objective is relaxed to achieve sub-stantial reductions in overhead.
IX. CONCLUSION
We presented a server-centric approach to protecting a server system under DDoS attacks. The approach limits the rate at which an upstream router can forward packets to the server, so that the server exposes no more than its designed capacity to the global network. In allocating the server capacity among the up-stream routers, we studied a notion of level- max-min fairness, which is policy-free and hence easy to deploy and manage.
Using a control-theoretic mathematical model, we studied stability and convergence issues of router throttling under dif-ferent system parameters. In addition, we evaluated algorithm effectiveness using a realistic global network topology, and var-ious models for attacker and good user distributions and behav-iors. Our results indicate that the proposed approach can offer significant relief to a server that is being flooded with malicious attacker traffic. First, for aggressive attackers, the throttle mech-anism can preferentially drop attacker traffic over good user traffic, so that a larger fraction of good user traffic can make it to the server as compared with no network protection. In particular, for the case of aggressive attackers and large , level- max-min fairness performs better than recursive pushback of max-min fair rate limits previously proposed in the literature [13]. This is especically the case when attackers are evenly distributed over the network. Second, for both aggressiveand“meek” attackers, throttling can regulate the experienced server load to below its design limit, so that the server can remain operational during a DDoS attack. Moreover, our implementation results show that throttling has low computation and memory overheads at a de-ployment router.
Our results indicate that server-centric router throttling is a promising approach to countering DDoS attacks, but several nontrivial challenges remain that prevent its immediate deploy-ment in the Internet. Our focus has been on DDoS attacks in which attackers try to overwhelm a victim server by directing an excessive volume of traffic to the server. Other forms of at-tacks are possible that do not depend on the sheer volume of attack traffic [12]. However, more sophisticated attack analysis (e.g., intrusion detection) is usually feasible to deal with these other forms of attacks.
REFERENCES
[1] Blackhole Route Server and Tracking Traffic on an IP Network [Online]. Available: http://www.secsup.org/Tracking
[2] TCP SYN Flooding and IP Spoofing Attacks. CERT Advisory CA-96.21. [Online]. Available: http://www.cert.org/
[3] (1998) Smurf IP Denial-of-Service Attacks. CERT Advisory CA-1998-01. [Online]. Available: www.cert.org/advisories/CA-98.CA-1998-01.html [4] B. Awerbuch and Y. Shavitt, “Converging to approximated max-min
flow fairness in logarithmic time,” inProc. IEEE INFOCOM, San Fran-cisco, CA, Mar. 1998.
[5] W. Fang and L. Peterson, “Inter-AS traffic patterns and their implica-tions,” inProc. IEEE Global Internet Symp., Rio de Janeiro, Brazil, Dec. 1999.
[6] P. Ferguson and D. Senie, “Network Ingress Filtering: Defeating Denial of Service Attacks Which Employ IP Source Address Spoofing,” IETF, RFC 2827, 2000.
[7] A. Garg and A. L. N. Reddy, “Mitigation of DoS attacks through QoS regulation,” inProc. IEEE IWQoS, Miami Beach, FL, May 2002.
[8] M. G. Gouda, E. N. Elnozahy, C. T. Huang, and T. M. McGuire, “Hop integrity in computer networks,” inProc. IEEE ICNP, Osaka, Japan, Nov. 2000.
[9] S. C. Han, P. Zaroo, D. K. Y. Yau, P. Gopalan, and J. C. S. Lui, “Quality of Service Provisioning for Composable Routing Elements,” Purdue Univ., West Lafayette, IN, Tech. Rep., 2002.
[10] S. Kent and R. Atkinson, “Security Architecture for the Internel Pro-tocol,” IETF, RFC 2401, 1998.
[11] F. Liang, D. K. Y. Yau, and J. C. S. Lui, “On Defending Against Dis-tributed Denial-of-Service Attacks With Server-Centric Router Throt-tles,” Dept of Computer Sciences, Purdue University, West Lafayette, IN, Tech. Rep. TR-01-008, 2001.
[12] G. de Vivo, M. de Vivo, and G. Isern, “Internet security attacks at the basic levels,”ACM Oper. Syst. Rev., vol. 32, Apr. 1998.
[13] R. Mahajan, S. Bellovin, S. Floyd, J. Ioannidis, V. Paxson, and S. Shenker, “Controlling High Bandwidth Aggregates in the Network,” ACIRI and AT&T Labs Research, Tech. Rep. , 2001.
[14] A. K. Parekh and R. G. Gallager, “A generalized processor sharing ap-proach to flow control in integrated services networks: The single-node case,”IEEE/ACM Trans. Networking, vol. 1, pp. 344–357, Jun. 1993. [15] K. Park and H. Lee, “On the effectiveness of probabilistic packet
marking for IP traceback under denial of service attack,” inProc. IEEE INFOCOM, Anchorage, AK, 2001.
[16] S. Savage, D. Wetherall, A. Karlin, and T. Anderson, “Practical net-work support for IP traceback,” inProc. ACM SIGCOMM, Stockholm, Sweden, Aug. 2000.
[17] D. Song and A. Perrig, “Advanced and authenticated techniques for IP traceback,” inProc. IEEE INFOCOM, Anchorage, AK, 2001. [18] H. Wang, D. Zhang, and K. G. Shin, “Detecting SYN flooding attacks,”
inProc. IEEE INFOCOM, New York, NY, Jun. 2002.
[19] D. K. Y. Yau and X. Chen, “Resource management in software-pro-grammable router operating systems,”IEEE J. Select. Areas Commun., vol. 19, no. 3, pp. 488–500, Mar. 2001.
David K. Y. Yau (M’97) received the B.Sc. (first class honors) degree from the Chinese University of Hong Kong, and the M.S. and Ph.D. degrees from the University of Texas at Austin, all in computer sciences.
From 1989 to 1990, he was with the Systems and Technology group of Citibank, NA. He was the recipient of an IBM graduate fellowship, and is currently an Associate Professor of Computer Sciences at Purdue University, West Lafayette, IN. His other research interests are in network security, value-added services routers, and mobile wireless networking.
Dr. Yau received an NSF CAREER Award in 1999, for research on network and operating system architectures and algorithms for quality of service provi-sioning. He is a member of the ACM, and serves on the editorial board of the IEEE/ACM TRANSACTIONS ONNETWORKING.
John C. S. Lui(SM’02) received the Ph.D. degree in computer science from the University of California at Los Angeles.
He worked in the IBM T. J. Watson Research Laboratory and in the IBM Almaden Research Laboratory/San Jose Laboratory before taking up an academic position at the Chinese University of Hong Kong. Currently, he is leading a group of research students in the Advanced Networking and System Research Group. His research encompasses both systems and theory. His current research interests are in theoretical/applied topics in data networks, distributed multimedia systems, network security, OS design, mathematical optimization, and performance evaluation.
Dr. Lui received the Vice-Chancellor’s Exemplary Teaching Award in 2001. He is an Associate Editor of thePerformance Evaluation Journal, a member of the ACM, and an elected member of the IFIP WG 7.3. He serves as the TPC co-chair of ACM Sigmetrics 2005.
Feng Liangreceived the B.S. and M.S. degrees in optical instruments from Zhejiang University, P.R. China, in 1989 and 1992, respectively, and the Ph.D. degree in optical instruments from the Shanghai Institute of Optics and Fine Mechanics, Chinese Academy of Sciences, Beijing, in 1995.
He is currently a Professor of telecommunica-tions at Zhejiang University of Technology. He has authored and coauthored over 30 technical papers in various journals. His current research interests are in network security, QoS in WLAN, network management systems, and multimedia communications.
Yeung Yamreceived the B.S. and M.S. degrees in physics from the Chinese University of Hong Kong and the University of Akron, Akron, OH, and the M.S. and Sc.D. degrees in aeronautics and astronau-tics from the Massachusetts Institute of Technology, Cambridge, MA, in 1979 and 1983, respectively.
From 1985 to 1992, he was a Member of the Technical Staff in the Control Analysis Research Group of the Guidance And Control Section, Jet Propulsion Laboratory, Pasadena, CA. He joined the Chinese University of Hong Kong in 1992 and is currently a Professor in the Department of Automation and Computer-Aided Engineering. His research interests include analysis, design, and identification of control systems.