C
2015. The American Astronomical Society. All rights reserved.
ALMA OBSERVATIONS OF WARM DENSE GAS IN NGC 1614—BREAKING OF
THE STAR FORMATION LAW IN THE CENTRAL KILOPARSEC
∗C. K. Xu1, C. Cao1,2,3, N. Lu1, Y. Gao4, T. Diaz-Santos1, R. Herrero-Illana5, R. Meijerink6, G. Privon7, Y.-H. Zhao1,4, A. S. Evans7,8, S. K ¨onig9, J. M. Mazzarella1, S. Aalto10, P. Appleton1, L. Armus1, V. Charmandaris11,12,13, J. Chu14,
S. Haan15, H. Inami16, E. J. Murphy1, D. B. Sanders14, B. Schulz1, and P. van der Werf6
1Infrared Processing and Analysis Center, MS 100-22, California Institute of Technology, Pasadena, CA 91125, USA 2School of Space Science and Physics, Shandong University at Weihai, Weihai, Shandong 264209, China
3Shandong Provincial Key Laboratory of Optical Astronomy and Solar-Terrestrial Environment, Weihai, Shandong 264209, China 4Purple Mountain Observatory, Chinese Academy of Sciences, 2 West Beijing Road, Nanjing 210008, China
5Instituto de Astrof´ısica de Andaluc´ıa - CSIC, Glorieta de la Astronom´ıa, s/n, E-18008 Granada, Spain 6Leiden Observatory, Leiden University, P.O. Box 9513, NL-2300 RA Leiden, The Netherlands 7Department of Astronomy, University of Virginia, P.O. Box 400325, Charlottesville, VA 22904, USA
8National Radio Astronomy Observatory, Charlottesville, VA 22904, USA
9Institut de Radioastronomie Millim´etrique (IRAM), 300 rue de la Piscine, Domaine Universitaire, F-38406 Saint Martin d’H`eres, France 10Department of Earth and Space Sciences, Onsala Observatory, Chalmers University of Technology, SE-439 92 Onsala, Sweden
11Department of Physics, University of Crete, GR-71003 Heraklion, Greece
12Institute for Astronomy, Astrophysics, Space Applications & Remote Sensing, National Observatory of Athens, GR-15236 Penteli, Greece 13Chercheur Associ´e, Observatoire de Paris, F-75014 Paris, France
14Institute for Astronomy, University of Hawaii, 2680 Woodlawn Drive, Honolulu, HI 96816, USA 15CSIRO Astronomy and Space Science, ATNF, P.O. Box 76, Epping 1710, Australia 16National Optical Astronomy Observatory, 950 North Cherry Avenue, Tucson, AZ 85719, USA
Received 2014 September 2; accepted 2014 November 4; published 2015 January 12
ABSTRACT
We present ALMA Cycle-0 observations of the CO (6–5) line emission and of the 435μm dust continuum emission in the central kiloparsec of NGC 1614, a local luminous infrared galaxy at a distance of 67.8 Mpc (1=329 pc). The CO emission is well resolved by the ALMA beam (0.26×0.20) into a circumnuclear ring, with an integrated flux offCO(6–5)=898 (±153) Jy km s−1, which is 63(±12)% of the total CO (6–5) flux measured by Herschel. The molecular ring, located between 100 pc<r<350 pc from the nucleus, looks clumpy and includes seven unresolved (or marginally resolved) knots with median velocity dispersion of∼40 km s−1. These knots are associated with strong star formation regions withΣSFR∼100Myr−1kpc−2andΣGas ∼104Mpc−2. The non-detections of the nucleus in both the CO (6–5) line emission and the 435μm continuum rule out, with relatively high confidence, a Compton-thick active galactic nucleus in NGC 1614. Comparisons with radio continuum emission show a strong deviation from an expected local correlation betweenΣGasandΣSFR, indicating a breakdown of the Kennicutt–Schmidt law on the linear scale of∼100 pc.
Key words: galaxies: active – galaxies: evolution – galaxies: general – galaxies: interactions – galaxies: ISM – galaxies: nuclei – galaxies: magnetic fields – galaxies: starburst – submillimeter: galaxies
1. INTRODUCTION
Luminous infrared galaxies (LIRGs) withLIR[8–1000μm]> 1011.5L
, including ultra-luminous infrared galaxies (ULIRGs:
LIR >1012L
), are mostly advanced mergers (Sanders et al.
1988; Sanders & Mirabel1996; Scoville et al.2000; Veilleux et al. 2002). They harbor extreme starbursts (star formation rate (SFR)50 Myr−1) and sometimes strong active galac-tic nuclei (AGNs), and are among the most luminous objects in the local universe (Sanders et al.1988; Genzel et al.1998; Surace et al.1998; Veilleux et al. 1999; Scoville et al. 2000; Veilleux et al.2009). Observations and theoretical simulations have shown that mergers can transform spirals to ellipticals (Toomre 1977; Schweizer 1982; Barnes 1990; Genzel et al.
2001; Veilleux et al.2002; Dasyra et al.2006). Gas outflows ubiquitously found in (U)LIRGs (Armus et al.1990; Heckman et al.2000; Walter et al. 2002; Rupke et al.2005; Sakamoto et al.2009; Fischer et al.2010; Feruglio et al.2010; Sturm et al.
2011; Aalto et al.2012; Veilleux et al.2013; Cicone et al.2014) may play an important role in quenching the star formation that
∗ The National Radio Astronomy Observatory is a facility of the National
Science Foundation operated under cooperative agreement by Associated Universities, Inc.
leads to the formation of red sequence galaxies (Bell et al.2007; Faber et al.2007; Hopkins et al.2008,2013).
Table 1 ALMA Observations
SB Date Time (UTC) Config Nant lmax tint Tsys
(yyyy/mm/dd) (m) (minutes) (K)
(1) (2) (3) (4) (5) (6) (7) (8)
X49990a_X505 2012/08/13 11:31:46–12:52:33 E&C 23 402 24.7 537
X4b58a4_X1ee 2012/08/28 08:58:50–10:23:37 E&C 27 402 24.7 756
Notes.Column 1: schedule-block number; Columns 2 and 3: observation date and time; Column 4: configuration; Column 5: number of antennae; Column 6: maximum baseline length; Column 7: on-target integration time; Column 8: medianTsys.
and spatial distributions of star formation in (U)LIRGs correlate significantly stronger with those of higher J CO lines (with upper levelJ3), which probe warmer and denser gas than low J lines (Yao et al.2003; Iono et al.2004; Wang et al.2004; Wilson et al.
2008; Iono et al.2009; Sakamoto et al.2008; Tsai et al.2012; Sakamoto et al.2013; Xu et al.2014). This is consistent with results of observations of other dense molecular gas indicators such as HCN lines (Solomon et al.1992; Gao & Solomon2004b; Narayanan et al.2008; Graci´a-Carpio et al.2008; Garc´ıa-Burillo et al.2012). The multi-J CO observations of Papadopoulos et al. (2012) indicate that for many (U)LIRGs the global CO spectral line energy distribution (SLED) is dominated by a very warm (T ∼100K) and dense (n 104cm−3) gas phase. Lu et al. (2014) found a strong and linear correlation between the mid-J (with upper level J between 5 and 10) luminosity and theLIRin a HerschelSPIRE Fourier Transform Spectrometer (FTS) survey of a large (U)LIRG sample.
In order to study the warm dense gas in nuclear regions of (U)LIRGs, we observed the CO (6–5) line emission (rest-frame frequency=691.473 GHz) and associated dust contin-uum emission in two nearby examples, NGC 34 and NGC 1614, using the Band 9 receivers of the Atacama Large Millimeter Array (ALMA; Wootten & Thompson2009). Both NGC 34 and NGC 1614 were chosen for these early ALMA observations, among the complete sample of 202 LIRGs of the Great Obser-vatories All-sky LIRG Survey (GOALS; Armus et al. 2009), because of their close proximity (D <85 Mpc) and bright CO (6–5) line fluxes (fCO(6–5) 1000 Jy km s−1) observed in the HerschelSPIRE FTS survey of GOALS galaxies (angular res-olution:∼30; van der Werf et al.2010; Lu et al.2014). This enables high signal-to-noise ratio ALMA observations of warm gas structures with linear resolutions of100 pc for the given angular resolutions of∼0.25. Further, both LIRGs have declina-tion angles close to the latitude of the ALMA site, and therefore the Band 9 observations are affected by minimal atmospheric absorption when being carried out near transit.
In this paper, we present ALMA Cycle-0 observations of the CO (6–5) line emission and the 435μm dust continuum emission in the central kiloparsec of NGC 1614 (also known as Mrk 617 and Arp 186). This LIRG has an infrared luminosity of LIR=1011.65L
(Armus et al.2009) at a distance of 67.8 Mpc
(1 = 329 pc). Most of the current star formation activity is in a circumnuclear starburst ring (Neff et al. 1990; Alonso-Herrero et al.2001; D´ıaz-Santos et al.2008; Olsson et al.2010), presumably triggered by a minor merger with a mass ratio of 4 : 1 (Neff et al.1990; V¨ais¨anen et al.2012). The nucleus itself may harbor a much weaker and older starburst (Alonso-Herrero et al.2001) and a Compton-thick AGN (Risaliti et al.2000, but see Olsson et al.2010; V¨ais¨anen et al.2012). The observations and data reductions are described in Section2, the results are presented in Section3, and Section4and Section5are devoted
to a discussion and the summary, respectively. All velocities in this paper are in the radio LSR convention. Throughout this paper, we adopt theΛcosmology withΩm=0.3 andΩΛ=0.7, andH0=70 km s−1Mpc−1.
2. OBSERVATIONS
We observed the central region of NGC 1614 in CO (6–5) line emission and 435μm dust continuum emission using the Band 9 receivers of ALMA in the time division mode (TDM; velocity resolution: 6.8 km s−1). The four basebands (i.e., “Spectral Windows,” hereafter SPWs) were centered at the sky frequencies of 680.539, 682.308, 676.826, and 678.764 GHz, respectively, each with a bandwidth of 2 GHz. Observations were carried out in the extended & compact (E&C) configuration using up to 27 antennae (Table1). The total on-target integration time was 50.4 minutes. During the observations, phase and gain variations were monitored using QSO 0423-013. Observations of the minor planet Ceres were made for the flux calibration. The error in the flux calibration was estimated to be 17%.
+
+
+
+
Figure 1.Upper left: image and contours of the integrated CO (6–5) line emission. The contour levels are [1, 2, 4, 8]×2.7 Jy km s−1beam−1. Upper right: image of the continuum overlaid by contours of the integrated CO (6–5) line emission. Lower left: first moment map overlaid by contours of the integrated CO (6–5) line emission. Lower right: second moment map overlaid by contours of the integrated CO (6–5) line emission. The white (black) ellipse at the bottom left of each panel shows the synthesized beam size (FWHM=0.26×0.20, P.A.=280◦). All figures have the same size of 4×4, and 1=329 pc. The cross in the center of each map marks the position of the radio nucleus in the 5 GHz (MERLIN) map (Olsson et al.2010).
3. RESULTS
3.1. The CO (6–5) Line Emission
In Figure1, we present images of the integrated CO (6–5) line emission, the continuum at 435μm, the first moment map, and the second moment map. All images are overlaid by the same contours of the integrated CO (6–5) line emission at levels of [1, 2, 4, 8]×2.7 Jy beam−1km s−1. The line and the contin-uum emissions correlate closely with each other, both showing a ring configuration without a detectable nucleus. The ring has a diameter of ∼2 (∼650 pc). In both the line and the con-tinuum maps, the ring looks clumpy and can be decomposed into several knots. The first moment map shows a clear veloc-ity gradient along the south–north direction, consistent with an inclined rotating ring. According to Olsson et al. (2010), the inner disk of NGC 1614 has an inclination angle of 51◦. In the second moment map, the velocity dispersion in most regions in the ring is rather constant at the level ofδv∼40 km s−1, though in some inter-knot regions it can be as low asδv∼20 km s−1. From the first moment map, the velocity gradient due to the rotation can be estimated to be dV /dr ∼ 0.3 km s−1pc−1, corresponding to a line widening of ∼20 km s−1 within
individual beams (linear size: ∼80 pc). This is consistent with the lowest velocity dispersion seen in the second moment map.
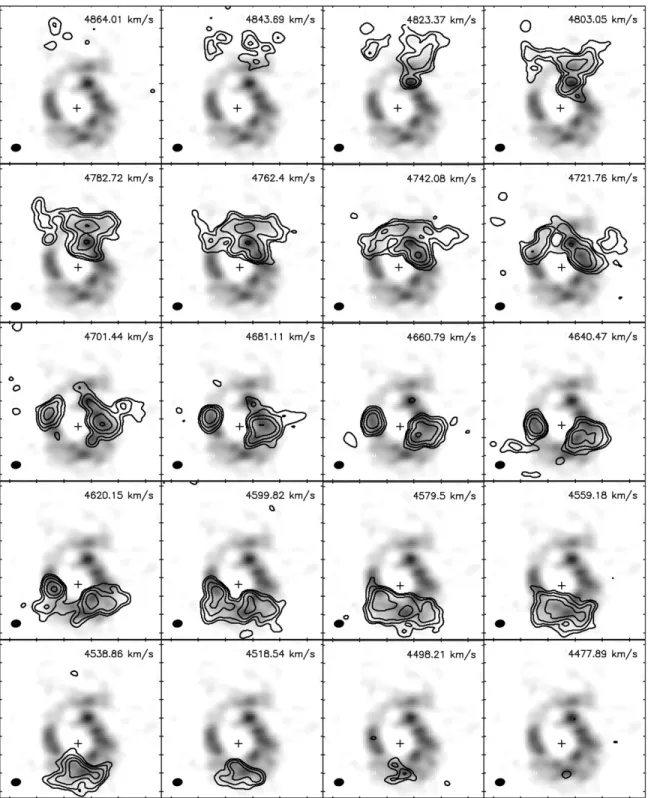
Figure 2.CO (6–5) line emission contours of the channel maps (the velocity channel width=20.4 km s−1), and overlaid on the integrated emission map. The contour levels are 21 mJy beam−1×[1, 2, 4, 8, 16]. All maps have the same size of 4×4. In each panel, the central velocity of the channel is given. (The system velocity of
NGC 1614 is 4723 km s−1.)
CO (6–5) line emission of NGC 1614 (1423±126 Jy km s−1 within a beam of∼30; van der Werf et al.2010; Lu et al.2014) yields an interferometer-to-single-dish flux ratio of 0.63±0.12. This suggests that most warm dense gas in NGC 1614 is concentrated in the circumnuclear ring.
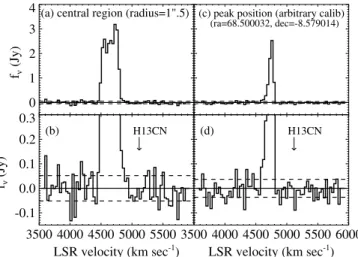
Figure 3 shows plots of the velocity distributions of the central region (radius = 1.5 500 pc) and of the peak position (R.A. = 04h34m00s.006, decl. = −08◦3444.47) of the integrated CO (6–5) line emission map. In order to reduce the noise, we used relatively broad bins of δv = 34 km s−1.
0 1 2 3 4
fν
(Jy)
(a) central region (radius=1".5) (c) peak position (arbitrary calib) (ra=68.500032, dec=-8.579014)
3500 4000 4500 5000 5500 LSR velocity (km sec-1
) -0.1
0.0 0.1 0.2 0.3
fν
(Jy)
H13CN (b)
3500 4000 4500 5000 5500 6000 LSR velocity (km sec-1
) H13CN (d)
Figure 3.Panel (a): spectrum of the CO (6–5) line emission in the velocity domain, measured in the channel maps with an aperture of radius = 1.5. The dashed lines mark the 1σ noise boundaries. Panel (b): zoom-in of the bottom part of panel (a). Again the dashed lines mark the 1σnoise boundaries. The arrow marks the expected location of the H13CN (8–7) line at the systemic velocity ofv=4723 km s−1. Panel (c): spectrum at the peak position (R.A.=04 : 34 : 00.006, decl.= −08 : 34 : 44.47) of the integrated CO (6–5) line emission map. In order to show it more clearly, the flux is scaled up arbitrarily. Panel (d): zoom-in of the bottom part of panel (c).
3.2. The 435μmContinuum Emission
The flux density of the 435μm continuum measured by ALMA isf435μm =269±46 mJy. The continuum correlates spatially with the CO (6–5) emission in the central kiloparsec of NGC 1614 (Figure 1). This suggests that dust heating and gas heating in the warm dense gas cores are strongly coupled, a conclusion also reached by Lu et al. (2014) in a HerschelFTS study of the CO SLED of LIRGs. NGC 1614 was observed by Herschel-SPIRE (Griffin et al. 2010) both in the photometry mode (J. Chu et al., in preparation) and in the FTS mode (van der Werf et al.2010; Lu et al. 2014), with beams of ∼30. Because the error of the continuum measured in the FTS mode is large (∼1 Jy), we estimated the total flux of the 435μm continuum of NGC 1614 using SPIRE photometer fluxesf350μm,SPIRE =1916±134 mJy and f500μm,SPIRE=487±34 mJy. Assuming a power-law spectrum for the dust continuum (i.e., log fνdepending on logνlinearly),
we carried out linear interpolation in the logarithmic domain of the flux and of the frequency between 350 and 500μm, and foundf435μm,SPIRE=831±58 mJy. The ratio betweenf435μm and f435μm,SPIRE then yields an interferometer-to-single-dish flux ratio of 0.32±0.06. This is a factor of ∼2 lower than the interferometer-to-single-dish flux ratio of the line emission, indicating that the distribution of dust is substantially more extended than that of the warm dense gas.
The total dust mass in NGC 1614 can be estimated using the mid- and far-IR fluxes in the Spitzer/MIPS 24μm band and in the Herschel 70, 100, 160, 250, 350, and 500μm bands. The Herschel data are taken from J. Chu et al. (in preparation). A least-squares fit to the IR SED by a two-graybody model, with the emissivity spectral index β = 2 for both components, yields a total dust mass ofMdust,total = 107.60±0.07M
with a cold dust temperature ofTC =35±2K
(Figure 4). Fits by two-graybody models with β as a free parameter or by the model of Draine & Li (2007) yield very similar results. If dust in the central region has the sameTC, thenMdust,cent =f435μm,ALMA/f435μm,wSPIRE×Mdust,total. Taking
Figure 4.SED fitting of the dust emission in NGC 1614 by a two-graybody model.
into account the uncertainties due to the assumption on the cold dust temperature (∼50%), the dust mass in the central region observed by ALMA isMdust,cent =107.11±0.20M. NGC 1614 has a metallicity of 12 + log(O/H) = 8.65±0.10 (Armus et al. 1989; Vacca & Conti 1992; Engelbracht et al. 2008; Modjaz et al.2011). According to R´emy-Ruyer et al. (2014), for galaxies with 12 + log(O/H)>8.5, the gas-to-dust ratio is 100 with a 1-σ uncertainty of∼0.2 dex. Therefore, assuming Mgas/Mdust = 102.0±0.2, the gas mass in the central region of NGC 1614 isMgas,cent =109.11±0.30M. This is consistent with the molecular gas mass (which should dominate the total gas mass) found in the same region (Mgas,cent = 109.30M, with a conversion factor of XCO = 3×1020cm−2(K km s−1)−1; K¨onig et al. 2013). It should be pointed out that both the ALMA continuum observations and the SMA observations of CO (2–1) by K¨onig et al. (2013) detected mostly dust and gas emission in dense gas structures and missed significantly the diffuse emission; therefore, the dust and gas mass derived from these observations are lower limits.
There has been a debate on whether there is an AGN in NGC 1614. Risaliti et al. (2000) argued, based on the detection of a hard X-ray source and its spectrum, that in the center of NGC 1614 there is a hidden AGN obscured by Compton-thick gas (NH >1.5×1024cm−2; Comastri2004). However,
such high column density gas in the nucleus, which will not be affected by the missing flux issue, is not detected in either the CO (6–5) map or the dust continuum map. Using the scaling factor between the gas mass and the continuum flux derived above, the non-detection of the continuum in the nucleus (σ =0.6 mJy beam−1) sets a 3σ upper limit for the gas surface density ofNH = 1023.1±0.3cm−2. Since an AGN cannot hide
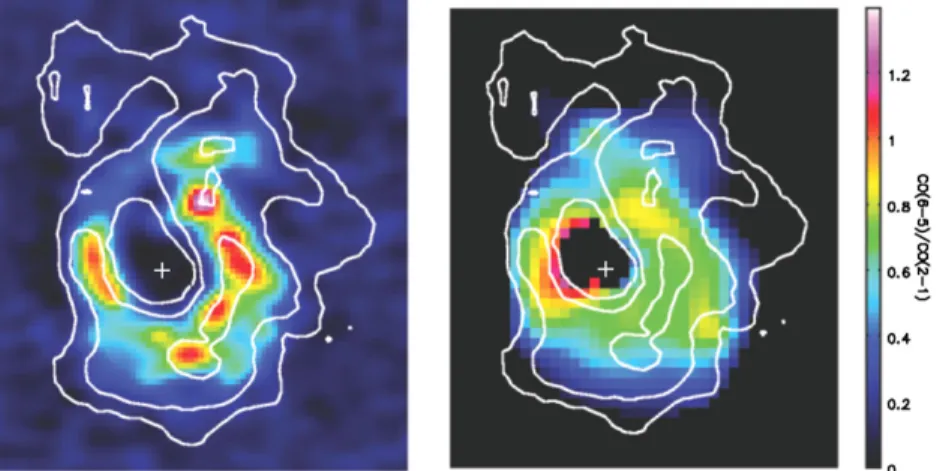
Figure 5.Left: comparison between integrated CO (6–5) line emission map (resolution: 0.26×0.20) and integrated CO (2–1) line emission contours (resolution: 0.50×0.44; K¨onig et al.2013). Right: contours of integrated CO (2–1) line emission overlaid on image of the ratio between integrated CO (6–5) line emission and integrated CO (2–1) line emission, with both being smoothed to a common beam (convolution of two original beams). Signals in the both maps are in the same units of K km s−1.
detected by Risaliti et al. (2000) could be explained by low-mass X-ray binaries.
4. DISCUSSION
4.1. Comparison with Previous CO Observations
There is rich literature on molecular line observations in the sub-mm and mm bands for NGC 1614 (Young et al. 1986; Solomon & Sage 1988; Scoville et al. 1989; Sanders et al.
1991; Casoli et al. 1991; Gao & Solomon 2004a; Albrecht et al.2007; Wilson et al.2008; Olsson et al.2010; Costagliola et al.2011; K¨onig et al.2013; Imanishi & Nakanishi2013). The single dish CO (1–0) observations of Sanders et al. (1991) found a total molecular gas mass of 1010.12M
, assuming a standard
conversion factor of XCO = 3×1020cm−2(K km s−1)−1 and distance ofD=67.8 Mpc. This is consistent with the result of Casoli et al. (1991), but significantly larger than those obtained in earlier and less sensitive observations (Young et al.1986; Solomon & Sage1988). The OVRO observations of Scoville et al. (1989), with a beam of 4×6, allocated 30% of the total CO (1–0) emission within a nuclear region of radius=1 kpc. The more recent and higher-resolution (2.75×2.40) observa-tions of Olsson et al. (2010) resolved the central CO (1–0) line emission into an arc-like feature∼3 kpc in length and∼1.3 kpc in width, but did not resolve the ring. The SMA map of CO (3–2) (beam=2.6×2.1; Wilson et al.2008) and the ALMA maps of HCN/HCO+/HNC (4–3) (beam=1.5×1.3; Imanishi & Nakanishi2013) also did not resolve the ring.
Before our ALMA observations, the best angular resolution for any CO rotation lines was obtained by K¨onig et al. (2013) in their SMA observations of the CO (2–1) line, with a beam of 0.50×0.44. In Figure5, we compare their CO (2–1) map with our CO (6–5) map. In the ring the two maps have good correspondence, though the CO (6–5) emission looks clumpier, most likely due to the better angular resolution. K¨onig et al. (2013) noticed a strong asymmetry in the CO (2–1) distribution between the eastern and western sides of the ring, and interpret it as a consequence of the feeding of the ring by the dust lane on the northwest of the ring. In the CO (6–5) map, we still see this asymmetry albeit being less prominent than in CO (2–1). When smoothed to a common beam, the ratio between the two emissions is rather constant in most regions of the ring, with a median brightness temperature ratio of 0.72 (Figure5). The east quadrant of the ring has the highest brightness temperature ratio
(∼1). This could be due, at least partially, to a slight mismatch between the two maps, given the steep gradient in both maps in this region. On the other hand, this seems to be consistent with the stronger east–west asymmetry seen in the CO (2–1) map than in the CO (6–5) map. K¨onig et al. (2013) argued that the reason of the asymmetry could be the feeding of the ring by a dust lane on the northwest of the ring. In this scenario, the east quadrant has higher CO (6–5)/CO (2–1) ratio than the west quadrant because it has less diffuse gas (freshly fed by the dust lane) compared to the west quadrant. The nucleus is not detected in either map. The CO (6–5) 3-σ upper limit of 742Mpc−2 (NH =1022.86cm−2) for the surface density of the warm dense
gas, derived by assuming the same relation betweenΣGas and CO (6–5) surface brightness in the ring region (Equation (3)), is consistent with the upper limit set by the 435μm continuum. If the conversion factor advocated by Downes & Solomon (1998) for (U)LIRGs is used, which is a factor of ∼6 lower than the standard value adopted in Equation (3), the result is a significantly lower value for the upper limit of ΣGas in the nucleus. In the region north of the ring, where significant CO (2–1) emission is found, little CO (6–5) emission is detected and the brightness temperature ratio is<0.1.
4.2. Relation between Warm Dense Gas and Star Formation
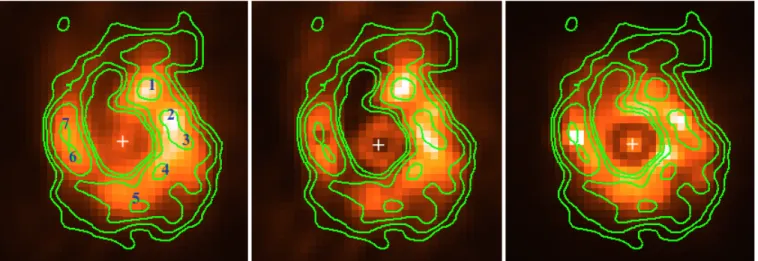
Figure 6.Comparison between contours of the integrated CO (6–5) line emission and images of the total 8.4 GHz radio continuum (left), the nonthermal radio component (middle), and the thermal radio component (right). Positions of CO (6–5) knots listed in Table2are marked by corresponding numbers in the left panel.
In the left panel of Figure 6, we compare the CO (6–5) contours with the radio continuum at 8.4 GHz (beam = 0.41×0.26, Herrero-Illana et al.2014). The CO (6–5) knots in the ring (Table2) are marked in the image. While there is a radio nucleus, the CO map has a hole at the ring’s center. Herrero-Illana et al. (2014) argued that the radio nucleus is not an AGN, which is consistent with our conclusion that there is no (Compton-thick) AGN in NGC 1614 (Section3.2). In the other two panels of Figure 6, the CO (6–5) emission is compared to the thermal and nonthermal radio emission components, respectively. Following Herrero-Illana et al. (2014), the thermal radio emission is estimated using a high-resolution, extinction-corrected Pa-αmap obtained from a set of HSTNIR narrow-and broadbnarrow-and images. The method involves the comparison of a Pa-α equivalent width map as well as an NIR color (F160W/F222M) image to stellar population synthesis models (Starburst99; Leitherer et al.1999) to derive a spatially resolved dust obscuration map with which to correct the original Pa-α image (see also D´ıaz-Santos et al. 2008). The details of this procedure can be found in theAppendix. As a final step, the nonthermal component is derived by subtracting from the total radio emission the thermal component. The thermal fraction of the radio continuum at 8.4 GHz is found to be 51% in the ring region (100<r<350 pc).
In Figure7, the radial profiles of the emissions are compared. The peak of the radial distribution of the thermal radio is shifted (by∼70 pc) toward the smaller radius compared to that of the CO (6–5) radial distribution. The peak of the distribution of the total radio emission also has a small offset compared to that of the CO (6–5), while the radial profile of nonthermal radio emission is similar to that of the CO (6–5) in the ring region. The radio profile of CO (2–1) (K¨onig et al.2013) is also shown in the same plot. If we compare the CO (2–1) profile with the profile of CO (6–5), which has been smoothed to the same resolution of CO (2–1), we see that the former is significantly more extended than the latter. Beyondr∼400 pc, the cold and diffuse molecular gas probed by CO (2–1) emission is devoid of any significant star formation (as revealed by the profiles of the radio emissions).
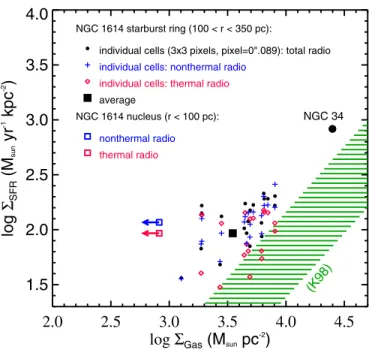
In Figure8, we plot the SFR surface density (ΣSFR) versus the gas surface density (ΣGas; i.e., the Kennicutt–Schmidt law) for the nuclear starburst and individual cells (3 pixels, pixel=0.089) in the ring, using the thermal and nonthermal
0.0
0.2
0.4
0.6
0.8
1.0
Radius (kpc)
0.0
0.2
0.4
0.6
0.8
1.0
1.2
f/f
peak
CO(6-5)
CO(6-5), smoothed to 0".5 beam
CO(2-1) (beam=0".5) radio 8.4GHz
nontherman radio
thermal radio (Pa-α, ext corr)
Figure 7.Comparison between normalized radial profiles of the CO (6–5), total radio continuum at 8.4 GHz, nonthermal radio component, thermal radio component, and CO (2–1). The arrows atr=0.1 kpc show the 3σupper limits of CO (6–5) and CO (2–1) in the central hole.
maps to deriveΣSFRand the CO (6–5) map (smoothed and re-gridded to match the radio maps) to obtainΣGas. The SFR can be estimated from the nonthermal and thermal radio luminosities using two formulae given in Murphy et al. (2012), respectively:
SFRnthν Myr−1
=6.64×10⁻²⁹
ν
GHz
αnth
Lnth ν
erg s−1Hz−1
.
(1)
and
SFRthν Myr−1
=4.6×10⁻²⁸
Te 104K
−0.45
× ν
GHz
0.1 Lth
ν
erg s−1Hz−1
, (2)
where Te = 104K, ν = 8.4 GHz, and αnth = 1.2
Table 2
CO (6–5) Knots in Circumnuclear Starburst Ring
(1) (2) (3) (4) (5) (6) (7) (8)
ID R.A. Decl. SCO(6–5) S435μm log(ΣGas) log(ΣSFR) Notes
(J2000) (J2000) (Jy km s−1beam−1) (mJy beam−1) (M
pc−2) (M
yr−1kpc−2)
1 04:34:00.006 −08:34:44.49 34.0±6.1 19.6±3.5 3.94 2.49 4
2 04:33:59.991 −08:34:44.86 27.2±4.9 13.8±2.5 3.87 2.40 6
3 04:33:59.981 −08:34:45.10 25.5±4.6 12.1±2.2 3.91 2.33 6
4 04:33:59.998 −08:34:45.52 25.5±4.6 11.7±2.1 3.88 2.41 7
5 04:34:00.015 −08:34:45.95 25.7±4.6 7.7±1.4 3.87 2.14 8
6 04:34:00.069 −08:34:45.29 22.8±4.1 10.3±1.9 3.81 2.36 10
7 04:34:00.077 −08:34:45.04 23.6±4.2 8.2±1.5 3.84 2.00 10
Notes.Column 4: CO (6–5) peak flux; Column 5: continuum peak flux; Column 6: peak molecular gas surface density, after smoothed to the beam of 8.4 GHz observations (0.41×0.26); Column 7: peak SFR density, derived using flux of the nonthermal radio at 8.4 GHz; Column 8: corresponding GMA in K¨onig et al. (2013).
2.0
2.5
3.0
3.5
4.0
4.5
log
Σ
Gas(M
sunpc
-2)
1.5
2.0
2.5
3.0
3.5
4.0
log
Σ
SFR(M
sun
yr
-1
kpc
-2)
(K98) NGC 34
individual cells (3x3 pixels, pixel=0".089): total radio
individual cells: thermal radio
individual cells: nonthermal radio
thermal radio
nonthermal radio
NGC 1614 nucleus (r < 100 pc): average
NGC 1614 starburst ring (100 < r < 350 pc):
Figure 8.Plot of logΣSFRvs. logΣGas. For individual cells in the NGC 1614 ring, logΣSFR,th(red diamonds) and logΣSFR,nth(blue crosses), and logΣSFR,total (black dots) are estimated using the thermal, nonthermal, and total radio maps, respectively; and logΣGasis estimated from the CO (6–5) map that is smoothed and regridded to match the radio maps. For the NGC 1614 nucleus (open squares), the 3σ upper limit for ΣGaswas derived using the CO (6–5) map assuming the same relation for the ring region (Equation (3)). The average for the NGC 1614 ring (black solid square): data taken from Table3. Nuclear starburst in NGC 34 (black solid circle): data taken from Table3. The shaded area (in green color) represents the data for local starbursts in the sample of Kennicutt (1998).
plotted in Figure8theΣSFRversusΣGasrelation with theΣSFR estimated from the total radio emission, assuming a constant nonthermal fraction (fnth=0.5) and the SFR versusLnthrelation in Equation (1).
The gas surface density was estimated using the CO (6–5) surface brightness as follows. According to K¨onig et al. (2013), the total H2 mass in the ring is MH2 = 10
8.97M
(for D = 67.8 Mpc), estimated using the CO (1–0) map of Olsson et al. (2010) and assuming a conversion factor of 3×1020cm−2(K km s−1)−1. Dividing this by the integrated CO (2–1) flux of the ring, SCO(2–1) = 65.4±6.9 Jy km s−1 (K¨onig et al. 2013) and assuming a brightness temperature ratio of 0.72 between CO (6–5) and CO (2–1) (Figure 5),
we have
Σ
Gas Mpc−2
=20.3×
fCO(6−5) Jy arcsec−2km s−1
. (3)
In the ring region, only cells that are detected in both radio and CO (6–5) maps above a 3-σ threshold are plotted (therefore the random errors are <0.12 dex for these data points). In the nuclear region (r <100 pc), the 3σ upper limit for ΣGas was derived using the CO (6–5) map assuming the same relation for the ring region (Equation (3)). For individual cells in the ring, theΣSFRversusΣGasrelation is systematically above that for local starbursts (Kennicutt 1998), indicating a higher star formation efficiency (SFE). This is because, by relating the SFR to the warm dense gas probed by the high-resolution ALMA observations of CO (6–5), much of the cold diffuse gas probed by low J CO (more extended than the warm dense gas) is excluded from the ΣGas in our results. It is worth noting that we used a standard CO conversion factor (XCO = 3×1020cm−2(K km s−1)−1) for NGC 1614 data. In the literature, arguments for high SFE in (U)LIRGs are very often based on results obtained using a CO conversion factor ∼5 times lower than the standard value (e.g., Daddi et al.2010; Genzel et al.2010).
It appears that on the linear scale of 100 pc, the tight cor-relation previously found betweenΣSFRversusΣGas(Kennicutt 1998; Genzel et al.2010; Leroy et al.2013; Yao et al.2003; Iono et al.2004; Wilson et al.2008) breaks down in the cen-tral kiloparsec of NGC 1614. In particular, the non-detections of the nucleus in both CO (6–5) and CO (2–1) maps set a lower-limit of theΣSFR-to-ΣGas ratio about an order of magni-tude above the nominal value, corresponding to a very short gas exhaustion timescale of Mgas/SFR < 10 Myr. The low extinction (Alonso-Herrero et al.2001; Kotilainen et al.2001; D´ıaz-Santos et al.2008) and low PAH emission (V¨ais¨anen et al.
2012) also indicate an ISM depression in the nuclear region. The star formation timescale associated with the thermal radio is∼10 Myr and that with the nonthermal radio is∼100 Myr. Alonso-Herrero et al. (2001) argued that, based on detections of deep CO stellar absorption, NGC 1614 harbors a nuclear starburst older than 10 Myr, which could have blown away the ambient ISM (V¨ais¨anen et al. 2012). If the timescale for the feedback effects, including both the gas consumption by star formation and mass loss by superwinds, is significantly shorter than 10 Myr (the dynamic timescale of the nuclear region is onlyτ ∼1 Myr), then the deviation of the nucleus from the
the old nuclear starburst. This is consistent with the results of Garc´ıa-Burillo et al. (2012) who found that NGC 1614 has the highest value of the SFE (estimated from the FIR/HCN ratio) among a sample of normal star-forming galaxies and mergers, and argued that this could be due to the exhaustion of the dense molecular gas by starburst activity.
In the starburst ring, the correlation betweenΣSFR,thandΣGas is rather weak (Spearman’s rank correlation coefficientρ=0.37 with the significance of its deviation from zerop=0.20). Also, the correlation betweenΣSFR,total (estimated using total radio emission) andΣGas has a large scatter, and is only marginally significant (ρ=0.64 andp=0.0023). This is consistent with the systematic offset between the radial profiles of the total radio and CO (6–5) in Figure 7. While the weak correlation betweenΣSFR,thandΣGascould be mainly due to the uncertainties associated with the obscuration correction of the Paα (the thermal radio is estimated using the obscuration-corrected Paα), this cannot explain the lack of correlation betweenΣSFR,totaland
ΣGas. We have already seen a breakdown of theΣSFR-to-ΣGas correlation in the nucleus, and interpreted it as a consequence of starburst feedback. The same scenario can be applied to the individual cells in the ring. Given the high resolutions of the radio and CO (6–5) maps, these cells correspond to star formation regions of linear scales of ∼100 pc. On such fine scales, theΣSFR-to-ΣGasrelation could be sensitive to the local star-formation history. Indeed, Alonso-Herrero et al. (2001) suggested that in NGC 1614 the starburst propagates like a “wild fire” from the nucleus outward. V¨ais¨anen et al. (2012) proposed that even the ring is stratified in terms of the star formation age. In a CO (1–0) survey of M33, Onodera et al. (2010) found a breakdown of the Kennicutt–Schmidt law on the linear scale of ∼80 pc, and attributed it to the various evolutionary stages of giant molecular clouds (GMCs) and to the drift of young clusters from their parent GMCs. These interpretations are applicable to our results, although our ALMA observations probe an even tighter correlation between CO (6–5) and SFR in a LIRG associated with a starburst merger.
A stronger correlation is found between ΣSFR,nth andΣGas in the starburst ring (ρ = 0.81 and p = 1.6×10⁻⁵). This is puzzling because, given the longer star formation timescale associated with the nonthermal radio, this relation should be more sensitive to the star formation history than theΣSFR,thand
ΣGas relation. It is likely that theΣSFR,nth andΣGas correlation is driven by other factors than the Kennicutt–Schmidt law. One possibility is that it is due to the correlation between the magnetic field strength and the gas density (Fiebig & Guesten 1989; Helou & Bicay 1993; Niklas & Beck 1997). Observationally, this correlation extends from the smallest (Fiebig & Guesten1989) to the largest cosmic scales (Vall´ee
1990,1995), and has the form of B ∝ nk for n > 102cm−3, where B is the magnetic field strength, n the gas density, and k=0.5±0.1 (Fiebig & Guesten1989). Since the emissivity of the nonthermal (synchrotron) radiation is proportional to B2, the B-versus-ncorrelation leads naturally to a localized (∼linear) correlation between nonthermal surface brightness and gas surface density. Another possibility is that the nonthermal radio and the CO (6–5) correlate with each other because they are both powered by cosmic rays (CRs). Indeed, CSO observations of 12CO(6–5) and13CO(6–5) by Hailey-Dunsheath et al. (2008) of
the nuclear starburst in the central 180 pc of NGC 253 suggested that warm molecular gas is most likely to be heated by an elevated density of CRs or by turbulence. In order to test whether CRs dominate the heating of warm molecular gas in NGC 1614,
we carried out model-fitting using theoretical models (Meijerink & Spaans 2005; Kazandjian et al.2012,2014) of the cosmic ray dominated regions (CDRs) and photon dominated regions (PDRs) to fit the emission lines of 12CO, 13CO, HCN, HNC, and HCO+. These are mostly single dish data for the entire system of NGC 1614 (Sanders et al.1991; Albrecht et al.2007; Costagliola et al. 2011; N. Lu et al. 2014, in preparation), plus some high-resolution interferometry data for the central region taken from the literature (Wilson et al. 2008; Olsson et al.2010; K¨onig et al.2013; Imanishi & Nakanishi2013) and from this work. The results show that PDR models with strong mechanical heating (by turbulence) provide the best fit while CDR models fit the data rather poorly. Details of these results will be presented elsewhere (R. Meijerink et al., in preparation). This is consistent with Rosenberg et al. (2014a) who modeled theHerschelobservations of12CO up to upperJ=13 and13CO up to upperJ=6, together with data of other sub-mm lines taken from the literature, of NGC 253. They found that mechanical heating by turbulence is necessary to reproduce the observed molecular emission and CR heating is a negligible heating source. Rosenberg et al. (2014b) reached a similar conclusion for Arp 299A, a nuclear starburst in Arp 299 (a merger-induced LIRG). In principle, the turbulence can be related to the CRs through shocks generated by supernova remnants (SNRs) that can both power the turbulence (Draine 1980) and accelerate CRs (Drury et al. 1994). However, given the very different mechanisms for energizing low-velocity turbulence and for CR acceleration by SNR shocks, it is unlikely that this can explain the localized correlation between ΣSFR,nth andΣGas in the starburst ring down to the linear scale of 100 pc.
4.3. NGC 1614 and NGC 34: A Tale of Two LIRGs
In this section, we compare NGC 1614 with NGC 34, another local LIRG observed by our team using ALMA band-9 receivers (Xu et al.2014). Both galaxies are late-stage mergers (Neff et al.
1990; Schweizer & Seitzer2007). As shown in Table 3, they have similar absoluteK-band magnitudeMK(indicating similar stellar mass), similar total gas mass as obtained by Hiand CO observations, and similar total SFR as derived from the IR+UV luminosities (U et al.2012). On the other hand, as revealed by the ALMA observations and high angular resolution observations in other bands, the two galaxies are very different in the central kiloparsec.
Table 3
Comparison between NGC 1614 and NGC 34
NGC 1614 NGC 34
R.A. (J2000)a 04h34m00s.03 00h11m06s.54 Decl. (J2000)a −08◦3445.1 −12◦0627.5
Distance (Mpc) 67.8 84.1
LIR(L)b 1011.65 1011.49
MK(mag)c −24.59 −24.46
MHi(M)d 109.45 109.72
SFRtot(Myr−1)e 51.3 34.7
MH2,tot(M)
f 1010.12 1010.15
Mdust,tot(M)g 107.60 107.48
AGN No Yes
Merger mass ratio 4:1–5:1 3:2–3:1
S8.4 GHz,tot(mJy)h 41.1
SCO(6−5),tot(Jy km s−1)i 1423±126 937±63
S435μm,tot(mJy)j 831±58 517±36
Central Starburst
Morphology Circumnuclear ring Nuclear disk
Radius (pc) rin=100, rout=350 100
S8.4 GHz,cent(mJy)k 26.5 15.2
SFRcent(Myr−1)l 32.8 26.0
ΣSFR(Myr−1kpc−2)m 92.8 827.6
MH2,cent(M)n 108.97 108.76
ΣGas(Mpc−2)o 103.54 104.40
SCO(6–5),cent(Jy km s−1)p 898±153 1004±151
S435μm,cent(mJy)q 269±46 275±41
Mdust,cent(M)r 107.11 106.97
Notes.
aCoordinates of the nucleus in the 8.4 GHz radio continuum. bIR luminosity between 8–1000μm (Armus et al.2009). cAbsoluteK-band magnitude (Rothberg & Joseph2004).
d Total mass of neutral atomic hydrogen gas, taken from compilation by Kandalyan (2003).
eTotal star formation rate (U et al.2012).
f Total mass of molecular hydrogen gas (assuming X
CO = 3 × 1020cm−2(K km s−1)−1); NGC 1614: Sanders et al. (1991); NGC 34: Kruegel et al. (1990).
gTotal dust mass; NGC 1614: this work; NGC 34: Esquej et al. (2012). hTotal flux of the 8.4 GHz radio continuum (Schmitt et al.2006). iTotal flux of the CO (6–5) emission (N. Lu et al. 2014, in preparation). jTotal flux of the 435μm continuum emission; NGC 1614: this work; NGC 34: Xu et al. (2014).
k Flux of the 8.4 GHz radio continuum in the central region; NGC 1614: Herrero-Illana et al. (2014); NGC 34: Condon et al. (1991).
l The SFR of central starburst: SFRcent = SFRtot ×fcent, where f cent =
S8.4 GHz,cent/S8.4 GHz,tot=0.64 for NGC 1614, andfcent=0.75 for NGC 34. mMean SFR column density of the central starburst.
nMass of molecular hydrogen gas in the central region; NGC 1614 (X CO = 3×1020cm−2(K km s−1)−1): K¨onig et al. (2013); NGC 34 (XCO = 0.5× 1020cm−2(K km s−1)−1): Fernandez et al. (2014).
oMean gas column density of the central starburst (M
Gas=1.36×MH2). pFlux of the CO (6–5) emission in the central starburst region; NGC 1614: this work; NGC 34: Xu et al. (2014).
q Flux of the 435μm continuum emission in the central starburst region; NGC 1614: this work; NGC 34: Xu et al. (2014).
rDust mass in the central starburst region; NGC 1614: this work; NGC 34: Xu et al. (2014).
for the starburst ring in NGC 1614, the ALMA observations presented here and the SMA observations of K¨onig et al. (2013) reveal that much of the CO emission is clumped in individual knots associated with giant molecular associations (GMAs), which might be self-gravitating. In this case, a standard Galactic CO conversion factor is more appropriate (Papadopoulos et al.
2012): XCO = 3.0 ×1020cm−2(K km s−1)−1. Nevertheless,
Figure 9.Plot of theLIRnormalized spectral line energy distributions (SLEDs) of NGC 1614 and NGC 34. The data points (all obtained by single-dish observations) are taken from the literature with the following references: for NGC 1614: Sanders et al. (1991) for CO (1–0); Albrecht et al. (2007) for CO (2–1); Wilson et al. (2008) for CO (3–2); N. Lu et al. (2014, in preparation) for CO (4–3) and other higher-Jlines; for NGC 34: (Albrecht et al.2007) and Maiolino et al. (1997) for CO (1–0); Papadopoulos & Seaquist (1998) for CO (2–1); Q. Zhang et al. (2014, in preparation) for CO (3–2); N. Lu et al. (2014, in preparation) for CO (4–3) and other higher-Jlines. The solid (dotted) line is model fitting of the CO SLED of NGC 1614 (NGC 34).
these conversion factors are very uncertain and are the major error sources for the molecular gas mass estimates.
In Figure9, we compare the spectral line energy distributions (SLEDs) of the total CO emission (measured by single-dish observations) of these two galaxies, taken from observations of Herschel-SPIRE FTS observations (N. Lu et al. 2014, in preparation). The CO SLED of NGC 1614 peaks around upper J = 5–7, while that of NGC 34 reaches a plateau after a rapid increase, and the peak is around upperJ=9. In order to further investigate the physical conditions of these two galaxies, we modeled the observed CO SLEDs using simple two-component RADEX large velocity gradient (LVG) radiative transfer models (van der Tak et al.2007), and adopting a similar procedure to that in Kamenetzky et al. (2012). Admittedly, results from such model fittings suffer significant degeneracy between parameters (Rosenberg et al.2014a). Nevertheless, they are useful for translating the information in the CO SLED into quantitative estimates of physical parameters of the gas, albeit with large uncertainties. We find that both SLEDs can be well fit by the combination of a cool and a warm component. Both galaxies have similar gas densities of (102.5, 102.6) cm−3 and (104, 104) cm−3, for the cool and warm components in (NGC 34, NGC 1614), respectively. However, the kinetic temperature of the warm component in NGC 34 (890 K) is two times higher than that of NGC 1614 (445 K), consistent with the fact that the nuclear starburst in NGC 34 is five times more compact than the circumnuclear starburst ring in NGC 1614. It is worthwhile noting that the AGN contribution to the warm gas in NGC 34 is insignificant (Xu et al.2014). Given the overall similarities between the two host galaxies (Table 3), it is likely that the staunch difference between the two central starbursts is caused by the difference in the merging processes that the two LIRGs have experienced.
authors have argued for a high mass ratio encounter; Rothberg & Joseph (2006) note the isophotal shape of NGC 1614 and its correspondence with simulations of high mass ratio mergers, while V¨ais¨anen et al. (2012) identify a possible remnant body of the lower-mass companion. Both Rothberg & Joseph (2006) and V¨ais¨anen et al. (2012) come to the same conclusion—that NGC 1614 is a 4:1 mass ratio merger—but the former assumes the nuclei have already merged and the latter relies on the identification of an interacting galaxy.
NGC 34 has no clear evidence for dual nuclei, suggesting the two galaxies have already coalesced. Owing to the asymme-try of integrated brightness of the two tidal tails Schweizer & Seitzer (2007) argue that this system is the result of a merger of two disk galaxies with a mass ratio between 3:2 and 3:1. The disky isophotal shape of the remnant (which shows no evidence for a disk in theK-band morphology) is consistent with a for-mation scenario of a major but unequal mass merger (Rothberg & Joseph2006; Naab et al.2006). Preliminary dynamical mod-eling of this system is consistent with the aforementioned mass ratio and both disks experiencing prograde interactions (G. C. Privon et al., in preparation). This dynamical model is consistent with the system being observed∼250–300 Myr since the first passage of the two galaxies, somewhat lower than the suggested 400 Myr age of the stellar disk (Schweizer & Seitzer2007).
Hence, NGC 34 has experienced a major merger of two galaxies of similar mass, which was catastrophic and destroyed both progenitor disks (Schweizer & Seitzer2007). Simulations by Cox et al. (2008) exploring the effect of mass ratio on merger-induced starbursts found a decreasing burst strength with increasing primary/secondary mass ratio; given the previously mentioned estimates of the mass ratios for NGC 34 and NGC 1614, the star formation surface densities are consistent with this interpretation. It might be that the higher mass ratio merger experienced by NGC 1614 caused less efficient torquing of the gas, leading to much of the central gas settling into the nuclear ring (with the help of either the inner Lindblad resonance associated with a bar (Olsson et al. 2010) or the non-axisymmetric potential caused by a minor merger (Combes
1988; Knapen et al.2004; Mazzuca et al.2006)) rather than collecting in the center, as in NGC 34. This may also hint at the answer to the question why NGC 1614 has not yet developed an AGN (V¨ais¨anen et al.2012) while NGC 34 has. According to Hopkins (2012), the built-up of a centrally peaked dense gas disk is a necessary condition for triggering of the AGN activity in late stage mergers.
An alternate explanation for NGC 1614’s comparatively lowerΣSFR, if the scenario proposed by V¨ais¨anen et al. (2012) is accurate, is that the merger has simply not yet run to completion and so has not yet caused the final funneling of gas toward the nucleus at the time of the merger (e.g., Mihos & Hernquist1994; Hopkins2012). Olsson et al. (2010) and K¨onig et al. (2013) both show that indeed most of the molecular gas in NGC 1614 sits in the dust lane (outside the ring) and even further out. It could be that the relatively minor perturbation of the first pass (which led to the northeast tail) created the outward propagating starburst (i.e., the “wild fire”), as revealed by the nuclear ring and the weak and old nuclear starburst, while a future merger will trigger a much stronger nuclear starburst as seen in NGC 34.
With current knowledge of the encounters in NGC 34 and NGC 1614, we cannot firmly assign the cause for the different starburst characteristics in the two systems. It is likely to be due to the effect of different mass ratios, but we cannot rule out other possible causes such as different current phases of the
encounters and different encounter geometries. While NGC 34 represents a large population of LIRGs with starburst nuclei (e.g., Arp 220), NGC 1614 represents those with circumnuclear starburst rings, which are also common in LIRGs. Among the GOALS sample, at least five other LIRGs (NGC 1068, NGC 5135, NGC 7469, NGC 7552, and NGC 7771) have such rings. Future dynamical models (G. C. Privon et al., in preparation) matched to the kinematics and morphology of NGC 34 and NGC 1614 may provide a more concrete answer to the question of how the two galaxies, and the two LIRG populations they represent, developed such different central starbursts over the merging process.
5. SUMMARY
We carried out ALMA observations of the CO (6–5) line emission and of the 435μm dust continuum emission in the central kiloparsec of NGC 1614, a local LIRG at distance of 67.8 Mpc (1 = 329 pc). The CO emission and the contin-uum are both well resolved by the ALMA beam (0.26×0.20) into a circumnuclear ring. The integrated flux of CO (6–5) is fCO(6–5) = 898 (±153) Jy km s−1, and the flux of the contin-uum is fCO(6–5) = 269 (±46)mJy. These are 63(±12)% and 32(±6)% of the total CO (6–5) flux and 435μm continuum flux of NGC 1614 measured by Herschel, respectively. The molecular ring, located between 100 pc < r < 350 pc, looks clumpy and includes several unresolved (or marginally resolved) knots with median velocity dispersion of δv ∼ 40 km s−1. These knots are associated with star formation regions with
ΣSFR∼100Myr−1kpc−2andΣGas∼104Mpc−2. The
non-detections of the nucleus in both the CO (6–5) and the 435μm continuum rule out, with relatively high confidence, a Compton-thick AGN in NGC 1614. Comparisons with the radio con-tinuum show that the local correlation, on the linear scale of ∼100 pc, betweenΣGas andΣSFR(i.e., the Kennicutt–Schmidt law) is severely disturbed. In particular, the nucleus has a lower limit of theΣSFR-to-ΣGasratio about an order of magnitude above the nominal value in the standard Kennicutt–Schmidt law. This breakdown of the star formation law could be caused by an out-ward propagation of the central starburst (i.e., the “wild fire” scenario proposed by Alonso-Herrero et al.2001). Our results also show that the CO (6–5) correlates stronger with the nonther-mal radio component than both the total radio emission and the thermal radio component, possibly due to an in situ correlation between the magnetic field strength and the gas density.
+
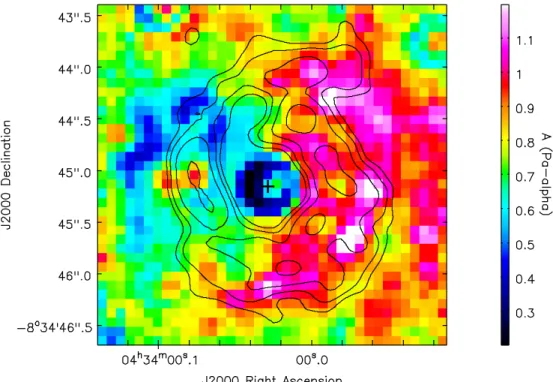
Figure 10.Extinction map in units ofAPa−α(mag) constructed based on the comparison between the observed NIR color F160W/F222M and that derived from Starburst99 models for the stellar population ages estimated from the Pa-αEW map. Contours of the CO (6–5) line emission are overlaid on the map.
under contract with the National Aeronautics and Space Administration.
APPENDIX
THERMAL/NONTHERMAL DECOMPOSITION
OF THE RADIO CONTINUUM
The thermal radio emission is estimated from an extinction-corrected Pa-αmap of the central region of NGC 1614 derived fromHSTNICMOS imaging data (Alonso-Herrero et al.2001) taken in four NIR continuum and emission line bands (F160W and F222M, and F187N and F190N, respectively). The maps are background-subtracted (D´ıaz-Santos et al.2008). The dust-attenuated Pa-α emission map was obtained from the F190N narrow-band line+continuum image after the subtraction of the adjacent continuum emission obtained with the F187N filter. In order to correct the Pa-αmap for the significant extinction (e.g., Neff et al.1990; Alonso-Herrero et al.2001; Kotilainen et al.2001; Rosenberg et al. 2012), we used the EW map of the emission line plus two broadband NIR continuum images obtained at 1.6 and 2.2 um.
First, we used Starburst99 (v7.0.0; Leitherer et al.1999) to generate a stellar population synthesis model for an instanta-neous burst of star formation with Geneva evolutionary stellar tracks, Kroupa initial mass function, and solar metallicity. The model outputs were obtained with a 0.1 Myr step for starburst ages ranging from 0.01 to 50 Myr. In addition to the spectral energy distribution (SED) of the continuum, the model also pro-vides the nebular emission from hydrogen recombination lines. Assuming that the extinction to the gas is similar to that toward the dust, the observed Pa-αEW map was compared to the model predictions to estimate the age of the young stellar population. We note that the ages are upper limits to the real ages since the presence of an older, underlying stellar population would increase the NIR continuum, thus aging the regions.
Once the ages of the stellar populations are estimated, we can compare the NIR continuum slope derived from the two continuum broadband filter images with the model SEDs to derive the obscuration. To this end, the Starburst99 spectra were convolved for each age step with the corresponding continuum filters. The synthetic NIR colors (F160W/F222M) were interpolated to the ages derived from the Pa-αEW map and compared with the observed values, and the extinction was estimated from this comparison. The dust attenuation law used to derive the extinction was that of Calzetti et al. (2000) for a foreground dust screen configuration. The resulting extinction map in units ofAPa−α(mag) is shown Figure 10. The typical
error ofAPa−α(mag) is 0.3 mag, estimated from the uncertainties
of the age and the color map. The strong east–west asymmetry in theAPa−α map is in agreement with that seen in the low-J
CO maps (Olsson et al.2010; K¨onig et al.2013), and is likely associated with a broad dust-lane extended from the north to the west of the ring (K¨onig et al.2013). Finally, the observed Pa-α image was corrected using the obscuration map obtained from this method. The extinction-corrected Pa-αemission was then scaled to obtain the thermal component of the radio emission at 8.4 GHz (see Equation (4) in Herrero-Illana et al.2014). The nonthermal component was then obtained by subtracting the thermal emission from the original radio map.
REFERENCES
Aalto, S., Garcia-Burillo, S., Muller, S., et al. 2012,A&A,537, A44 Albrecht, M., Kr¨ugel, E., & Chini, R. 2007,A&A,462, 575
Alonso-Herrero, A., Engelbracht, C. W., Rieke, M. J., et al. 2001,ApJ,546, 952 Armus, L., Heckman, T. M., & Miley, G. K. 1989,ApJ,347, 727
Armus, L., Heckman, T. M., & Miley, G. K. 1990,ApJ,364, 471 Armus, L., Mazzarella, J. M., Evans, A. S., et al. 2009,PASP,121, 599 Barnes, J., & Hernquist, L. 1996,ApJ,471, 115
Barnes, J. E. 1990,Natur,344, 379
Calzetti, D., Armus, L., Bohlin, R. C., et al. 2000,ApJ,533, 682 Casoli, F., Dupraz, C., Combes, F., & Kazes, I. 1991, A&A,251, 1 Cicone, C., Maiolino, R., Sturm, E., et al. 2014,A&A,562, A21
Comastri, A. 2004, in Supermassive Black Holes in the Distant Universe, ed. A. J. Barger (Astrophysics and Space Science Library, Vol. 308; Dordrecht: Kluwer),245
Combes, F. 1988, in NATO ASIC Proc. 232: Galactic and Extragalactic Star Formation, ed. R. E. Pudritz & M. Fich (Dordrecht: Kluwer),475 Condon, J. J., Huang, Z.-P., Yin, Q.-F., & Thuan, T. 1991,ApJ,378, 65 Costagliola, F., Aalto, S., Rodriguez, M. I., et al. 2011,A&A,528, A30 Cox, T. J., Jonsson, P., Somerville, R. S., Primack, J. R., & Dekel, A.
2008,MNRAS,384, 386
Daddi, E., Elbaz, D., Walter, F., et al. 2010,ApJL,714, 118 Dasyra, K. M., Tacconi, L. J., Davies, R. I., et al. 2006,ApJ,638, 745 D´ıaz-Santos, T., Alonso-Herrero, A., Colina, L., et al. 2008,ApJ,685, 211 Downes, D., & Solomon, P. M. 1998,ApJ,507, 615
Draine, B. T. 1980,ApJ,241, 1021 Draine, B. T., & Li, A. 2007,ApJ,657, 810
Drury, L. O., Aharonian, F. A., & Voelk, H. J. 1994, A&A,287, 959 Engelbracht, C. W., Rieke, G. H., Gordon, K. D., et al. 2008,ApJ,678, 804 Esquej, P., Alonso-Herrero, A., Perez-Garcia, A. M., et al. 2012,MNRAS,
423, 185
Evans, A. S., Mazzarella, J. M., Surace, J. A., & Sanders, D. B. 2002,ApJ, 580, 749
Faber, S. M., Willmer, C. N. A., Wolf, C., et al. 2007,ApJ,665, 265
Fernandez, X., Petric, A. O., Schweizer, F., & van Gorkom, J. H. 2014,AJ,147, 74
Feruglio, C., Maiolino, R., Piconcelli, E., et al. 2010,A&A,518, L155 Fiebig, D., & Guesten, R. 1989, A&A,214, 333
Fischer, J., Sturm, E., Gonz´alez-Alfonso, E., et al. 2010,A&A,518, L41 Gao, Y., Lo, K. Y., Lee, S.-W., & Lee, T.-H. 2001,ApJ,548, 172 Gao, Y., & Solomon, P. M. 1999,ApJL,512, L99
Gao, Y., & Solomon, P. M. 2004a,ApJS,152, 63 Gao, Y., & Solomon, P. M. 2004b,ApJ,606, 271
Garc´ıa-Burillo, S., Combes, F., Usero, A., et al. 2014,A&A,567, A125 Garc´ıa-Burillo, S., Usero, A., Alonso-Herrero, A., et al. 2012,A&A,539, A8 Genzel, R., Lutz, D., Sturm, E., et al. 1998,ApJ,498, 579
Genzel, R., Tacconi, L. J., Gracia-Carpio, J., et al. 2010,MNRAS,407, 2091 Genzel, R., Tacconi, L. J., Rigopoulou, D., Lutz, D., & Tecza, M. 2001,ApJ,
563, 527
Graci´a-Carpio, J., Garc´ıa-Burillo, S., Planesas, P., et al. 2008,A&A,479, 703 Griffin, M. J., Abergel, A., Abreu, A., et al. 2010,A&A,518, L3
Hailey-Dunsheath, S., Nikola, T., Stacey, G. J., et al. 2008,ApJL,689, L109 Heckman, T. M., Lehnert, M. D., Strickland, D. K., & Armus, L. 2000,ApJS,
129, 493
Helou, G., & Bicay, M. D. 1993,ApJ,415, 93
Herrero-Illana, R., P´erez-Torres, M. ´A., Alonso-Herrero, A., et al. 2014,ApJ, 786, 156
Hopkins, P. F. 2012,MNRAS,420, L8
Hopkins, P. F., Cox, T. J., Kere, D., & Hernquist, L. 2008,ApJS,75, 390 Hopkins, P. F., Cox, T. J., Younger, J. D., & Hernquist, L. 2009,ApJ,691, 1186 Hopkins, P. F., Kereˇs, D., Murray, N., et al. 2013,MNRAS,433, 78
Imanishi, M., & Nakanishi, K. 2013,AJ,146, 47
Iono, D., Ho, P. T. P., Yun, M. S., et al. 2004,ApJL,616, L63 Iono, D., Wilson, C. D., Yun, M. S., et al. 2009,ApJ,695, 1537 Kamenetzky, J., Glenn, J., Rangwala, N., et al. 2012,ApJ,753, 70 Kandalyan, R. A. 2003,A&A,398, 493
Kazandjian, M. V., Meijerink, R., Pelupessy, I., et al. 2012,A&A,542, A65 Kazandjian, M. V., Meijerink, R., Pelupessy, I., et al. 2014, arXiv:1403.7000 Kennicutt, R. C. 1998,ApJ,498, 541
Knapen, J. H., Whyte, L. F., de Blok, W. J. G., et al. 2004,A&A,423, 481 K¨onig, S., Aalto, S., Muller, S., Beswick, R. J., & Gallagher, J. S. 2013,A&A,
553, A72
Kotilainen, J. K., Reunanen, J., Laine, S., & Ryder, S. D. 2001,A&A,366, 439 Kruegel, E., Chini, R., & Steppe, H. 1990, A&A,229, 17
Leitherer, C., Schaerer, D., Goldader, J. D., et al. 1999,ApJS,123, 3 Leroy, A. K., Walter, F., Sandstrom, K., et al. 2013,AJ,146, 19 Lu, N., Zhao, Y., Xu, C. K., et al. 2014,ApJL,787, L23
Maiolino, R., Ruiz, M., Rieke, G. H., & Papadopoulos, P. 1997,ApJ,485, 552 Mazzuca, L. M., Sarzi, M., Knapen, J. H., et al. 2006,ApJL,649, L79 Meijerink, R., & Spaans, M. 2005,A&A,436, 397
Mihos, J. C., & Hernquist, L. 1994,ApJL,431, L9
Modjaz, M., Kewley, L., Bloom, J. S., et al. 2011,ApJL,731, L4 Murphy, E. J., Bremseth, J., Mason, B. S., et al. 2012,ApJ,761, 97 Naab, T., Jesseit, R., & Burkert, A. 2006,MNRAS,372, 839 Narayanan, D., Cox, T. J., Shirley, Y., et al. 2008,ApJ,684, 996
Neff, S. G., Hutchings, J. B., Standord, S. A., & Unger, S. W. 1990,AJ, 99, 1088
Niklas, S., & Beck, R. 1997, A&A,320, 54
Olsson, E., Aalto, S., Thomasson, M., & Beswick, R. 2010,A&A,513, A11 Onodera, S., Kuno, N., Tosaki, T., et al. 2010,ApJL,722, L127
Papadopoulos, P. P., & Seaquist, E. R. 1998,ApJ,492, 521
Papadopoulos, P. P., van der Werf, P. P., Xilouris, E. M., et al. 2012,MNRAS, 426, 2601
R´emy-Ruyer, A., Madden, S. C., Galliano, F., et al. 2014,A&A,563, A31 Risaliti, G., Gilli, R., Maiolino, R., & Salvati, M. 2000, A&A,357, 13 Rosenberg, M. J. F., Kazandjian, M. V., van der Werf, P. P., et al. 2014a,A&A,
564, A126
Rosenberg, M. J. F., Meijerink, R., Israel, F. P., et al. 2014b,A&A,568, 90 Rosenberg, M. J. F., van der Werf, P. P., & Israel, F. P. 2012, A&A,
540, A116
Rothberg, B., & Joseph, R. D. 2004,AJ,128, 2098 Rothberg, B., & Joseph, R. D. 2006,AJ,132, 976
Rupke, D. S., Veilleux, S., & Sanders, D. B. 2005,ApJS,160, 115 Sakamoto, K., Aalto, S., Costagliola, F., et al. 2013,ApJ,764, 42 Sakamoto, K., Aalto, S., Wilner, D. J., et al. 2009,ApJL,700, L104 Sakamoto, K., Wang, J., Wiedner, M. C., et al. 2008,ApJ,684, 957 Sanders, D. B., & Mirabel, I. F. 1996,ARA&A,34, 749
Sanders, D. B., Scoville, N. Z., & Soifer, B. T. 1991,ApJ,370, 158 Sanders, D. B., Soifer, B. T., Elias, J. H., et al. 1988,ApJ,325, 74 Schmitt, H. R., Calzetti, D., Armus, L., et al. 2006,ApJS,164, 52 Schweizer, F. 1982,ApJ,252, 455
Schweizer, F., & Seitzer, P. 2007,AJ,133, 2132
Scoville, N. Z., Evans, A. S., Thompson, R., et al. 2000,AJ,119, 991 Scoville, N. Z., Sanders, D. B., Sargent, A. I., et al. 1989,ApJL,345, L25 Scoville, N. Z., Yun, M. S., & Bryant, P. M. 1997,ApJ,484, 702 Soifer, B. T., Neugebauer, G., Matthews, K., et al. 2001,AJ,122, 1213 Solomon, P. M., Downes, D., & Radford, S. J. E. 1992,ApJL,387, L55 Solomon, P. M., Downes, D., Radford, S. J. E., & Barrett, J. W. 1997,ApJ,
478, 144
Solomon, P. M., & Sage, L. J. 1988,ApJ,334, 613
Stierwalt, S., Armus, L., Surace, J. A., et al. 2013,ApJS,206, 1 Sturm, E., Gonz´alez-Alfonso, E., Veilleux, S., et al. 2011,ApJL,733, 16 Surace, J. A., Sanders, D. B., Vacca, W. D., et al. 1998,ApJ,492, 116 Toomre, A. 1977, in Evolution of Galaxies and Stellar Populations, ed. B. M.
Tinsley, R. B. G. Larson, & D. Campbell (New Haven, CT: Yale University Observatory), 401
Tsai, M., Hwang, C.-Y., Matsushita, S., et al. 2012,ApJ,746, 129 U, V., Sanders, D. B., Mazzarella, J. M., et al. 2012,ApJS,203, 9 Vacca, W. D., & Conti, P. S. 1992,ApJ,401, 543
V¨ais¨anen, P., Rajpaul, V., Zijlstra, A. A., et al. 2012,MNRAS,420, 2209 Vall´ee, J. P. 1990, A&A,239, 57
Vall´ee, J. P. 1995,Ap&SS,234, 1
van der Tak, F. F. S., Black, J. H., Sch¨oier, F. L., et al. 2007,A&A,468, 627 van der Werf, P. P., Isaak, K. G., Meijerink, R., et al. 2010,A&A,518, L42 Veilleux, S., Kim, D.-C., & Sanders, D. B. 1999,ApJ,522, 113
Veilleux, S., Kim, D.-C., & Sanders, D. B. 2002,ApJS,143, 315 Veilleux, S., Melendez, M., Sturm, E., et al. 2013,ApJ,776, 27 Veilleux, S., Rupke, D. S. N., Kim, D.-C., et al. 2009,ApJS,182, 628 Walter, F., Weiss, A., & Scoville, N. 2002,ApJL,580, L21
Wang, J., Zhang, Q., Wang, Z., et al. 2004,ApJL,616, L67 Wilson, C. D., Petitpas, G. R., Iono, D., et al. 2008,ApJS,178, 189 Wootten, A., & Thompson, A. R. 2009,IEEEP,97, 1463
Xu, C. K., Cao, C., Lu, N., et al. 2014,ApJ,787, 48
![Figure 1. Upper left: image and contours of the integrated CO (6–5) line emission. The contour levels are [1, 2, 4, 8] × 2.7 Jy km s −1 beam −1](https://thumb-us.123doks.com/thumbv2/123dok_us/7972613.2116419/3.918.84.841.89.642/figure-upper-image-contours-integrated-emission-contour-levels.webp)