EM
POWER
ING ONTARIO
The Ontario Chamber of Commerce (OCC) is an independent, non-partisan business network. Our mission is to support economic growth in Ontario by advocating for pro-business policies
and defending business priorities at Queen’s Park.
For more than a century, the OCC has been providing our members with practical supports, advantageous network opportunities, and access to innovative insight and analysis.
We represent local chambers of commerce and boards of trade from communities across Ontario. Through this network, we are the voice of 60,000 members that range from small businesses to major corporations and industry associations. Together, our members employ
two million people and produce nearly 17 percent of Ontario’s GDP. The OCC is Ontario’s business advocate.
Visit us occ.ca
Follow us @OntarioCofC
Empowering Ontario: Constraining Costs and Staying Competitive in the Electricity Market Author: Andrea Holmes
ISBN Print: 978-1-928052-19-7 ISBN PDF: 978-1-928052-20-3
©2015 Ontario Chamber of Commerce
EM
POWER
ING ONTARIO
CONTENTS
Executive Summary Introduction
What We Did
Section 1: The Context
Section 2: The Recommendations
Recommendation 1 | Increase transparency of electricity pricing and system cost drivers
Recommendation 2 | Keep the Debt Retirement Charge on residential
bills until it has been retired
Recommendation 3 | Incentivize voluntary consolidation of local
distribution companies through multiple channels
Recommendation 4 | Move away from a central procurement model to a more competitive capacity market structure
Recommendation 5 | Unlock the power of smart meter data by capitalizing on data analytics at a province-wide level
Conclusion Sources 1 2 3 4 9 10 12 14 16 18 21 22
Successful
restructuring in
the electricity
system requires the
pursuit of economic
efficiency, but equal
attention must also
be paid to the politics,
the starting points,
and our neighbours.
OCC Energy Advisory Council
“
The price of electricity in Ontario is set to rise over the next two decades. In the time since the
Government of Ontario released its 2013 Long Term Energy Plan (LTEP), industrial electricity rates have
increased by 16 percent, and will increase a further
13 percent over the next five years.
This report comes at a pivotal moment. Our combined membership of 60,000 businesses are telling us that the high price of electricity is undermining their capacity to grow and hire new
workers. In the near future, the Government of
Ontario will be making several decisions that will have long-term impacts on electricity pricing in the province.
At the same time, the cost of doing business in Ontario continues to rise. The government is moving ahead with a number of initiatives that will directly affect business, including increases to the minimum wage and Workplace Safety and Insurance Board (WSIB) premiums, a review of the Labour Relations Act, an Ontario Retirement Pension Plan (ORPP),
and a cap-and-trade system. The introduction of any of these initiatives on its own would not necessarily be problematic, but when combined they will have
a profound net negative impact on the province’s
business climate.
In order to keep businesses in Ontario, the
government must reduce the cumulative regulatory burden. As part of this effort, it must ensure that electricity prices are competitive. This is not a simple
task. A number of organizations and groups are
championing solutions that they claim will address rising electricity prices and create system-wide cost savings. Some are grounded in evidence and principles. Others are wishful thinking.
The goal of this report is to inject research and
principle into the discourse on Ontario’s electricity
future, and to identify the initial steps that the
Government of Ontario can feasibly take to
constrain rising electricity costs. It is our intention that the report will be used as a tool to create a broader discussion on the future of the electricity system in the province.
Through consultation with our membership, sector experts, businesses, government ministries and agencies, and consumer groups, we examined ten commonly cited solutions to rising electricity rates.
The highest ranking options comprise our five final
recommendations:
1. Increase transparency of electricity pricing and system cost drivers
2. Keep the Debt Retirement Charge on residential
bills until it has been retired
3. Incentivize voluntary consolidation of local
distribution companies through multiple channels
4. Move away from a central procurement model to a more competitive capacity market structure
5. Unlock the power of smart meter data by capitalizing on meter data analytics at a
province-wide level
This report recognizes that there are multiple factors
driving energy costs in the province, some of which
are beyond government’s control. However, there
are viable options to ensure that our electricity costs are competitive and that the price of electricity enhances, not detracts from, our ability to compete globally and attract investment. When combined, the
OCC’s five recommendations will be a step in the
right direction.
The price of electricity directly influences the province’s ability to attract and retain businesses
and foster economic growth. In the past, the strength and reliability of the system and the low
price of electricity contributed to the province’s
competitive advantage. However, Ontario is no longer a low-cost electricity jurisdiction.
Rising electricity costs will continue to have an impact on employment and economic growth in the province. OCC survey results show that one in twenty businesses in the province expect to
close their doors in the next five years due to rising electricity prices. In addition, 38 percent will see
their bottom line shrink, with the cost of electricity delaying or canceling investment in the years to come. 1
The cost of doing business in Ontario is already high. The government has recently committed to moving forward with a cap-and-trade system and will join Quebec and California in the system under the Western Climate Initiative. The OCC is concerned that the combination of this cap-and-trade system, along with rising electricity prices and a number of other regulatory burdens on business, will further impede overall economic growth in the province.
As such, it is incumbent on the provincial
government to ensure that Ontario remains among the most attractive places in the world to do business. This includes maintaining competitive electricity rates when compared to our provincial and American neighbours.
In order to do so, the government and its energy agencies must address the reasons for rising electricity rates—growing system costs and the
Global Adjustment (GA). Recommendations
included in this report aim to address both of these cost drivers.
This report is divided into two sections. The first
section provides some context around the nature of rising electricity rates in the province and its impact
on business. Ontario’s advertised electricity rate—
the price before rebate and incentive programs are factored in—is one of the highest in North America. However, there is little common understanding of why our electricity rates have risen. In order to make meaningful changes to the system, it is critical that Ontarians have a better understanding of the cost-drivers behind electricity rate increases. The second section of the report evaluates a short-list of commonly cited solutions to high electricity rates based on a comprehensive set of guiding principles. The intent of this report is to ground
the heated discourse on the future of Ontario’s
electricity system in research and evidence, by taking certain proposals off the table and putting others into the spotlight.
iNtRODuctiON
iNtRODuctiON
What WE DiD
The year long research and consultative process for this report is unprecedented. Since June 2014, the
OCC has consulted over 100 businesses and stakeholders through focus groups, one-on-one interviews, and surveys. Throughout, our research was guided by the expertise of the OCC Energy Advisory Council. This Council is comprised of key actors from all regions and sectors, including energy, engineering, the broader public sector, academia, and small business.
The recommendations included in this report also reflect input from the OCC’s network of 160 local
chambers of commerce and boards of trade. The Chamber Network consistently reports that the price of
electricity is undermining their members’ capacity to grow and hire new workers. Due to these concerns, the OCC set out to answer a single, key question: What steps can the Government of Ontario take to
mitigate rising electricity costs facing business?
Based on policy resolutions put forth by local chambers/boards, the OCC and the Energy Advisory
Council have identified a number of options that attempt to answer this question. Each option was assessed in accordance with a set of guiding principles. Our findings are summarized in Figure 1.
An analysis of medium and low-potential options is included in a supplementary report available at occ.ca.
Figure 1: Options considered to mitigate rising electricity costs
high Potential
medium Potential
Low Potential
1. Increase transparency of electricity pricing and system cost drivers
2. Keep the Debt Retirement Charge
on residential bills until it has been retired
3. Incentivize voluntary consolidation
of local distribution companies through multiple channels 4. Move away from a central procurement model to a more competitive capacity market structure
5. Unlock the power of smart meter data by capitalizing on data analytics
at a province-wide level
6. Remove the provincial portion
of the Harmonized Sales Tax from
industrial electricity bills
7. Increase the peak-to-off-peak ratio under time-of-use pricing
8. Cancel Feed-in Tariff contracts 9. Negotiate a long-term supply
contract with Hydro Québec to replace nuclear generation 10. Mandate the consolidation
of Ontario’s local distribution
the Problem
Ontario’s advertised electricity rate—the price
before rebate and incentive programs are factored in—is one of the highest in North America
(Windeyer 2015). Electricity bills are only expected to rise in the future, with industrial customers’ bills forecast to increase by 13 percent over the next five years. The rates for households and small businesses are predicted to climb by 25 percent over the same period (IESO 2014b). Due to these
rising prices, in addition to other costs, there is there is a growing risk that investment will bypass Ontario for other jurisdictions.
Figure 2 provides a clear comparison of electricity prices by province and state. This figure illustrates
that Ontario has the highest industrial rates in North America.
Figure 2: 2013 comparison of industrial
Electricity Rates by Province and u.S.
State
Behind these rising electricity rates are
growing operating costs and a rising GA. From 2004 to 2015, revenue requirements for the electricity system rose by over 50 percent, from approximately $90 to $140 per megawatt hours
(MWh). With wholesale prices falling from $60
to about $25 per MWh, the GA has had to cover these losses (McKitrick and Adams 2014).
In 2013, electricity service cost the province $17.6 billion. The Independent Electricity System Operator (IESO) estimates the cost of electricity service will rise to approximately $20.2 billion by 2018 (2014a).
Figure 3: commodity cost of electricity
Source: Ontario Ministry of Energy
Quebec 4.64 Ontario, Class B 10.93 Midwest 3.77 Texas 4.19 British Columbia 5.00 New England 7.83 New York 8.10 Pennsylvania+ 5.18 New Brunswick 6.53 Manitoba 3.80 Alberta 8.94 Ontario, Class A* 9.02 cents/kWh^
Source: Association of Major Power Consumers of Ontario (AMPCO) Benchmarking Analysis. March 2013.
*transmission-connected, does not include distribution delivery charges + Pennsylvania-New Jersey-Maryland
Global adjustment
Regulatory mechanism makes up the difference between contracted costs and wholesale
revenues.
hourly ON Energy Price
Based on offers made by generators to sell electricity to the Ontario grid.
commodity cost
Based on the principle of full cost recovery.
+
=
0 2 4 6 8 10 2013 2014
What exactly is the Global adjustment?
Electricity customers in Ontario are charged for the total commodity cost, which includes the Hourly
Ontario Energy Price (HOEP) and the GA (see Figure 3), as well as for distribution, transmission, a tax called the Debt Retirement Charge (DRC), and wholesale market services (McKitrick and Adams 2014). However, rising system costs, for the most part, are passed onto customers through the GA
portion of their electricity bill.
The GA accounts for the difference between the
market price and the regulated contract price paid to generators, renewable power sources
(through FIT), and to some Ontario Power Generation (OPG) facilities (Spears 2014). It also
covers spending on conservation and demand management programs.
In 2013, 61 percent of the total cost of electricity
in Ontario was associated with the commodity
portion (HOEP and GA), and this portion has been increasing ever since. When the GA was first introduced in 2005, it was a net credit to consumers. Since then, the GA charge has
increased significantly as the market price dropped
and additional costs were added to the system.
In fact, the GA now exceeds the hourly market price. The GA has risen from approximately $10 per MWh in 2005 to about $60 per MWh today, or 6
cents per kilowatt hour (kWh). The entire industrial electricity rate in Ontario is approximately equal to
the current cost of the GA component of electricity bills (McKitrick and Adams 2014). For example, in April 2015 the average hourly price for electricity was 1.65 cents per kWh, while the GA was 9.56 cents per kWh (IESO 2015c).
The GA is problematic for businesses. As a flat rate applied to consumption that fluctuates
month-to-month, this mechanism limits the ability of many businesses to forecast monthly electricity costs and therefore budget for their consumption
appropriately (see Figure 4 for an example of GA monthly variations). This also distorts the efficacy
of conservation programs, since it does not send clear price signals to customers.
Figure 4: Global adjustment variations
2013-2014, Sample class B customer*
*distribution connected commercial customer located in Eastern Ontario In order to keep businesses in Ontario, the government and its energy agencies must take steps to curb this rising component of electricity bills and reduce system costs. But in order to do
so, we must first understand how we got here and
where we are going.
MEdiuM-SizEd BuSiNESSES ArE
BEAriNg ThE BruNT OF COSTS
In Ontario, medium-sized businesses have been stuck with paying the bulk of electricity system costs. These businesses often have energy demand below the three megawatt (MW) threshold of the Industrial Conservation Initiative (ICI) program and are also not included under the Regulated Price Plan and time-of-use pricing. As a result, they are left in the dark when it comes to their ability to reap significant cost savings from shifting their usage during peak periods.
While there are other programs offered by IESO and the Ministry of Energy that help businesses save money on electricity such as the retrofit and new construction programs, many medium-sized businesses lack the resources and energy management capacity to capitalize on these offerings.
Under the ICI program, there are two classes of electricity customers, Class A and Class B. Class A customers are industrial and commercial users with an average hourly peak demand of three MW or higher (recently lowered from five MW). Class A customers are required to pay a portion of the GA charged to all users depending on the proportion of electricity they consumed during Ontario’s five demand peak hours in the previous year. Class A customers can reap significant cost savings by shifting their demand to off-peak periods, thereby lowering and possibly eliminating their GA (Freitag, Vellone, and Bell 2013).
Class B customers, or those businesses or organizations with a peak demand of over 50 kilowatt (KW) but less than three MW, pay the bulk of the remaining GA costs as they are unable to lower their GA by shifting their energy demand. The more that Class A shift their usage, the higher the proportion of GA costs go to Class B customers. According to an AMPCO estimate, costs for Class B customers have risen substantially, moving from 9.19 cents per kWh in 2011 to 10.93 per kWh in 2013 (Association of Major Power Consumers of Ontario 2013).2
how Did We Get here?
Ontario’s electricity system is a lightning rod
for political debate, and the performance of the electricity sector is directly connected to the
province’s overall fiscal situation (Commission on the Reform of Ontario’s Public Services 2012). The government is both shareholder and
decision maker. As a result, decision-making in the electricity sector has historically been shaped by an effort to balance political objectives with reducing long-term electricity prices and building the health of the system.
Rising system costs and a growing GA have been driven by five factors. First, the provincial government announced in 2003 that it would phase out coal-fired generation by 2007—a target that was later extended to 2014. With the closure of the Thunder Bay Generating Station, Ontario became the first jurisdiction in North America to eliminate
this form of generation. Coal is among the least expensive sources of electricity generation, but it is
a significant contributor to climate change.
Second, the decision to phase out coal
necessitated investment in new and alternative sources of electricity generation. This included the decision to refurbish aging nuclear units and the addition of renewable energy sources, including wind, solar, and biomass. The province also placed additional focus on conservation and demand management programs, paid for exclusively by ratepayers, in order to decrease the need for new electricity capacity in the future.
Wind provided less than 4 percent of Ontario’s power in 2013 but accounted for 20 percent of the cost of electricity paid by Ontarians (McKitrick and Adams 2014).
Third, the addition of renewable energy resources under the Feed-in Tariff (FIT) program has contributed to overall system costs and driven the
GA upward by guaranteeing long-term and
above-market payouts to generators.
Fourth, massive and necessary investments were made in electricity distribution, transmission, and
generation in the 2000s to make up for a lack of investment over the preceding decades (Dewees 2012). Additional investments were also made by local distribution companies (LDCs) on the
installation of smart meters as a result of directives
from the Government of Ontario. In 2013, the
total costs incurred by the distribution sector to install these smart meters across the province had
reached $2 billion (Office of the Auditor General of Ontario 2013).
Fifth, the gap between power supply and demand has led to excess and costly electricity
capacity. From 2003 to 2014, Ontario’s energy demand dropped by 8 percent (IESO 2014a). This decrease reflects the decline in energy
intensive manufacturing activities and the growing prevalence of residential and commercial energy conservation.
As demand dropped, Ontario’s electricity
generation capacity increased by 14 percent.3 The
inability of long-term supply contracts and system
planning to respond to market fluctuations, lower
demand, and poor forecasting has left Ontario with a large surplus of excess electricity supply,
which it exports below-cost. Ontario’s electricity
consumption and peak demand will continue to fall
until at least 2021. The cost of excess contracting
and oversupply must be recovered by increases to
customers’ rates (Dewees 2012).4
Combined, these five factors have added significant costs to the system.
3 Based on independent Electricity System Operator (iESO), 18-Month Outlook, (September 24, 2003) and iESO, 18-Month Outlook update, (June 22, 2015) 4 A certain level of surplus generating capacity is necessary to meet periods of peak demand. in Ontario, this occurs in the summer.
Where are We Going?
There are a number of additional factors that will continue to put upward pressure on electricity costs in the province. Some decisions have already been made that will be factored into system costs in the next few years, such as the addition of renewables under the FIT program and an emphasis on conservation. However, in the near future, the
Government of Ontario and its energy agencies will
need to make several decisions that will have long-term impacts on electricity pricing.
Over the next five to ten years, renewable energy
production will add additional costs to the system.
Demand growth for electricity is expected to remain
modest and renewable power is often generated during off-peak hours. As a result, ratepayers will have to pay generators under FIT contracts
between $150 and $225 million per year not to generate electricity (Office of the Auditor General of Ontario 2011).
In addition, the Pickering Nuclear Generating Station will be retired and 10 units at the Darlington and Bruce Nuclear Generating Plants will be refurbished.
This will happen instead of moving forward with
costly new nuclear builds. The Darlington and Bruce Power refurbishment projects are estimated to cost $20 billion.
At the same time, LDCs will spend billions of dollars to upgrade their assets. Ontario’s electricity
distribution companies will need to invest $16.6 billion over the next twenty years to maintain their current networks, and make an additional investment of close to $4 billion to grow and serve new customers and meet system requirements
(Ontario Distribution Sector Review Panel 2012).
According to projections by the IESO,
refurbishments will contribute to annual supply
shortfalls starting in 2018 as reactors go offline, with a peak shortfall of 4,000 MW in 2022 (Rivard 2014). It will be important to maintain system
reliability throughout the refurbishment period. At the same time, existing contracts with generators representing about 7,000 MW of supply are also
set to expire (Rivard 2014).
Decisions will need to be made with respect to
the renewal of these contracts and the best way to address annual supply gaps. With demand for
electricity expected to remain flat, these costs will be socialized over a narrower base of customers. The competitiveness of Ontario’s electricity market
will receive some help from external sources.
Energy infrastructure in the United States is rapidly aging. U.S. utilities will be investing hundreds
of billions to replace and upgrade aging energy infrastructure over the next ten years. As these
investments are made, U.S. electricity prices will most likely rise (Walton 2015). The U.S.
government has also signaled the end of the use
of coal-fired generation nationwide, which has the potential to increase rates significantly. Affordable gas prices in the U.S. and Canada also provide an
opportunity for energy-intensive industries to thrive.
Ontario can capitalize on this momentum and
exploit the opportunities associated with increased natural gas consumption.
There are additional opportunities to mitigate price increases. Continued investment in nuclear generation assets will result in the best outcome
for Ontario’s economy, with up to 20 percent lower
electricity prices, 100,000 more jobs, $60 billion
in economic benefit and fewer greenhouse gas (GHG) emissions (Brouillette 2013). The provincial
government has committed to working with nuclear operators to ensure that the scheduled
refurbishment of nuclear units is optimized, and
done with cost predictability. Ontario has the ability to lower costs during the refurbishment schedule by reducing overlap and ensuring decisions
are made quickly, and by creating an efficient
procurement strategy for nuclear components.
Critical decisions are on the horizon and it is
imperative that government takes action to mitigate the impact of cost drivers in the electricity system.
The OCC assessed ten options based on their potential to impact businesses’ electricity bills and create cost savings system-wide. The following five recommendations reflect those options that received the most support within the OCC’s membership. An analysis of all options considered can be found at occ.ca.
the Guiding Principles
Throughout our consultation process, businesses and organizations identified and debated the pros and
cons of each option based on a set of guiding principles. These were:
1. Lower costs: Reducing electricity costs for industry and small businesses is a top priority.
Cost-savings can be realized either directly, through financial incentives or rebates, or indirectly, by
lowering system-wide costs. The most desirable options will lead to an overall decrease in rates and
mitigate cross-subsidization between rate classes.
2. Reliability: Businesses want to ensure that Ontario’s electricity grid provides a reliable supply of
power at all times, particularly during on-peak periods when load is highest.
3. Promote Ontario’s competitiveness: Electricity market policy has considerable downstream
effects on the province’s economy. As such, decisions must encourage investment, job creation, and
economic growth in the province.
4. Sustainability: A sustainable power system requires balance between environmental improvements,
economic impacts, and societal costs and benefits. It is important that options not put undue stress
on one area of the system in the name of rate mitigation. For example, while it is a lower-cost option,
returning to coal-fired generation is not a viable solution, given its environmental impacts.
5. Fiscal responsibility: Decisions to mitigate rates should not unduly burden the government’s
ability to meet its deficit elimination target of 2017-18. It is projected that in the 2015-16 fiscal year, the Government of Ontario will spend $8.5 billion more than it collects in revenue, increasing the province’s net debt to $298.9 billion. Eliminating the deficit and reducing the debt are top priorities for
the OCC.
6. Flexibility: There is an overarching concern about the future flexibility of the electricity system.
Long-term planning requires assumptions about future demand, supply, and resource costs. Ontario must
balance electricity demand with supply by ensuring the system has enough flexibility to respond to
changing market conditions.
7. Transparency: Ontario’s electricity system lacks cohesion and transparency, a product of political
objectives interfering with what makes economic sense. Despite the government’s best efforts,
customers are still confused as to why their electricity bills are so high, why certain decisions are
being made, and what exactly goes into the GA.
recommendation 1: increase
transparency of electricity pricing and
system cost drivers
how it would work
The IESO does not release average electricity prices nor does it conduct publicly available jurisdictional comparisons similar to those of Hydro-Québec.5 As well, many elements of the
electricity system, particularly the GA and the timelines surrounding the retirement of the Debt Retirement Charge (DRC) are not disclosed to
the public. This includes payments to generators to not generate, rates paid to historic non-utility generators, and costs for new hydro-electric
developments (McKitrick and Adams 2014). There
are concerns that similar issues will be prevalent throughout the sale of a portion of Hydro One. This lack of transparency has resulted in reduced
customer engagement and reduced confidence
in the electricity market and its actors. It has also
made it more difficult to pinpoint the exact drivers
of cost increases and the decisions that have led to Ontario having some of the highest electricity rates in North America.
The IESO should increase transparency of electricity pricing by publishing annual average
rates, in addition to that provided in the 2013 LTEP.
By increasing transparency across the system through disclosing rates and the costs of important investments in the electricity system, governments can be held accountable for past and future decision making (Electricity Authority, Te Mana
Hiko 2015).
Potential cost savings
By providing better information about the drivers of price increases, and the costs behind the rising
GA, government and its energy agencies can
improve customer engagement and foster greater public accountability. This will drive agencies and distribution companies to more effectively deliver what customers and businesses want.
how it stacks up
PROS
Transparency: The move to increased
transparency is in line with the current mandate
of the Government of Ontario. Government is committed to making information easier to find,
understand, and use, so that services and policies can be designed to better meet the needs of Ontarians.
Currently, a number of negotiations are taking place among actors in the electricity system. The outcomes of these decisions will directly impact prices. However, these processes are neither transparent nor made public. Increasing the transparency of such negotiations will help
incentivize government and energy agencies to
make principled and evidence-based decisions when entering into agreements with generators and other provinces.
Costs: Increasing transparency would not add
significant costs to the system.
Recommendations
?
$
CONS
Costs: Increased transparency does not directly reduce costs. Most industrial consumers pay different rates and energy consumption varies
within rate classes. Posted or advertised rates
often do not include important aspects of a
customer’s bill. Therefore, it may be difficult for the
IESO to aggregate the rates of certain segments of the ratepayer population and share it publicly.
the verdict
Providing transparency to ratepayers on what is
driving the cost of electricity in Ontario will allow for a better understanding of the true price of electricity in the province. This will, in turn, facilitate smart public policy choices moving forward.
Beyond transparency: making information
digestible for business
Currently, the Government of Ontario and IESO
offer a number of price mitigation and conservation programs to large industrial and small-to
medium-sized businesses to help them save money on
their electricity bills. These include the Industrial Conservation Initiative (ICI), the Industrial Electricity Incentive (IEI) program, the Industrial
Accelerator Program, saveONenergy for business program, and the Enbridge and Union Gas
Conservation business programs.
However, many businesses are unaware of these programs.
It is important that the Government of Ontario
do a better job in helping business access these programs. This includes reducing the transaction costs for businesses when it comes to making energy-related investment decisions through greater promotion of roaming energy managers and regional information sessions in partnership
with LDCs and chambers of commerce and
boards of trade. Moving forward, the provincial government and its agencies should work closely with the OCC to increase the communication of these programs in order to help businesses succeed.
recommendation 2: Keep the debt
retirement Charge on residential bills
until it has been retired
how it would work
The DRC has appeared on electricity bills since May 1, 2002 to help pay down the debt and
liabilities of Ontario Hydro after it was broken up
into separate companies. As of March 2014, the
residential stranded debt is estimated to stand at
$7.8 billion. The rate is established at 0.7 cents
per kWh for electricity consumed for most Ontario
communities (Ontario Ministry of Finance 2015). On April 23, 2014, the Government of Ontario announced that it would remove the DRC from residential customers’ electricity bills after December 31, 2015. This would save a typical
residential ratepayer about $70 per year (Ontario
Ministry of Finance 2015). The DRC is to remain on all other electricity users’ bills, including large
industrial users, until the residual stranded debt is retired. However, the forecasted end date of the
DRC is not transparent and varies from the end of 2017 to 2018 (see recommendation one). The actual end will largely depend on, “the size of the dedicated revenue streams from OPG, Hydro One, and LDCs (payments in lieu of taxes)”, and could take longer (Aegent Energy Advisors Inc. 2014).
In order to keep debt payment on target to end in
2017-18 and to spread the burden of costs, the DRC should remain on residential bills.
Since the DRC is calculated based on electricity
consumption, the impact of this additional charge on business is considerable. Many argue that
the province would be better off financially and economically if it removed the DRC from industrial
electricity bills rather than residential. Although government has stated there will be no
cross-subsidization by industry to pay for the elimination of the DRC on residential bills, it is unlikely that
industry will not incur higher, or more drawn out, costs as a result of this policy change.
Potential cost savings
By keeping the DRC on residential bills, business
will not be forced to bear the full brunt of the costs, and a cost reduction on bills will still take place for all customers. This is particularly important as the regulatory burden on business grows with the
introduction of the ORPP and the cap-and-trade
system.
Since it is estimated that the DRC will be retired by 2017-18 without residential contributions, it is likely
that it could be paid off more quickly, and in a more equitable fashion, if spread across all customers.
Recommendations
?
how it stacks up
PROS
Costs: Remaining commercial customers could
possibly see a reduction in the DRC charge on
their electricity bills.
Fairness: Sharing the burden of the DRC
between residential and non-residential electricity
consumers will reduce cross-subsidization and
potentially eliminate the charge more quickly.
Competitiveness: This move would send a positive signal to the business community, whose growth and productivity is currently hindered by the regulatory and high-cost climate that provincial governments have created in the province.
CONS
Costs: Residential customers would no longer
see the entirety of the DRC removed from their electricity bills in 2016.
the verdict
Sharing the burden across residential, small business, and industrial electricity bills makes good sense: the debt could be paid off more quickly if spread across a larger customer base, with less
recommendation 3: incentivize voluntary
consolidation of local distribution
companies through multiple channels
how it would work
The proposed merger of Hydro One Brampton
with Enersource Corporation, Horizon Utilities, and Powerstream Inc. represents a major step forward in catalyzing LDC consolidation in Ontario (Premier’s Advisory Council on Government Assets 2015). However, it is only the first step. Government should capitalize on the momentum of
that transaction to provide for further consolidation in the sector for an expanded window of time, while removing additional barriers to private sector investment in the distribution sector.
There is a need for faster consolidation among
LDCs in Ontario’s electricity system and an increased level of private sector capital. Ontario’s LDC sector has 73 rate-regulated companies,
almost twice as many as all of the other provinces
combined (Elston, Laughren, and McFadden 2012). This has led to extensive and expensive
asset duplication, and in practice, “more facilities and distribution equipment in Ontario than are
needed to efficiently serve electricity customers” (Horizon Utilities 2014; Ontario Distribution Review Panel 2012, 15).
Despite rising costs, Ontario’s electricity
distribution sector has been slow to embrace private investment. This is partly due to current
regulations that restrict LDC access to capital. For
example, until recently, the tax regime impeded private sector investment and private mergers and acquisitions in three different ways.
First, since most LDCs are municipally owned,
they are exempt from payment of income tax under the federal Income Tax Act. Any private sector
equity investment in a municipally-owned LDC that
exceeds 10 percent share ownership will
cause that LDC to lose its tax exemption status (Electricity Distributors Association 2012).
Second, under the provincial Electricity Act, the
Ontario Government requires municipally-owned LDCs to make payments in lieu of corporate
taxes for the purposes of paying down stranded debt associated with Ontario Hydro (Clark and
Vitrorovich 2006). Under this regime, LDCs face a “departure” tax as well as a proxy tax if it is exempt
from tax under both the federal Income Tax Act
and the Ontario Corporations Tax Act for a taxation year.
Third, when electricity distribution assets or shares are sold, such a transfer is subject to a
“transfer tax” equal to 33 percent of the fair market
value of such assets or shares, resulting in a substantial barrier to such transactions (Clark and
Ramkrishnan 2013).
More recently, changes have been made to reduce these barriers to consolidation and investment. On
the advice of the Premier’s Advisory Council on Government Assets, the Minister of Finance put aggressive tax incentives in the 2015 budget to
incent local utility consolidation:
• Reduction in the transfer tax for three
years—down to 22 percent from 33 percent for three years (until 2019), with
full transfer tax exemption for local utilities
with less than 30,000 customers; and • Removal of the capital gains portion of the
Departure Tax for three years (until 2019).
Recommendations
By freezing the transfer tax, government recognizes the importance of encouraging voluntary mergers among LDCs to create
economies of scale.
However, government should go further. This can
be done by eliminating the 33 percent transfer tax for a period of five years and working with
the federal government to allow municipally-held electrical utilities to remain tax exempt with as
much as 49 percent private ownership (Electricity Distributors Association 2012).
Potential cost savings
Increasing levels of private sector investment in
the distribution sector will help LDCs provide new
customer services without putting the brunt of the costs onto consumers.
To mitigate the impact on provincial revenues,
the Government of Ontario and the Government
of Canada should create a cooperative tax arrangement that returns to the province any
federal corporate taxes paid by newly privatized
utilities. There is precedent for such co-operation as illustrated by the previous federal Public Utilities Income Tax Transfer Act (Commission on the
Reform of Ontario’s Public Services 2012).
how it stacks up
PROS
Reliability: Changing the tax regime could increase the level of reliable investment in the aging distribution sector. This could include investment from Ontario pension fund groups. Over the years, there has been the possibility of
pension fund investment in the LDC component of
the distribution sector. However, while a pension fund is a tax-exempt entity, its potential investment in a local distributor would face the same transfer tax and departure tax restrictions the private sector
faces (Fyfe, Garner, and Vegh 2013).
As a result, pension plans generally have been
deterred from making any significant investments or purchasing shares of LDCs (Fyfe, Garner, and Vegh 2013).
Fiscal Responsibility: Smaller LDCs generally
have less access to capital than large LDCs
and are typically charged higher interest rates
and financing charges; costs they pass on to customers. By allowing smaller LDCs to turn to private finance, the Government of Ontario can reduce, rather than add to, the province’s debt load through Infrastructure Ontario’s concessionary-rate loans (Kishewitsch and Brooks 2013).
CONS
There is little downside to this option if the province and the federal government can negotiate a cooperative tax arrangement.
the verdict
Removing barriers to consolidation, such as the departure and transfer tax, for a longer period of time will increase economies of scale in the
distribution sector and access to capital. If LDCs
are provided more options to raise capital, this will also increase the levels of capital infusion into the industry as a whole. This could also, in turn, later translate into greater consolidation.
recommendation 4: Move away from a
central procurement model to a more
competitive capacity market structure
how it would work
Ontario’s ‘hybrid’ electricity market has relied heavily on financing electricity generation
investment rather than market-oriented solutions, which provide price signals to generators. Ontario does not have an explicit mechanism to meet future capacity requirements, instead relying on a mixture of existing resources, government policies
(Long-Term Energy Plan), and central and
long-term procurement through the IESO (formerly
OPA).
The IESO is currently examining the introduction of a new capacity market structure that will include capacity auctions. Capacity auctions already exist
in the U.S. in New York, New England, and the Midwest, as well as PJM, the regional transmission organization which serves all or part of 13 states
between Illinois and New Jersey.
A capacity market is used to ensure that the availability of electricity generation increases in correlation with demand. The success of a capacity market is dependent on the capacity auction process, the competitive procurement mechanism whereby resources—such as generation facilities, imported resources, electricity storage, and demand-side resources—are compensated for capacity that they provide at some point in the
future. Under this market structure, the IESO will
hold capacity auctions based on future capacity
targets, and choose resources to fulfill these
obligations based on lowest operating costs
(Goulding 2013).
As a result, different resources (e.g., generation by fuel types, demand-response, emerging technologies, clean imports, etc.) will ostensibly be treated the same within a single procurement
process (Rivard 2014). The first capacity auction is scheduled for 2018.
Potential cost savings
Capacity auctions will result in procuring the least cost resources to meet future electricity needs. Shorter-term contracting will also reduce the risk of
oversupply and could lead to lower GA charges.
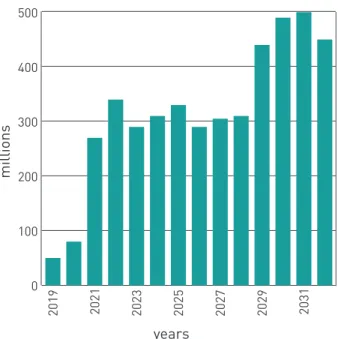
Figure 5: Potential cost Savings from
introducing capacity market in Ontario
Source: independent Electricity System Operator. 2015 0 100 200 300 400 500
Recommendations
years millions?
$
how it stacks up
PROS
Flexibility: Capacity auctions could give the
province additional planning flexibility, allowing
it to adjust to unforeseen changes in demand and supply conditions, while also encouraging innovation and respecting current contracts (Rivard
2014).
Costs: This flexibility can be translated into lower
costs:
• By directing investment a few years ahead of when electricity is to be delivered, suppliers will be provided with long-term price signals, possibly decreasing the
number of new builds (Goulding 2013). • Capacity auctions have the potential
to tap into unused capacity at existing
generators, benefitting consumers through the more efficient use of existing resources (Wyman 2014).
• Procuring for a shorter time frame
could reduce the possibility of incorrect projections leading to power surplus or
deficits. The longer the timeframe for
planning, the greater the possibility for
incorrect assumptions (Goulding 2013).
CONS
Transparency: A successful capacity market will require balancing the priorities of government with the objectives of creating a more competitive, open market. Criticism of the current procurement process as it has operated in Ontario is that there has been regular and direct government intervention in system planning that has led to less than ideal decision-making.
Fairness: Since cost is the defining criterion
for selecting resources, more expensive, clean sources of generation will be uncompetitive. The question is how the IESO will meet government objectives on climate change without forfeiting the competitiveness and transparency of the capacity market structure.
Ontario’s Competitiveness: Other components of the current system could hinder the success of capacity auctions:
• Shorter-term contracts could pose
difficulties for new resources and suppliers who wish to secure financing.
• Lower costs in jurisdictions in the Northeast United States have been
accrued from new, low cost resources
replacing conventional (Goulding 2013).
However, the IESO has communicated that only those generators under contract will
be able to participate in Ontario’s capacity
auctions. Therefore, new, innovative resource will not be able to compete on
a level playing field (Ministry of Energy 2015).
the verdict
The implementation of a capacity market has the
potential to create significant cost-savings for Ontario’s electricity system by procuring supply on a shorter-term, more cost efficient basis. However, the devil will be in the details. Ontario’s electricity
market system differs substantially from other jurisdictions that have implemented a capacity market approach.
recommendation 5: unlock the power of
smart meter data by capitalizing on data
analytics at a province-wide level
how it would work
Ontario’s investment in smart grid technology is world leading. Over the last five years, smart
meters have been implemented in almost every small business and home across the province, providing millions of data points to utilities daily
(Briones 2012). However, this investment has also
been costly for customers.
There is an opportunity for the province and LDCs to enhance the way they currently store, analyze,
and access the data generated from the smart grid, and improve the way in which investments are currently being made in the system. Ontario can become leaders in data management infrastructure by adopting a province-wide central data access platform.
Currently, energy consumption data from the smart
grid is stored and processed by Ontario’s central Meter Data Management and Repository (MDM/R),
which helps utilities deal with high data volumes and computes how much electricity is used during
TOU periods. However, a province-wide MDM/R system that offers accessible and standardized
meter data to utilities, customers, policy makers, and third party analytics providers is still in
development (IESO 2015d).
Potential cost savings
The benefits of a province-wide data platform can be realized through improved customer
segmentation, asset and grid maintenance, and more evidence-based demand forecasting and
policy-making. These benefits can be realized
by integrating current meter data with additional data sets, including data on weather and location. This data can then be used in areas such as job creation, economic growth, trade, and innovation
(Briones 2012).
Improving access to data will enable greater analysis—particularly from third party vendors— as well as better customer products. Smart grid data analytics “promises a solution for utilities to improve their meter data system performance while
maximizing the business value of consumption data by analyzing the data emitted by smart meters” (Briones 2012, 12). This can be done while
respecting the ownership of that data.
By combining analytics with utilities’ energy
delivery models, local distributors can also predict how assets are affected during peak periods of demand and perform preventative maintenance. This could lead to less unplanned outages and
where assets are consistently under-utilized,
expensive maintenance can be delayed and costs can be avoided.
Recommendations
how it stacks up
PROS
Ontario’s Competitiveness: The disclosure of smart meter data will become an important policy lever for better decision-making at the provincial level in regards to economic and energy policy.
Leveraging the MDM market will enable utilities
to come up with solutions for growing demand through better analytics, while also opening up a larger market for third party analytics solution providers.
As well, Ontario businesses can benefit from insight into the specific technological needs
of utilities and be made aware of business
opportunities (Briones 2012). This could lead
to further innovation and adoption of new
technologies, as well as the formation of Analytics Centres of Excellence.
Costs: Implementing a province-wide approach to data analytics would require little additional investment in hardware. Analytics solutions can reside unobtrusively above current data sources and assets, allowing existing architecture to suffer minimal re-working. The outputs can be fed back
into the existing system to further refine results.
Flexibility: From past work, similar practices were also able to improve demand forecast accuracy for customers and the system at-large. The automation of data solutions surrounding forecasting can also reduce the chances of human error and could result in greater accuracy in forecasting.
CONS
Current energy forecasters and utilities may need
to be trained on how to utilize this new information to reap the most benefits for customers.
the verdict
As of 2013, the Government of Ontario has invested $2 billion in smart grid technology (Office of the Auditor General of Ontario 2013). However,
it is not being used to its full potential. By creating one province-wide data platform that collects,
stores, and analyzes data points from across
regions and distribution networks, the province can better address system needs while using an
Ontario businesses are
feeling the pinch when
it comes to electricity
prices. constraining
costs will go a long way
in keeping Ontario’s
economy competitive.
Allan O’Dette, President & CEO, Ontario Chamber of Commerce
“
CONCluSiON
The price of electricity is a major factor in the overall cost of doing business for many companies. As
such, it is also a critical component of a jurisdiction’s competitiveness in the global economy. Jurisdictions
with high electricity prices are at a disadvantage when it comes to creating jobs and attracting investment. Ontario no longer offers low-cost electricity for the business community. In fact, costs are rising. That
is why the OCC set out to evaluate what initial steps the Government of Ontario can feasibly take to
constrain these rising electricity costs. The resulting recommendations are not a panacea. However, when combined, they are a long-term and incremental step in the right direction.
The business climate in Ontario is in flux, largely because of the cumulative regulatory burden that has arisen as a result of new initiatives from the provincial government. Over the past year, the Government of
Ontario has implemented or announced several initiatives that have a direct impact on business, including
increases to minimum wage, a review of the Labour Relations Act, the ORPP, and a cap-and-trade
system.
The combined outcomes of these initiatives will alter Ontario’s business case vis-à-vis the world. It is
incumbent upon government to do what it can to ensure that Ontario remains among the most attractive places in the world to live and do business. And that includes bending the projected cost curve in electricity.
Aegent Energy Advisors inc.. 2014. Ontario Election 2014: Electricity Promises. Website. http://www.aegent.ca/newsletters/ ElectionElectricityPromises.html
Aloy-Chee, Jason. 2014. Examining the Future Structure of Ontario’s Electricity Market: Should Ontario incorporate a Capacity Market or Alternative Structure Framework? Ontario Power Conference. Presentation, April 15. http://www.poweradvisoryllc.com/wp-content/ uploads/2014/04/Chee-Aloy_Capacity-Markets_Ontario-Power_ April-1514.pdf
Angevine, gerry and Kenneth P. green. 2014. Paying More for Power: Electricity Costs in the uS and Canada. The Fraser institute. http://www. fraserinstitute.org/uploadedFiles/fraser-ca/Content/research-news/ research/publications/paying-more-for-power-rev.pdf
Angevine, gerry and dara hrytzak-lieffers. 2007. Ontario industrial Electricity demand responsiveness to Price. The Fraser institute. file:/// users/andreaholmes/downloads/OntarioElectricitydemand%20(1).pdf Association of Major Power Consumers of Ontario (AMPCO). 2013. Benchmarking Analysis. http://www.ampco.org/index.cfm?id=36556 Briones, Jesika. 2012. The Market impact of Accessible Energy data. MarS Market intelligence / Clean Energy institute. http://www.marsdd. com/wp-content/uploads/2012/10/Accessible-Energy_report_2012.pdf Brouillette, Marc. 2013. Ontario Electricity Options Comparison: illustrating the Economics of Ontario Energy Supply Options. Strapolec. http://www.candu.com/site/media/Parent/Ontario%20Electricity%20 Options%20Comparison%20Final%20062413.pdf
Clark, ron W. and Aisha ramkrishnan. 2013. The electricity
distribution sector in Ontario: the slow road to consolidation. Financier Worldwide. Special report: Energy & Natural resources. http://www. financierworldwide.com/the-electricity-distribution-sector-in-ontario-the-slow-road-to-consolidation/#.VNO10WTuc7s
Clark, ron W. and Sandra Viorovich. The Parallel universe: Transfer Tax under Ontario’s Electricity Act. http://www.airdberlis.com/Templates/ Articles/ArticleEdit.aspx?Articleid=585&page=0
Commission on the reform of Ontario’s Public Services (drummond report). 2012. Public Services for Ontarians: A Path to Sustainability and Excellence. Toronto: Queen’s Printer for Ontario.
dewees, donald N.. 2012. What is happening to Ontario Electricity Prices?. Sustainable Prosperity. www.sustainableprosperity.ca
Electricity Authority, Te Mana hiko. 2015. improving transparency of consumers’ electricity charges: decisions and reasons. government of New zealand.
Electricity distributors Association. 2012. The Power to deliver: A Six Point Plan for the Future of Electricity distribution in Ontario. https:// secure2.eda-on.ca/imis15/eda/EdA_Priorities/EdA_reports/Sector_ review/The_Power_to_deliver.aspx
Freitag, Shane, John Vellone, and Whitney Bell. 2013. Ontario’s global Adjustment: A Tale of Two Classes. Borden ladner gervais llP. Electricity Markets group Bulletin. http://www.blg.com/en/ NewsAndPublications/documents/Publication_3325.pdf
Fyfe, Stephen, Mark garner, and george Vegh. 2013. Mergers by Choice, Not Edict: reforming Ontario’s Electricity distribution Policy. C.d. howe institute. http://www.cdhowe.org/pdf/Commentary_376.pdf
goulding, A.J. 2013. A New Blueprint for Ontario’s
Electricity Market. C.d. howe institute. http://www.cdhowe.org/pdf/ Commentary_389.pdf
government of Ontario. Ministry of Energy. 2013. Achieving Balance: Ontario’s long-Term Energy Plan. http://www.powerauthority.on.ca/sites/ default/files/planning/lTEP_2013_English_WEB.pdf
hooper, liz, Paul Twomey, and david Newbery. 2009. Transparency and Confidentiality in Competitive Electricity Markets. u.S. Agency for international development, National Association of regulatory utility Commissioners. http://pdf.usaid.gov/pdf_docs/PNAdQ695.pdf horizon utilities. 2014. What’s going on with ldC Consolidation? – Four directions and an Election. Presentation to Annual Ontario Power Summit. May 29.http://www.horizonutilities.com/ourCompany/ publications/documents/2014/horizon-Ontario-Power-Summit.pdf independent Electricity System Operator. 2015a. demand response dr3. Website. https://saveonenergy.ca/Business/Program-Overviews/ demand-response/demand-response-3.aspx
independent Electricity System Operator. 2015b. Electricity Pricing in Ontario. Website. http://www.ieso.ca/Pages/Ontario’s-Power-System/ Electricity-Pricing-in-Ontario/default.aspxCost.pdf
independent Electricity System Operator. 2015c. Price Overview. http:// www.smi-ieso.ca/pages/power-data-price.aspx
independent Electricity System Operator. 2015d. Smart Metering Entity: MdM/r. http://www.smi-ieso.ca/mdmr
independent Electricity System Operator (iESO). 2014a. demand Forecast, 2013 lTEP: Module 1. PowerPoint.
independent Electricity System Operator (iESO). 2014b. Cost of Electricity Service, 2013 lTEP: Module 4. PowerPoint.
independent Electricity System Operator. 2014b. Meeting System Needs with demand response. Presentation to Ontario Chamber of Commerce. dec. 2.
Kishewitsch, Stephen and Jake Brooks. 2013. distribution under debate: Proposals for ldC reform raise hopes and hackles. Association of Power Producers of Ontario. http://magazine.appro.org/index.php?option=com_ content&task=view&id=2280&itemid=44
McKitrick, ross and Tom Adams. 2014. What goes up…Ontario’s Soaring Electricity Prices and how to get Them down. The Fraser institute. http:// www.fraserinstitute.org/research-news/display.aspx?id=21912
rivard, Brian. 2014. how Capacity Markets Can Provide reliability, Transparency, and drive down Costs. independent Electricity System Operator. Ontario Power Conference. Presentation, April 15. http://www. ieso.ca/documents/media/Brivard_OPC_April2014.pdf
Office of the Auditor general of Ontario. 2013. Chapter 3: Smart Metering initiative. Annual report. http://www.auditor.on.ca/en/reports_en/ en14/311en14.pdf
Office of the Auditor general of Ontario. 2011. Chapter 3: Electricity Sector – renewable Energy initiatives. Annual report. http://www.auditor. on.ca/audit/reports_en/en11/303en11.pdf
Ontario distribution Sector review Panel (Elston report). 2012. renewing Ontario’s Electricity distribution Sector: Putting the Consumer First. Toronto: Queen’s Printer for Ontario. http://www.energy.gov.on.ca/en/ files/2014/09/ldC_en.pdf
Ontario Ministry of Finance. 2015. debt retirement Charge (drC). government of Ontario. http://www.fin.gov.on.ca/en/tax/drc/ Premier’s Advisory Council on government Assets. 2015. Striking the right Balance: improving Performance and unlocking Value in the Electricity Sector in Ontario. http://www.ontario.ca/government/ premiers-advisory-council-government-assets
Spears, John. 2014. Ontario’s big industries plead for lower hydro rates. http://www.thestar.com/business/2014/02/26/ontarios_big_industries_ plead_for_lower_hydro_rates.html
Walton, robert. 2015. Why utilities are rushing to replace and modernize the aging grid. utility drive News. http://www.utilitydive.com/news/why-utilities-are-rushing-to-replace-and-modernize-the-aging-grid/361922/ Windeyer, Chris. 2015. Electric Fence: Miners say power costs limiting investment in the province. Canadian institute of Mining, Metallurgy and Petroleum. Special report: Ontario, March/April. https://magazine.cim. org/en/2015/March-April/special-report/Electric-fence.aspx
Wyman, Michael. 2014. how Ontario Electricity Consumers Can Win from Market reform. C.d. howe institute. http://www.cdhowe.org/rethinking-ontarios-electricity-system-with-consumers-in-mind/27420
Wyman, Michael. 2008. Power Failure: Addressing the Causes of underinvestment, inefficiency, and governance Problems in Ontario’s Electricity Sector. C.d. howe institute. http://www.cdhowe.org/pdf/ commentary_261.pdf