Mapping Question Items to Skills with
Non-negative Matrix Factorization
Michel C. Desmarais
Polytechnique Montr ´eal [email protected]
ABSTRACT
Intelligent learning environments need to assess the student skills to tailor course material, provide helpful hints, and in general provide some kind of personalized interaction. To perform this assessment, question items, exercises, and tasks are presented to the student. This assessment relies on a mapping of tasks to skills. However, the process of deciding which skills are involved in a given task is tedious and chal-lenging. Means to automate it are highly desirable, even if only partial automation that provides supportive tools can be achieved. A recent technique based on Non-negative Matrix Factorization (NMF) was shown to offer valuable results, especially due to the fact that the resulting factor-ization allows a straightforward interpretation in terms of a Q-matrix. We investigate the factors and assumptions under which NMF can effectively derive the underlying high level skills behind assessment results. We demonstrate the use of different techniques to analyze and interpret the output of NMF. We propose a simple model to generate simulated data and to provide lower and upper bounds for quantifying skill effect. Using the simulated data, we show that, under the assumption of independent skills, the NMF technique is highly effective in deriving the Q-matrix. However, the NMF performance degrades under different ratios of vari-ance between subject performvari-ance, item difficulty, and skill mastery. The results corroborates conclusions from previ-ous work in that high level skills, corresponding to general topics like World History and Biology, seem to have no sub-stantial effect on test performance, whereas other topics like Mathematics and French do. The analysis and visualization techniques of the NMF output, along with the simulation approach presented in this paper, should be useful for fu-ture investigations using NMF for Q-matrix induction from data1.
1.
INTRODUCTION
Skills determine the outcome of an individual over a given task, namely whether the individual’s task result will be a success or a failure. A task can be a question item, an ex-ercise, or any challenge that will require some skills. This mapping of skills to tasks, or items, is a fundamental re-quirements for intelligent learning environments, since the 1
This article is a revised version of [7] published in the Pro-ceedings of the Educational Data Mining Conference, 2011.
goal of these environments is to bring the learner to a tar-get level of mastery over a set of skills. This goal relies on such mapping to assess the student’s mastery level, and to decide which are the most appropriate exercises given this assessment. In the field of Educational data mining [2], this mapping is referred to as a Q-matrix.
Determining which skills are involved in a task can prove both tedious and difficult. The construction of a Q-matrix from data is a highly desirable goal for tutoring systems. Not only would it waive the expertise and labour intensive task of assigning which skills are involved in which task, but it would also offer a more objective and replicable means of getting the correct skill-to-task mapping. Furthermore, it might also allow a more effective means to build Q-matrices, as machine learning methods often outperform humans over a range of complex tasks.
However, the success in achieving this goal remains limited. Nowadays, we find no reliable method to automate the map-ping of skills to tasks from data, but some progress has been made.
Working with log data from tutoring systems, data which is characterized by the fact that the knowledge state of the stu-dent dynamically changes in the data as the stustu-dent learns, Cen et al. [6, 5] have used a technique known as Learn-ing Factor Analysis (LFA) in order to brLearn-ing improvements over an initially hand built Q-matrix (also termed atransfer model). This technique was shown useful for bringing im-provements to the Q-matrix composed of fine-grained skills which are deemed necessary to complete certain exercises. Barnes [3] developed a method of mapping skills to items based on a measure of the fit of a potential Q-matrix to the data. This method is inspired from the work of Tatsuoka [12]. It relies on static student knowledge states, as opposed to the dynamically changing knowledge states of the LFA technique. The methods described in this article also rely on static knowledge states. Barnes’ method is fully automated and it was shown to perform at least as well as Principal Component Analysis for skill clustering analysis. However, it involves an algorithm that does not scale well to a Q-matrix that comprises 20 or more items.
Winters et al. [13] investigated how a number of standard clustering techniques can effectively match skills to test items. They applied these techniques to a wide array of test out-comes, from SAT topics such as Mathematics, Biology and French, to computer science exams, and to different trivia topics. Their findings show that for skills associated to top-ics within a single course, for example, the techniques were essentially no better at classifying test items than random
clustering. The same conclusion applies for topics like World history and Biology. However, the techniques were relatively successful at separating items that belongs to totally differ-ent topics, such as Mathematics and French.
In this paper, we replicate parts of the study by Winters et al. [13] and focus on one of the cluster algorithms they used, Non-negative Matrix Factorization (NMF). We use visual-ization techniques to analyze in greater details the results of the factorization. We propose a model to simulate stu-dent data and show that the NMF technique is indeed effec-tive under certain assumptions. We use the simulation data model parameters as a means to quantify and estimate the effect of skills over the observed examinee performance in some of the real data of Winters et al. original study. First, let us give some details about NMF.
2.
NON-NEGATIVE MATRIX
FACTORIZATION AND Q-MATRIX
INTERPRETATION
Non-negative matrix factorization (NMF) decomposes a ma-trix into two smaller matrices. It is used for dimensionality reduction, akin to Principal Component Analysis and Fac-tor analysis. NMF decomposes a matrix ofn×m positive numbers,V, as the product of two matrices:
V≈WH (1)
The matricesW and Hare respectivelyn×r and r×m, whereris called the rank of the factorization. For our pur-pose, matrix Vrepresents the observed test outcome data for n question items and m respondents. Therefore, the product ofW and H reproduces the observed patterns of success/failures of themexaminee to thenitems. The ma-trixWcan be considered as a Q-matrix, whereasHcan be considered as the skills mastery for eachm examinee. In the case of a Q-matrix, r represents the number of skills, which can take any value but should normally conform to:
r < nm/(n+m) [9].
Let us take an example to better explain NMF in our con-text. Assume the following Q-matrix, W, composed of 3 skills and 4 items, and the following skills mastery ma-trix,H, for 5 examinees:
W= skills items 0 1 0 0 0 1 1 0 0 0 0 1 H= examinees skills 1 1 1 0 1 0 0 1 0 1 0 1 0 1 1
Given this Q-matrix and the skills mastered by the 5 exam-inees, the expected results are:
V=WH= examinees items 0 0 1 0 1 0 1 0 1 1 1 1 1 0 1 0 1 0 1 1
For example, taking the first item and the first examinee, we have, fromW, that item 1 requires skill 2, but, fromH, we see that examinee 1 only masters skill 1, therefore item 1 is failed by examinee 1. In fact, examinee 1’s only success is over item 3 since all other items require either skills 2 or 3. It is important to emphasize that there are many solutions toV=WH. For example, the same results as those above
can be obtained with different Q-matrix and skills matrix:
examinees items 0 0 1 0 1 0 1 0 1 1 1 1 1 0 1 0 1 0 1 1 = skills items 0 12 0 1 2 0 0 0 12 1 1 2 0 0 examinees skills 0 2 0 2 2 0 0 2 0 2 1 1 0 0 0
Notice that the weights are changed as well as the ordering of rows and columns compared to the first solution. Never-theless, it remains a valid factorization ofV that could be derived by some NMF algorithm.
Indeed, there are many NMF algorithms that were devel-oped since its introduction by Lee and Seung [9] and they can yield different solutions. We refer the reader to [4] for a more thorough and recent review of this technique which has gained strong adoption in many different fields. Whereas the other matrix factorization techniques often pose constraints of orthogonality among factors, NMF im-poses the constraint that the two matrices, W andH, be non-negative. This constraint makes the interpretation much more intuitive in the context of using this technique for building a Q-matrix. It implies that the skills (latent fac-tors) are additive “causes” that contribute to the success of items, and that they can only increase the probability of success and not decrease it, which makes good sense for skill factors. Note that negative values inWcan be interpreted as misconceptions and would lower the expected score to items, but allowing negative values in the factorization also opens up the space of possible solutions and raises the issue of convergence and of the multiplicity of solutions, making the interpretation ofWmuch more speculative.
The non-negative constraint and the additive property of the skills bring a specific interpretation of the Q-matrix. For example, if an item requires skillsaandbwith the same weight each, then each skill will contribute equally to the success of the item. This corresponds to the notion of a compensatory oradditive model of skills.
In our study, we focus on high level skills, which we term topic skills. However, if an item requires two specific lower level skills, such as mastery of the rulesa/c+b/c= (a+b)/c
anda/b·b=a, aconjunctivemodel would be necessary, indi-cating that a failure is expected if any skill is not mastered. The standard interpretation of the Q-matrix corresponds to the conjunctive model, and theWmatrix of NMF does not correspond to this interpretation, unless and as mentioned, we assume that each item belongs to a single skill and for which case the two interpretations are indiscernible. A last remark on NMF: as mentioned above, the factor-ization can produce multiple solutions, even with a single algorithm, which raises the issue of stability of the results. However, Schachtner et al. [11] discuss this issue and sug-gest that for binary data the problem may not appear at all. Nevertheless, we will assess the extent to which the multi-ple solution issue impacts the validity and usefulness of the approach by running multiple folds simulations.
3.
Q-MATRIX EXTRACTION FROM REAL
DATA
Winters et al. [13] experimented with NMF over SAT and Trivia tests data2. We start by replicating their experiment and visualize the results graphically with a heatmap graph. This graph provides a global and intuitive view of the re-sults. We turn to quantitative measures in the next section. The Trivia and SAT data sets have a similar structure: 40 question items broken down into 4 topics of 10 items each. Random samples of 100 examinees are taken from the com-plete data sets to run the Q-matrix extractions. This size is chosen as it represents realistic numbers of tests data that can be gathered in practice.
The 4 topics of the SAT data are (1) Mathematics, (2) Bi-ology, (3) World History, and (4) French. These topics are sufficiently far apart that we can expect that the intra-topic correlation allows strong clustering. The data is composed of a total of 297 respondents who completed the 40 question items tests over the Internet. The profile of the respondents is unknown but they are probably from the university stu-dent community.
The trivia data set uses questions published from the Trivial Pursuit game. It mimics the structure of the SAT data set and is composed of 4 topics containing 10 questions on (1) Arts and entertainment, (2) Sports and leisure, (3) Science and nature, and (4) Geography.
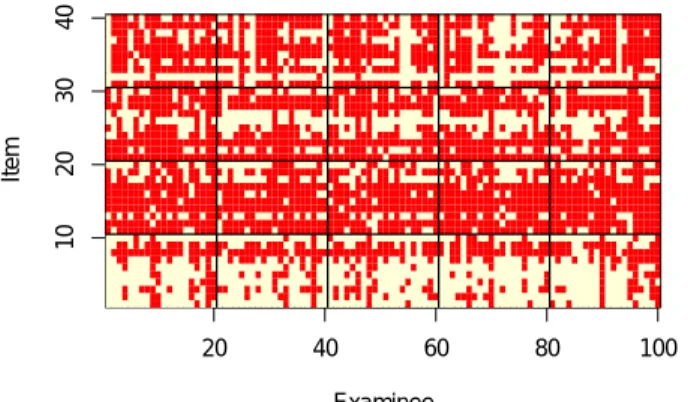
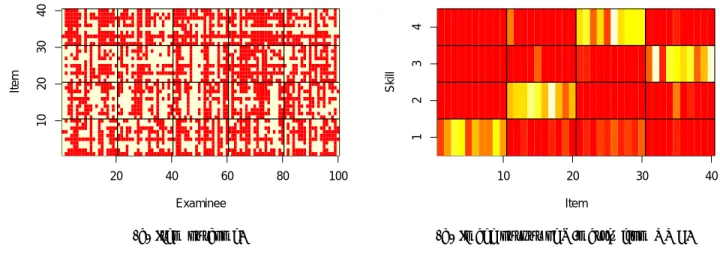
The results of the NMF algorithm over these two data sets are reported in figure 1, where the heatmaps of the test re-sults data and of the Q-matrix derived from the test rere-sults are displayed. Each of the four sub-figures is described be-low.
The SAT results are shown in figures 1(a) and 1(b). Fig-ure 1(a) shows the raw data, where a dark red pixel rep-resents a failure and a light yellow a success. Variation in the difficulty of each topic is apparent in this figure: items 1 to 10 show a higher success rate than items 10 to 20. Individual item difficulty is also apparent by the horizon-tal patterns. Vertical patterns are also apparent, especially within the items of a topic. This represents what we can call the examinee’stopic skill effect. The pattern that spans across topics represents an examinee’sgeneral ability effect. We later refer to the topic skill effect as βq, and to item difficulty and general ability asβm and βn respectively, in reference to themrows andncolumns of matrixVin equa-tion (1).
Figure 1(b) shows the Q-matrix extracted with NMF from from the SAT data. As explained in section 2, the Q-matrix indicates the mapping of skills to items, and the higher val-ues of the matrix tend towards the yellow colour whereas low values are red. A clustering consistent with the four SAT topics would show as four yellow clusters of 10 contiguous items, one for each skill. In reality, we see that clusters of the Mathematics (items 1 to 10) and the French items (31 to 40) are relatively well defined and apparent to the eye, but not as much with the Biology (11 to 20) and World History (21 to 30).
2The data sets from [13] were made available fromalumni.
cs.ucr.edu/~titus/. The simulation scripts of this article are available from www.professeurs.polymtl.ca/ michel.desmarais/Papers/EDM2011/scripts.html. They are based on the NMF package from the statistical software R.
Figures 1(c) and 1(d) respectively show the raw data and the NMF derived Q-matrix for the Trivia data set. We see from the raw data graph that the success rate is lower than for the SAT data. As for the clustering, it is visually indiscernible in the Q-matrix. As we see later in table 1, clustering accuracy is in fact no better than chance.
These findings concur with that of Winters et al. [13] who found relatively good accuracy for the French and Mathe-matics topics of the SAT data, but found results that are no better than chance for the Trivia data. The most troubling findings from their experiments is that the Trivia results are similar to those obtained over a number of test outcome from different computer science courses: “Nearly every course be-haves the same as the trivia data. Only our smallest data set, the Algorithms course data, showed any significant hint of topic structure.” This conclusion casts a gloomy picture for high level transfer models, where we aim to assess the mastery of topic specific skills from similar topic skills. However, statistical characteristics of the data may also in-fluence the clustering accuracy. For example, skewness of the scores towards 0% or 100% will result in sparsity of suc-cess/failure that can negatively affect the ability to extract a valid Q-matrix from the data. The Trivia data shows such skewness towards low success rate and we can question whether this is not the source of the low accuracy.
In the next section, we investigate the influence of the suc-cess rates and item and examinee variance over the Q-matrix validity using simulated data instead of real data.
4.
Q-MATRIX EXTRACTION FROM
SIM-ULATED DATA
Simulated data allows us to predefine the underlying item-skill mapping of the Q-matrix and generate data from this mapping. Using simulated data, we can ascertain under which assumptions the NMF can effectively derive back the Q-matrix.
4.1
Simulated data generation
To generate the simulated data, we create a probability ma-trix, P, from which we generate a data matrix, D, of the same dimensions as P. The matrixDcorresponds toVin equation (1) and it contains successes and failures, {0,1}. The value of elementdij inD is randomly determined us-ingpij fromPas the probability of success, and 1−pijfor failure.
For the sake maintaining the similarity with the real data analyzed in section 3, the dimensions of the probability and data matrices are 40×100.
The probabilities of matrixPare obtained according to the following model:
pij= Φ(βi+γj+δjk) (2) Where:
pij : represents the probability of success to item i by examineej
Φ(x) : is the cumulative distribution function of the stan-dard normal distribution
and where βi, γj and δjk are random Gaussian variables representing respectively the item success rate (difficulty), examinee ability, and topic skill factors.
20 40 60 80 100 10 20 30 40 Examinee Item
(a)Item outcome from SAT scores of 4 topics and a sample of 100 examinees.
10 20 30 40 1 2 3 4 Item Skill
(b)Image output of Q-matrix from NMF for 4 skills and 40 question items.
20 40 60 80 100 10 20 30 40 Examinee Item
(c)Item outcome from Trivia scores of 4 top-ics and a sample of 100 examinees.
10 20 30 40 1 2 3 4 Item Skill
(d)Image output of Q-matrix from NMF for4 skills and 40 question items.
Figure 1: NMF results over the SAT and Trivia data sets.
For every student j, his or her general ability γj is drawn from the distributionN(X, sn), whereXis the average score over all students and topics, andsn the standard deviation of the average score per student. X andsn are taken from the real data, or fixed to given values depending on the experiment (see section 5). For every student j and skill categoryk, his or her topic specific abilityδjkis drawn from the distributionN(Xk, sk), whereXkis the mean score over categoryk, anskthe standard deviation of the average score between categories. Xkand sk can again be fixed or taken from the real data. For every itemi, the item difficultyβiis sampled from the distributionN(X, sm) where X is again the average score over all questions and students, andsm the standard deviation of the per question average score. The probabilitypijof studentj answering questionjfrom category k correctly is now computed according to equa-tion (2). With probabilitypij,dijwill be 1 (correct answer), otherwise it is 0 (incorrect answer).
Equation (2) can be considered as a simple model of exam-inee performance as a function of topic skill mastery, item
difficulty, and examinee general ability (which spans across topics). In spite of its simplicity compared to other means of generating simulated data (for an example, see [8]), it re-mains realistic for our context where we assume that topic skills are relatively independent, or at least this is an as-sumption we want to investigate and therefore it makes sense that our model follows that same assumption.
4.2
Clustering measure
Clustering is based on the simple algorithm which assigns each item to one of the 4 clusters based on the maximum column value in matrixW. Given that we know the actual category of each item, the accuracy of the clustering can be computed. This is obtained by a two step process. First, a contingency table is compiled from the clustering algorithm. Next, the lines are reordered so that the sum of the diagonal is maximized. The ratio of this sum over the total represents the accuracy of the assignment. An example of the contin-gency table obtained is given below for the SAT data along
20 40 60 80 100 10 20 30 40 Examinee Item
(a) Item outcome.
10 20 30 40 1 2 3 4 Item Skill
(b) Image output of Q-matrix from NMF.
Figure 2: NMF results over random data from randomly distributed data according to equation (2), reflecting equal effect of topic, item difficulty, and examinee ability over the probability of success.
with its reordering: Cluster Category 1 5 5 0 0 2 0 0 10 0 3 1 0 1 8 4 10 0 0 0 Reordering =⇒ Cluster Category 4 10 0 0 0 1 5 5 0 0 2 0 0 10 0 3 1 0 1 8
Note that the category and the cluster labels are irrelevant for measuring accuracy, but it interesting to note that in this example the values of 10 are the Mathematics and French categories/clusters. As mentioned, the sum of the diagonal over the sum of all values represents the accuracy of this assignment: 33/40 = 0.825.
5.
INVESTIGATING THE PARAMETER
SPACE OF SIMULATED STUDENT
DATA
Figure 2(a) displays the raw data generated according to equation (2) with values of 0 for the mean and of 1 for the standard deviation for theβi, γj and δjk parameters. Vertical and horizontal patterns can be discerned, as well as topic delineated patterns as we expect from the model of equation (2).
Figure 2(a) shows the Q-matrix (W) obtained from applying NMF over the simulated data.
Using the simple algorithm outlined in section 4.2, the re-sults yield a perfect match of item to skills. We can therefore conclude that, when the mean and variance of theβi,γjand
δjk parameters in equation (2) are all equal, the Q-matrix from NMF perfectly matches the underlying Q-matrix. But what happens when the effect of the topic skill parame-ter,δjk, becomes weaker compared to the other two param-eters? Naturally, the accuracy of the item-skill clustering becomes lower. This can be observed in table 1 where the link between accuracy and parameter ratios is quantified.
Table 1 reports the accuracy results of 14 N-folds simula-tion experiments conducted with different parameters. For simplicity, we consider a single mean of 0 for δjk. We also restrict the standard deviations to 1 forβiandγjgiven that they have the same effect according to equation (2) and and that we are interested in the values of the parameters re-spective to one another, therefore we can keep them fixed and varysk only.
The first experiment reports an accuracy of 0.36 when no topic skill is defined3. As the variance increases (“S.d.”: standard deviation column in the table), the accuracy over a 20-fold simulation gradually reaches 1 as its variance ap-proaches that of the other two parameters. This trend is expected, but it quantifies, in terms of relative variance, the relation between the effect of the topic skill and the item and examinee effect. When the variance of the topic fac-tor is comparable to that of item and examinee facfac-tors, the method yields very high accuracy.
Experiments 6 to 9 show the results of variations over the means ofβi and γj. Experiment 7 shows that when both means of βi and γj are increased to 1 (in z score of the standard normal distribution), the accuracy starts to drop slightly to 0.98. Only for means of 1.5 and 2.0 does the per-formance decrease noticeably to 0.90 and 0.81 respectively. In experiment 10, the simulation parameters replicate those of the Trivia data set, whereas experiment 12 is done with parameters from the SAT data set. Experiments 11 and 13 report the accuracies of NMF over the real data, correspond-ing to the graphics in figure 1.
For the Trivia data, the accuracy is comparable to the ran-dom, no topic skill condition. This result concurs with the conclusion of Winters et al. [13], namely that topic subject is not a determining factor that affects test performance. 3If we had a very large number of items, this number, 0.36, would be close to 0.25, the theoretical accuracy of a random match in a 4×4 contingency table. However, the 40 items distribution in this table create an opportunity of over fit for the algorithm that assigns clusters to skills. The difference of 0.11 (0.36−0.25) can be attributed to this over-fitting.
Table 1: Experiments over the parameter space of skills, items, and examinee (respectivelyδjk,βi, andγj in equation (2)). Parameter space
Topic skill (δjk) Item (βi) Examinee (γj) Accuracy Mean S.d. Mean S.d. Mean S.d. N folds Mean acc. S.d. acc.
1* 0 0 0 1 0 1 20 0.36 0.05 2 0 0.10 0 1 0 1 20 0.48 0.07 3 0 0.25 0 1 0 1 20 0.60 0.11 4 0 0.50 0 1 0 1 20 0.93 0.08 5 0 1 0 1 0 1 20 1 0 6 0 1 0.50 1 0.50 1 20 1.00 0.01 7 0 1 1 1 1 1 20 0.98 0.07 8 0 1 1.50 1 1.50 1 20 0.90 0.12 9 0 1 2 1 2 1 20 0.81 0.16
Trivia data parameters
10 0 0.12 -1.05 0.73 -1.05 0.45 20 0.75 0.12
11 ** n.a. 0.12 -1.05 0.73 -1.05 0.45 20 0.35 0.03
SAT data parameters
12 0 0.24 -0.33 0.86 -0.33 0.50 20 0.98 0.05
13** n.a. 0.24 -0.33 0.86 -0.33 0.50 20 0.72 0.02
14*** n.a. 0.24 -0.33 0.86 -0.33 0.50 20 0.96 0.05
* No topic skill effect conditions ** Real data
*** Real data and scoring for the Mathematics and French topics only
Comparing the results to the accuracy reported on experi-ments 11 and 13 for real data, we observe that for SAT data, the accuracy is lower than experiment 12 and somewhere be-tween experiments 3 and 4, which corresponds to a standard deviation of topic skill between 0.25 and 0.5 whenβiandγj have a (0,1) standard distribution. In other words, the skill effect is a little less than half the item and examinee effects. If we look only at the clustering for Mathematics and French (experiment 14) which are the most separable topics, then the accuracy goes up to 0.96, which is much closer to exper-iment 12. In terms of relative effect, the skill effect between Mathematics and French is close to the 0.93 accuracy ob-tained in 4, for which the standard deviation of skill effect is 0.50 of the item and examinee parameters.
In summary, the Trivia data shows negligible effect of topic skill, whereas the SAT data shows an effect that is essen-tially attributable to the Mathematics and French topics that can be clearly distinguished in the Q-matrix derived with NMF. The topic skill effect can be quantified as some-where between 1/4 to 1/2 of the item and examinee effect as measured by the standard deviation, and over 1/2 if we only take Mathematics and French effects alone.
6.
DISCUSSION
We conjectured earlier that the low success rate of the Trivia data could explain the low accuracy results obtained. This is only partly the case. When the simulations parameters are set to the same values as the Trivia data, the accuracy obtained is 0.75 (experiment 104) whereas the real data re-4Experiment 10 has a relative skill-item s.e. of 0.12/0.73 = 0.16, standing between experiments 2 and 3, and a relative skill-examinee s.d. of 0.12/0.45 = 0.27, standing close to ex-periment 3. If the performance followed some additive func-tion of each of these ratios, we would expect the performance to be no better than that of experiment 3, 0.60. Given that
sults are 0.35 (experiment 11). Therefore, results of exper-iment 10 suggest that the gap between 0.75 and 0.35 is at-tributable to the lack of skill effect in this data, or at least, the lack of the 4 Trivia topic skills effects. Alternatively, other skills may affect the results and they are by no means constrained to four as is the case for this study. Finally, we can also conjecture that the items belong to more than one skills and that the additive model of the Q-matrix investi-gated here is not appropriate (see for eg. [10] and [1]. These questions call for further investigation.
Our results further indicate that for well delineated topic skills like Mathematics and French, the effect is relatively strong, in a range around half that item difficulty and ex-aminee ability according to the results in table 1, at least for highly separable topics like Mathematics and French. In this case, the accuracy of matching items to skills with NMF is well in the range of 90%, which confirms the effectiveness of this technique under these conditions.
7.
REFERENCES
[1] E. Ayers and B. W. Junker. Do skills combine additively to predict task difficulty in eighth grade mathematics? InEducational Data Mining Workshop at AAAI, pages 14–20, Menlo Park, CA 2008.
[2] R. S. Baker and K. Yacef. The state of educational data mining in 2009: A review and future visions. Journal of Educational Data Mining, page (online), 2009. [3] T. Barnes. Evaluation of the q-matrix method in
un-derstanding student logic proofs. In G. Sutcliffe and it stands higher at 0.75, we have to conclude that the effect of s.d. ratios over the performance is more complex, possibly a ratio of s.d. such as topic/(item×examinee).
R. Goebel, editors,Proceedings of the Nineteenth Inter-national Florida Artificial Intelligence Research Society Conference, Melbourne Beach, Florida, USA, May 11-13, 2006, pages 491–496. AAAI Press, 2006.
[4] M. W. Berry, M. Browne, A. N. Langville, V. P. Pauca, and R. J. Plemmons. Algorithms and applications for approximate nonnegative matrix factorization. Compu-tational Statistics & Data Analysis, 52(1):155 – 173, 2007.
[5] H. Cen, K. R. Koedinger, and B. Junker. Automat-ing cognitive model improvement by A* search and lo-gistic regression. In J. Beck, editor, Educational Data Mining: Papers from the 2005 AAAI Workshop., pages 47–53. Technical Report WS-05-02. Menlo Park, Cali-fornia: AAAI Press, 2005.
[6] H. Cen, K. R. Koedinger, and B. Junker. Learn-ing factors analysis — A general method for cogni-tive model evaluation and improvement. InIntelligent Tutoring Systems, 8th International Conference, ITS 2006, Jhongli, Taiwan, June 26-30, 2006, Proceedings, pages 164–175, 2006.
[7] M. C. Desmarais. Conditions for effectively deriving a q-matrix from data with non-negative matrix factoriza-tion. In C. Conati, S. Ventura, T. Calders, and M. Pech-enizkiy, editors,4th International Conference on Edu-cational Data Mining, EDM 2011, pages 41–50, Eind-hoven, Netherlands, June 6–8 2011.
[8] M. C. Desmarais and I. Pelczer. On the faithfulness of simulated student performance data. In R. S. J. de Baker, A. Merceron, and P. I. Pavlik, editors, 3rd International Conference on Educational Data Mining EDM2010, pages 21–30, Pittsburgh, PA, USA, June 11–13 2010.
[9] D. D. Lee and H. S. Seung. Learning the parts of objects by non-negative matrix factorization. Nature, 401(6755):788–791, Oct. 1999.
[10] Z. A. Pardos, N. T. Heffernan, C. Ruiz, and J. Beck. The composition effect: Conjuntive or compensatory? an analysis of multi-skill math questions in ITS. InFirst Educational Data Mining Conference, pages 147–156, Montreal, Canada 2008.
[11] R. Schachtner, G. Poppel, and E. Lang. A nonnega-tive blind source separation model for binary test data. Circuits and Systems I: Regular Papers, IEEE Trans-actions on, 57(7):1439 –1448, 2010.
[12] K. K. Tatsuoka. Rule space: An approach for deal-ing with misconceptions based on item response the-ory. Journal of Educational Measurement, 20:345–354, 1983.
[13] T. Winters, C. Shelton, T. Payne, and G. Mei. Topic extraction from item level grades. InAmerican Associ-ation for Artificial Intelligence 2005 Workshop on Ed-ucational Datamining, 2005.