Discriminative Multimodal Biometric
Authentication Based on Quality Measures
Julian Fierrez-Aguilar
a,∗
, Javier Ortega-Garcia
a,
Joaquin Gonzalez-Rodriguez
a, Josef Bigun
baEscuela Politecnica Superior, Universidad Autonoma de Madrid, Ctra. Colmenar
km. 15, E-28049 Madrid, Spain
bHalmstad University, Box 823, S-301 18 Halmstad, Sweden
Abstract
A novel score-level fusion strategy based on quality measures for multimodal bio-metric authentication is presented. In the proposed method, the fusion function is adapted every time an authentication claim is performed based on the estimated quality of the sensed biometric signals at this time. Experimental results combin-ing written signatures and quality-labelled fcombin-ingerprints are reported. The proposed scheme is shown to outperform significantly the fusion approach without consider-ing quality signals. In particular, a relative improvement of approximately 20% is obtained on the publicly available MCYT bimodal database.
Key words: Biometrics, multimodal, authentication, verification, quality, support vector machine, fingerprint, signature
∗ Corresponding author. Tel.: +34-91-4972269; fax: +34-91-4972235
1 Introduction
A number of works have been focused on information fusion for multimodal biometrics [1,2]. Nevertheless, none of them have explicitly explored the ef-fect of using quality measures into the problem (with the exception of a few cases in specialized events, see [3] and references therein). In this work, an operational procedure for dealing with degraded data in multimodal biomet-ric authentication is presented and evaluated on real data from the MCYT bimodal corpus [4].
2 Proposed quality-based fusion strategy
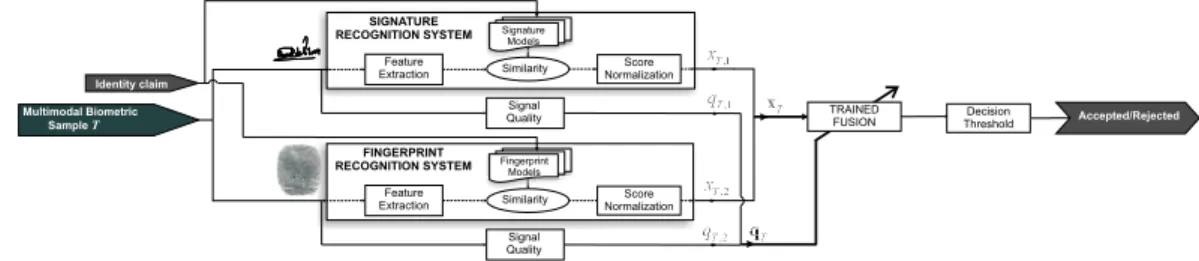
The proposed scheme is based on user-independent adaptive score-level fu-sion (see Fig. 1 for the system model), and Support Vector Machine (SVM) classifiers for training the fusion function. With adaptive, we mean that the score-level fusion function is adapted every time biometric data is sensed de-pending on the estimated quality at this time.
Let q = [q1, . . . , qR]0 denote the quality vector of the multimodal similarity
score x= [x1, . . . , xR]0, where qr is a scalar quality measure corresponding to
similarity score xr with r = 1, . . . , R and R is the number of modalities. In
this work, the quality valuesqr are computed as follows:
qr =
q
Qr·Qr,claim, (1)
where Qr and Qr,claim are the quality measure of the sensed signal for
by unimodal system r for modelling the claimed identity, respectively. The
two quality labels Qr and Qr,claim are supposed to be in the range [0, Qmax]
with Qmax >1, where 0 corresponds to the poorest quality, 1 corresponds to
standard quality, and Qmax corresponds to the highest quality.
The proposed score-level fusion scheme based on SVM classifiers and quality measures is as follows:
(1) (Training Phase) An initial fusion function (fSVM :RR→R, fSVM(xT) =
hw,Φ(xT)i+w0) is trained by solving the problem
min w,w0,ξ1,...,ξN Ã 1 2kwk 2+ PN i=1Ciξi ! (2) subject to yi(hw,Φ(xi)i+w0)≥1−ξi, i= 1, . . . , N (3) ξi ≥0, i= 1, . . . , N (4)
in its dual representation and exploiting the kernel trick, as usual [3], using as cost weights
Ci =C Ã QR r=1qi,r QR max !α1 , (5)
where qi,r, r = 1, . . . , R are the components of the quality vector qi
as-sociated with training sample (xi, yi),yi ∈ {−1,1}={Impostor,Client},
and C is a positive constant. As a result, the higher the overall quality
of a multimodal training score the higher its contribution to the
compu-tation of the initial fusion function. Additionally, R SVMs of dimension
R−1 (SVM1 to SVMR) are trained leaving out traits 1 toRrespectively.
Similarly to Eq. (5), Ci =C(
Q
(2) (Authentication Phase) Let the sensed multimodal biometric sample
gen-erate a quality vectorqT = [qT,1, . . . , qT,R]0. Re-index the individual traits
in order to have qT,1 ≤ qT,2 ≤ . . . ≤ qT,R. A multimodal similarity score
xT = [xT,1, . . . , xT,R]0 is then generated. The combined quality-based
sim-ilarity score is computed as follows:
fSVMQ(xT) =β1 R−X1 r=1 βr PR−1 j=1 βj fSVMr(x (r) T ) + (1−β1)fSVM(xT), (6) where x(Tr) = [xT,1, . . . , xT,r−1, xT,r+1, . . . , xT,R]0 and βr = Ã qT,R−qT,r Qmax !α2 , r= 1, . . . , R−1. (7)
As a result, the adapted fusion function in Eq. (6) is a quality-based trade-off between not using and using low quality traits.
3 Experiments
Experiments are carried out by using both the minutiae-based fingerprint veri-fication system used in [3] and the function-based on-line signature veriveri-fication system used in [4] on real bimodal data from MCYT corpus [4]. In
particu-lar, 75×7 client and 75×10 impostor bimodal attempts in a near worst-case
scenario are considered (best impostors from a pool of 750 fingers in case of fin-gerprint, skilled forgers in case of signature). All fingerprint images have been supervised and labelled (between 0 and 2) according to the image quality by a human expert [3] and these labels are used as quality measures for fingerprints.
In the following, the proposed quality-based multimodal approach (α1 = 0.5,
α2 = 1 andC = 100) is compared to multimodal fusion without quality (q= 1
for all signals), as well as multi-probe results using individual traits but various sensed signals (in order to reveal the benefits of incorporating various traits) by using a variant of bootstrap resampling for training/testing the different methods [3]. Comparative performance results are given in Figs. 2 (a) and (b). Remarkable performance improvement is obtained with the quality-based approach in both cases. As compared to the fusion approach not using quality measures, approximately 20% relative performance improvement around the EER is obtained when considering fingerprint quality measures.
4 Conclusion
An operational procedure for adapting score-level fusion functions based on quality measures for multimodal biometrics has been presented and evaluated on publicly available real bimodal biometric data. Using a novel experimental protocol that mitigates some of the problems commonly encountered in other works (e.g., data scarcity, lack of understanding of the correlation effects within and between biometric traits) based on a worst case scenario, bootstrap error estimation, and multi-modal versus multi-probe comparative experiments, the benefits of exploiting quality information have been revealed.
Acknowledgements
This work has been supported by MCYT project TIC2003-08382-C05-01. J. F.-A. is also supported by a FPI Fellowship from Comunidad de Madrid.
References
[1] E. S. Bigun, J. Bigun, et al., Expert conciliation for multimodal person authentication systems by Bayesian statistics, LNCS 1206 (1997) 291–300. [2] A. Jain, A. Ross, Multibiometric systems, Comm. of the ACM 47 (2004) 34–40. [3] J. Fierrez, J. Ortega, J. Gonzalez, J. Bigun, Kernel-based multimodal biometric
verification using quality signals, Proc. SPIE 5404 (2004) 544–554.
[4] J. Ortega, J. Fierrez, D. Simon, et al., MCYT baseline corpus: A bimodal biometric database, IEE Proc. VISP 150 (2003) 395–401.
Figure captions:
Fig. 1. System model of multimodal biometric authentication based on score-level fusion and quality measures.
Fig. 2. Verification performance results considering (a) index fingers, and (b) highest quality finger for 95% of users and poorest quality finger for the remaining 5% users.
Figure 1: Feature Extraction Feature Extraction Similarity FINGERPRINT RECOGNITION SYSTEM Multimodal Biometric SampleT SIGNATURE RECOGNITION SYSTEM Score Normalization Signature Models Fingerprint Models Identity claim Similarity Score Normalization Signal Quality Signal
Figure 2: 0.2 0.5 1 2 5 10 20 40 0.2 0.5 1 2 5 10 20 40
False Acceptance Rate (%)
False Rejection Rate (%)
Fingerprint 4.552% EER Fusion(F,F) 3.920% EER Signature 3.543% EER Fusion(S,S) 2.408% EER Fusion(F,S) 1.395% EER Q−Fusion(F,S) 1.132% EER (a) 0.2 0.5 1 2 5 10 20 40 0.2 0.5 1 2 5 10 20 40
False Acceptance Rate (%)
False Rejection Rate (%)
Fingerprint 5.333% EER Fusion(F,F) 4.007% EER Signature 3.543% EER Fusion(S,S) 2.408% EER Fusion(F,S) 1.910% EER Q−Fusion(F,S) 1.475% EER (b)
JULIAN FIERREZ-AGUILAR received the M.S. degree in electrical engineer-ing in 2001, from Universidad Politecnica de Madrid. Since 2004 he is with Universidad Autonoma de Madrid, where he is currently working towards the Ph.D. degree on multimodal biometrics. His research interests are focused on signal and image processing, pattern recognition and biometrics. He was the recipient of the Best Poster Award at AVBPA 2003 and leaded the develop-ment of the UPM signature verification system ranked 2nd in SVC 2004. JAVIER ORTEGA-GARCIA received the Ph.D. degree in electrical engineer-ing in 1996 from Universidad Politecnica de Madrid. He is currently an As-sociate Professor at Universidad Autonoma de Madrid. His research interests are focused on forensic acoustics and biometrics signal processing. He has participated in several scientific and technical committees, and has chaired “Odyssey-04, The ISCA Speaker Recognition Workshop”.
JOAQUIN GONZALEZ-RODRIGUEZ received the Ph.D. degree in electrical engineering in 1999 from Universidad Politecnica de Madrid. He is currently and Associate Professor at Universidad Autonoma de Madrid. His research interests are focused on signal processing, biometrics and forensics. He is an invited member of ENFSI and has been vice-chairman for “Odyssey-04, The ISCA Speaker Recognition Workshop”.
JOSEF BIGUN obtained his Ph.D. degree from Linkoeping University in 1988. He was elected professor to the signal analysis chair, his current position, at Halmstad University and Chalmers Institute of Technology in 1998. He is a Fellow of the IEEE and IAPR. His interests include biometrics, texture analysis, and understanding of the biological processing of audio-visual signals.