CURRENT STATUS OF INSURANCE
COVERAGE IN THE STATE OF HAWAI’I
HAWAI’I DEPARTMENT OF COMMERCE &
CONSUMER AFFAIRS, INSURANCE
DIVISION
Josh Sober, FSA, MAAA
CONTENTS
1. Executive Summary ... 1
2. Introduction ... 5
3. Data and Reliance ... 7
• Population Data ... 7
─ Additional Medicaid Edits ... 9
• Medical Expenditure Panel Survey ... 10
• Annual Financial Statement Data ... 10
• Carrier Data Call ... 11
4. Overview of Hawai’i’s Current Health Insurance Market ... 12
• Key Provisions ... 14
5. Hawai’i’s Private Employer Market ... 18
• Prepaid Health Care Act ... 18
• Employer Incentives ... 19
• Hawai’i’s Private Employer Market ... 20
• Fully Insured Group Coverage Offered in Hawai’i ... 27
• Rate Development in the Small Group Market ... 29
6. Hawai’i’s Individual Direct Purchase Market ... 31
• Individual Incentives ... 31
• Demographics ... 31
• Rate Development in the Individual Direct Purchase Market ... 33
• Benefit Offerings in the Direct Purchase Market ... 35
─ Coverage Tier, Age/Gender, and Health Status ... 36
7. Hawai’i’s Low-income Market ... 37
8. Hawai’i’s Uninsured Population ... 43
• Uninsured Purchase Decision ... 43
9. Basic Health Program ... 51
10. Exchange Eligibility Estimates ... 53
• Participating Carriers ... 54
Appendix A: Estimate of Individuals Covered by Public Coverage ... 55
1
Executive Summary
The Affordable Care Act of 2010 (ACA) provides funding assistance for the planning and establishment of the American Health Benefit Exchanges (Exchanges). Under the ACA, each state may elect to set up an Exchange that will create a new marketplace for heath insurance. Oliver Wyman Actuarial Consulting, Inc. (Oliver Wyman) was engaged by the Hawai’i
Department of Commerce and Consumer Affairs to assist them in conducting planning tasks related to the development of Hawai'i's Connector (the Connector). The Connector would include the individual Exchange and Small Business Health Options Program (SHOP)
Exchange. One of our primary tasks of this engagement was to prepare background research of Hawai’i’s current population and health insurance marketplace. Much of what we present in this report will serve as a basis for future phases of this planning project.
For this report, we have relied on numerous data sources both as a basis for estimates as well as to validate our conclusions. We based much of the demographic analysis on data from the American Community Survey (ACS). The ACS is conducted by the United States (US) Census Bureau and participation in it is required by law for those who are selected. We felt it important to rely on a primary data source to ensure consistency of estimates, and we chose the ACS because, among other reasons, the US Census Bureau attempts to correct a well documented phenomenon of population surveys called “the Medicaid undercount.” The Medicaid undercount manifests itself when Medicaid enrollment estimates from survey data are substantially lower than actual state enrollment reports. For these analyses, we have relied on estimates from calendar year 2010. In addition, we relied on publicly available financial statements from insurer participants in Hawai’i’s insurance market, as well as on information from insurance carriers’ websites.
Based on the ACS data and information from the Med-QUEST Division in the Department of Human Services, we estimate that Hawai’i’s residents are covered by the following modes of insurance. (Please note that the estimates of persons and standard deviations are in 1,000’s.)
Table 1.1
Coverage Summaries (in 1,000's)
Coverage Persons Distribution Stand Dev +/- Persons Distribution Stand Dev
+/-Employer (non-Medicare) 717 52.6% 4.7 148,868 48.2% 70.9
Employer (Medicare) 95 7.0% 1.3 13,668 4.4% 16.6
Military (Active) 93 6.8% 2.3 5,236 1.7% 17.5
Military (Retired) 1 0.1% 0.2 357 0.1% 3.3
Direct Purchase 44 3.2% 1.6 16,616 5.4% 34.0
Medicare 77 5.6% 1.4 22,455 7.3% 20.0
Medicaid 193 14.2% 3.5 43,541 14.1% 49.9
Dual 39 2.9% 1.4 9,815 3.2% 19.2
No Coverage 104 7.6% 2.2 48,257 15.6% 48.1
Total 1,363 100.0% 308,813 100.0%
2010 American Community Survey – Person Level Data, http://www2.census.gov/acs2010_1yr/pums/
Hawai'i Nation
As the table shows, we estimate that approximately 52.6% of residents are covered by employer sponsored insurance (ESI) in either the small group, fully insured large group or self insured markets. We also estimate that 17.1% are covered by Medicaid or other low-income assistance, and 7.6% are uninsured. Identifying characteristics that might indicate a person’s tendency to change insurance modes was one of our chief goals in evaluating Hawai’i’s population. In subsequent sections, we present some specific elements of the ACA that helped guide our review of those characteristics. Although we present summaries of Hawai’i’s population composition, we show results of our migration models in a forthcoming research paper.
The majority of Hawai’i’s residents are insured by ESI. However, Hawai’i’s Prepaid Health Care Act and the State’s large military presence make Hawai’i unique from other states. In particular, the Prepaid Health Care Act prescribes coverage levels for employers as well as contribution requirements. As a consequence, Hawai’i not only has a lower uninsured rate than other states, but its benefits are more generous. Because of the efficacy of the Prepaid Health Care Act, we suspect that the ACA’s provisions will not induce Hawai’i’s employers to drop employee
coverage at the rate we anticipate for employers in other states.
Although the State has few residents covered by individual health insurance, this segment of the population will be significantly affected by provisions of the ACA. These policy owners are likely to see changes in premium rates, but more importantly, they will face a new domain of
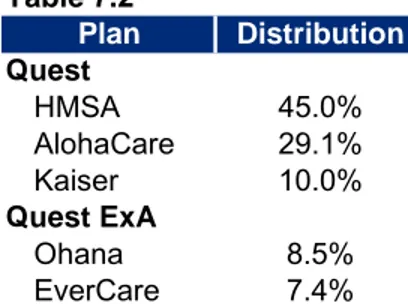
For its low-income population, Hawai’i also has a robust managed Medicaid program. In addition to people qualifying under TANF or CHIP, the State’s Med-QUEST program provides coverage to low-income, childless adults through its QUEST-Ace and QUEST-Net programs.
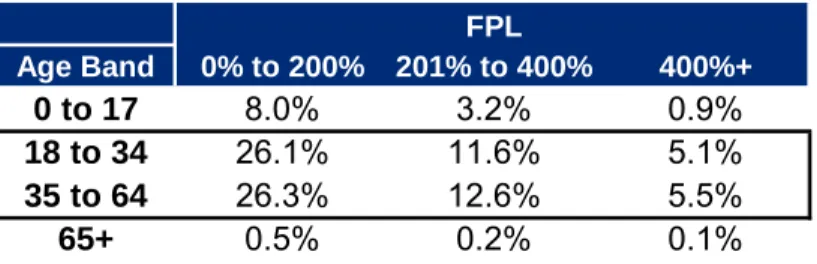
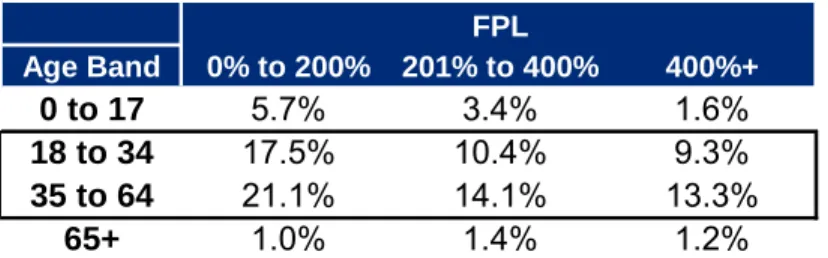
With the Prepaid Health Care Act, the military presence, and expanded Medicaid programs, the uninsured population in Hawai’i is 7.6%, which is lower than the national average. The ACA provides incentives in the form of tax penalties and credits for these individuals to enter the insurance market. However, the data supporting this background research showed that a large number of the uninsured population have incomes over 400% of the Federal poverty level (FPL), which would disqualify them for tax credits in the Connector. There are no clear indications of why these people do not obtain coverage, so it is difficult to assess their likelihood of obtaining coverage once it becomes a requirement.
The basic health program (BHP) is expected to support provisions of the ACA and stabilize coverage for the low-income population. There is evidence that a significant portion of the population under 200% of FPL (non-Medicaid and Medicaid eligible) will gain or lose their Medicaid eligibility with some frequency. The BHP is intended to smooth the transition from Medicaid eligibility to non-Medicaid eligibility without the burden of re-enrollment or potential change in providers. If Hawai’i were to contract with a plan under the BHP, the Federal
government would provide the State 95% of the premium tax credits and cost-sharing subsidies that would have been provided for those individuals had they been enrolled with individual coverage in the Connector. Although members could be required to pay a premium, there would also be some level of cost-sharing subsidization for BHP participants, based on their income. The strength and viability of Hawai’i’s Connector will depend directly on the number of people that use it. In this background research, we have only identified residents that could be affected by the ACA’s incentives; we have not considered the likely enrollment in the Connector. Based on our review, there are approximately 53,900 residents (37,900 uninsured and 16,000 direct purchasers) with incomes that would make them eligible for subsidies and would therefore be primary candidates for individual coverage through the Connector. In addition, there are
currently approximately 151,000 individuals covered through small groups that would be eligible to enroll through the Connector. Although we do not expect that all of these residents would enroll in the Connector, our forthcoming analysis from Oliver Wyman’s micro-simulation model will produce a more precise estimate. These estimates include individuals with income between 139% of FPL and 200% of FPL; so, many of these individuals would also be eligible for a BHP if the State were to employ it.
This background research precedes additional analysis that Oliver Wyman will provide to Hawai’i as part of this planning process. In this paper, we attempt to present a historical representation of Hawai'i's population; this background presentation includes no projections of either the population or the composition of the State's insurance market. Other papers in the series include a discussion of the State's essential health benefits package design, projections of the State's insurance market as produced by Oliver Wyman's proprietary microsimulation model, and projections of potential Basic Health Plan enrollment (under a scenario in which the
State elects to participate in such a program). The conclusions in this report will provide a basis for these further analyses.
2
Introduction
Under the Affordable Care Act (ACA), the Federal government provides funding assistance for the planning and establishment of the Exchanges. Each state may elect to set up Exchanges that will create a new marketplace for heath insurance. The Exchanges will offer consumers a choice of health plan options, oversee the pricing and certification of health plans offering coverage within the Exchanges, calculate premium subsidies and provide information to assist consumers in their purchasing decisions.
Oliver Wyman was engaged by the Hawai’i Department of Commerce and Consumer Affairs (DCCA) to assist them in conducting planning tasks related to the development of Hawai'i's Health Connector (the Connector), which includes the individual Exchange and Small Business Health Options Program (SHOP) Exchange. As one of our initial tasks, we conducted
background research required to assess Hawai'i's current population and health insurance marketplace, as well as to prepare this report. This research serves multiple purposes. First, it will provide the DCCA and other key stakeholders and decision makers with a view of Hawai'i’s market prior to the implementation of significant reforms. Second, it will serve as the basis for many of the inputs into our modeling, which will occur in a subsequent phase of our work. In the following sections, we provide a general overview of Hawai'i’s current market composition by payer type, including the uninsured. Next, we take a more detailed look at each of the key payer types in turn, examining distributions by various demographic, socioeconomic, and in some cases, geographic categories. For the commercial markets, we include information on current benefit offerings and associated premiums. We also present a summary of some of the rating factors and methodologies used by carriers currently offering coverage in Hawai'i’s individual and small group markets. We also provide some initial, high-level indications of the effect that changes required under the ACA could have on rates in these markets in Hawai'i. Finally, we provide a primer on the Basic Health Program (BHP), an optional program that Hawai'i may elect to set up for individuals with incomes between 138% and 200% of the Federal Poverty Level (FPL).1
Oliver Wyman has prepared these projections exclusively for the DCCA, to assist the State of Hawai’i (the State) in planning and preparing for the establishment of the Connector. Consistent with Paragraph 24 of the General Conditions of the Contract for Professional Services, this report was prepared for the sole use by the State. All decisions in connection with the
1 Although the ACA specifies an income threshold of 133% of FPL, it includes a 5% disregard, effectively making the threshold 138% of FPL
implementation or use of advice or recommendations contained in this report are the sole responsibility of the State. This report is not intended for general circulation or publication, nor is it to be used or distributed to others for any purpose other than those that may be set forth herein or in the definitive documentation pursuant to which this report has been issued. These estimates were based on regulations issued by the United States Department of Health and Human Services (HHS), several of which are still in draft form. Our work may not be used or relied upon by any other party or for any purpose other than for which they were issued by Oliver Wyman. Oliver Wyman is not responsible for the consequences of any unauthorized use. All projections are based on the information and data available as of October 1, 2012, and the projections are not a guarantee of results which might be achieved. The projections are subject to unforeseen and random events and so must be interpreted as having a potentially wide range of variability. We have relied on a wide range of data for our analysis including but not limited to information received from commercial carriers offering coverage in the State and various State agencies. We have not independently audited these data, however we have reviewed it for reasonableness and asked clarifying questions where warranted.
Further, the estimates set forth in this report have been prepared before all regulations needed to implement the ACA have been issued, including clarifications and technical corrections, and without guidance on complex financial calculations that may be required. The State is
responsible for all financial and design decisions regarding the ACA. Such decisions should be made only after the State's careful consideration of alternative future financial conditions and legislative scenarios, and not solely on the basis of the estimates illustrated within this report. Lastly, the State understands that Oliver Wyman is not engaged in the practice of law and this report, which may include commentary on legal issues and regulations, does not constitute, nor is it a substitute, for legal advice. Accordingly, Oliver Wyman recommends that the State
secures the advice of competent legal counsel with respect to any legal matters related to this report or otherwise.
This report is intended to be read and used as a whole and not in parts. Separation or alteration of any section or page from the main body of this report is expressly forbidden and invalidates this report.
There are no third party beneficiaries with respect to this report, and Oliver Wyman does not accept any liability to any third party. In particular, Oliver Wyman shall not have any liability to any third party in respect of the contents of this report or any actions taken or decisions made as a consequence of the results, advice, or recommendations set forth herein.
The information contained in this document and in any of the attachments is not intended by Oliver Wyman to be used, nor can it be used, for the purpose of avoiding penalties under the Internal Revenue Code or imposed by any legislative body on the taxpayer or plan sponsor.
3
Data and Reliance
In preparing this report, we have reviewed numerous sources of information on participants in Hawai'i’s health insurance marketplace. The information included reports from the Med-QUEST Division, the Department of Human Services (DHS), the Department of Labor and Industrial Relation (DLIR), Milliman (one of the consultants for the State), rating data provided to us from carriers in the State, presentations of Hawai'i’s estimated uninsured population, reports from the Centers for Medicare and Medicaid Services (CMS), data from the US Census Bureau, the Medical Expenditure Panel Survey (MEPS), Dun and Bradstreet, annual statutory financial statements of insurers issuing policies in Hawai'i, and various other sources. As a simplified characterization of these data, we can best classify them as representing either Hawai'i’s population or an insuring entity covering Hawai'i’s residents and workers. In the sections below, we discuss our primary data sources for these two classifications of information.
Population Data
We relied on various data sources from the US Census Bureau in estimating both the overall size of the population in Hawai'i as well as in segmenting the market by characteristics such as type of insurance coverage, age, gender and income. Our primary source for these data was the American Community Survey (ACS).
As we have reviewed potential data sources for this and for similar projects, we felt it important that we have one primary data source as a starting point for our analysis. Had we instead relied on data from numerous independent sources as the basis for various aspects of our analysis, we would have faced potential inconsistencies in definitions, time periods and collection techniques among these various sources. As such, we found two primary data candidates for our analysis: the Current Population Survey (CPS) and the ACS. The CPS is conducted by the US Census Bureau and the Bureau of Labor Statistics. It includes interviews of 60,000
households and is primarily focused on reviewing employment levels. The ACS is also conducted by the US Census Bureau. It is sent to approximately 2.9 million housing units per year and gathers information that is only contained in the long form of the decennial census. We selected the ACS data for several reasons. First, there is a documented bias in most survey data where Medicaid enrollment is substantially lower than administrative counts. ACS applies logical edits to the data to adjust for this ‘Medicaid Undercount.’2 Second, the ACS questionnaire
includes the question: “Is this person CURRENTLY covered by any…health insurance or health
2
coverage plans?”3 (Emphasis is from the survey). In contrast, the CPS assesses insured status
over an entire year. The first presentation of the question is more consistent with our approach to the forthcoming migration modeling, as it examines a population at a point in time. Third, enrollees are legally obligated to respond to the ACS so, the response rate is quite high (i.e., 98% in 2009).4 The high response rate both helps to ensure precision of the survey data and
hopefully eliminates any potential bias in the Census Bureau’s methodology. Fourth, and finally, the ACS includes measures that permit the calculation of standard errors from the sample. We may find these capabilities helpful once we begin developing assumption ranges for the model. Although the ACS data possess many advantages, they also pose several challenges. We identify some of those challenges here. First, the ACS data are drawn from a small subset of Hawai'i’s households. The US Census Bureau then assigns weights to each respondent so that they are intended to characterize the entire population. The data present a less reliable picture of the population as questions become more specific. For example, if we wish to review broad income ranges for Hawai'i’s entire population, the ACS queried 13,615 individuals from whom we can assess those levels of income in 2010. We can be fairly certain that the income reported from those 13,615 individuals will be representative of the income for all of Hawai'i’s 1,363,621 residents in that year. However, if we wish to examine the income for the privately employed, uninsured population between the ages of 18 and 30, we have only 198 respondents during that same year from which to draw our conclusions. If only a few of these respondents have incomes that are very different from the population they are intended to represent, our conclusions could be skewed. As our questions become more specific the data become less reliable.
Second, because of these credibility issues and because the US Census Bureau includes an allocation methodology for those questions that a respondent might not address in the
questionnaire, the estimates will often differ from other credible data sources. For example, the following table shows several estimates of Hawai’i’s uninsured population as a percent of the total in 2010.5
Table 3.1
Study / Survey Uninsured
ACS 7.6%
Kaiser Permanente* 8.2%
Gallup Poll** 10.6%
*Hawaii's Uninsured Population Update, Lee, 2011
**http://www.gallup.com/poll/146579/texans-likely-uninsured-mass-residents-least.aspx
3
http://www.census.gov/acs/www/Downloads/questionnaires/2009/Quest09.pdf 4
http://www.census.gov/acs/www/methodology/response_rates_data/ 5
Please note that we have used 2010 ACS data in this report and in support of the model because the 2011 data will not be available until September or October 2012
As the table above shows, determining the number of uninsured in Hawai'i could largely depend on the data source reviewed. Between Gallup and ACS, there is a difference of about 40,000 individuals. The reader must understand that the data in some cases are subject to this degree of uncertainty. There will be no perfect picture of Hawai'i’s population at the end of the report. As we proceed with modeling the migration of these individuals across different modes of
insurance, it will be our task to assess the range of possible responses to the ACA’s incentives. It will also be our task to assess the range of possible error in the starting assumptions.
Additional Medicaid Edits
During our review of the ACS data, there were clear inconsistencies with two external sources. First, the Med-QUEST Division identified Medicaid enrollment at the beginning of 2010 totaling 254,000;6 the ACS data only accounted for 204,000 Medicaid enrollees. Second, statutory
financial statements filed by insurers in Hawai'i's market suggest that the ACS overstated those residents with Direct Purchase coverage by approximately 40,000.
We first note that Med-QUEST’s reports reflect what would seem to be the upper limit of possible Medicaid enrollment. Medicaid enrollees in households with enrolled children are passively re-enrolled.7 In addition to passive enrollment, there are other potential sources for
data differences. First, in the ACS, the US Census Bureau attempts to address the Medicaid undercount phenomenon identified above. However, their edits do not account for coverage of low-income childless adults. Although the ACS may do a good job of adjusting those enrollees that would traditionally qualify for Medicaid (e.g., Temporary Assistance for Needy Families (TANF), Supplemental Security Income (SSI)), they have no edits for non-traditional enrollees (e.g., those that would qualify for the QUEST-Net and QUEST-ACE programs). In addition, there may be Compact of Free Association (COFA) enrollees recognized in the Medicaid program that are not recognized in the ACS. According to DHS, they estimate that there are between 10,000 and 12,000 COFA enrollees with Medicaid coverage; ACS recognizes only 5,000. Third, with the disruption to the economy in 2008 and 2009, we would expect volatility (and thus, inconsistency) in enrollment estimates as the number of Medicaid covered persons grows.
Although we were unable to fully reconcile these Medicaid enrollment inconsistencies, we did reclassify a number of people in the ACS data into Medicaid that were not originally identified in that program. Specifically, we revised the insurance classification to “Medicaid” for individuals who indicated they had Direct Purchase coverage who also satisfied one of the following criteria:
Household earnings below 200% FPL (or whose income was not identified)
Under the age of 18 with household income less than 301% of FPL
6
http://www.med-quest.us/ManagedCare/MQDquestenroll.html; for 2012, the enrollment is closer to 287,000 7
Over the age of 17,8 not the primary resident, with household income over 200% of FPL, and
personal income less than $20,000
This process reclassified approximately 31,000 individuals from Direct Purchase to Medicaid. To support these modifications, we note (as indicated above) that the Direct Purchase counts in the ACS data were approximately 40,000 enrollees higher than what was shown in the publicly available financial statements for commercial carriers. We assumed that anyone eligible for coverage under QUEST-Net or QUEST-ACE would obtain that coverage rather than purchase an individual policy even if the coverage was not as comprehensive in 2010. We also assumed that any child eligible for CHIP would be enrolled in that program even if his or her parents had purchased an individual policy. Finally, we assumed that there may be persons who still reside with their parents, who do not qualify for coverage as a child under their parents' policies, and who can obtain coverage under QUEST-Net or QUEST-ACE.
In any other cases, when we have become aware of clear inconsistencies between the ACS data and an alternative, reliable source, we have presented that source and the possible consequences of these inconsistencies.
Medical Expenditure Panel Survey
We also used the Agency for Health Care Research and Quality’s MEPS data from 2010 to develop characteristics of Hawai’i’s small employer market. MEPS identifies key statistics for the small employer market by state, including employer offer rates, employee take-up rates and premiums by tier. All statistics in the MEPS data are available by various group sizes.
Annual Financial Statement Data
We used annual financial statements to identify total enrollment, premium, claims and other data for Hawai'i’s individual, small group, and large group insurance markets. Although we also reviewed prior years’ data, the primary source for this work was the 2010 and 2011 Annual Statutory Financial Statements filed on the Health or the Life, Accident and Health (LAH) Statement. To support new insurer reporting requirements, 2010 and 2011 Annual Statements include a new schedule, the Supplemental Health Care Exhibit. Insurers are required to report this schedule separately for each state in which they write comprehensive major medical
business.9 The Supplemental Health Care Exhibit reports detailed income statement data based
on individual, small group employer, large group employer, government business, other
business, other health and uninsured plans. Small group employers are defined as groups with up to 100 employees,10 except in states exercising an option under the ACA to define small
8
The coverage expansion for dependents to age 26 was implemented in September 2010. Because we are approximating the March 2010 population, we are segmenting dependents at age 18.
9
Experience for individual plans sold through an association or trust is allocated to the state issuing the certificate of coverage. Experience for employer business issued through an association or trust is allocated based on the location of the employer. Experience for group plans with employees in more than one state is allocated to state based on situs of contract.
10
groups as those with up to 50 employees until 2016. The large group employer category includes the Federal Employees Health Benefit (FEHB) program and state and local fully
insured government programs. We obtained access to the Annual Statutory Financial Statement data through a subscription service.
Carrier Data Call
In order to review the current product offerings, premiums and rating structures used by carriers offering coverage in the individual and small group markets, we issued a carrier data request. In this request, we asked that carriers in Hawai’i provide distributions of their enrollees by line of business; we also asked that they provide information about current rating practices.
This information enhanced several aspects of our background research related to the individual and small group markets. We note that in these assessments we supplemented this information with other information such as product brochures gathered from carrier’s websites. From these response data, we hope to assess the disruption that might occur in the market with the
implementation of the ACA.
As none of the sources of information described above contains a complete picture of the current market, we combined the data from each source to establish the 2010 baseline profile of Hawai'i’s insurance marketplace and individuals expected to be eligible for coverage through the Hawai'i Connector in 2014. To ensure data consistency, we compared various summaries of the data across independent sources. Our process of validating these data also highlighted how the various sources overlap and/or fit together and ensured the combined information on which the model estimates are based made sense. Where necessary, we smoothed results so that the final baseline profile presents a coherent, internally consistent picture of the current
environment.
Throughout this report, distributions based on FPL are built from the ACS's definition of income and FPL. Starting in 2014, the IRS will use a new definition of family size based on the number of personal exemptions that an individual claims on his or her tax return for determining eligibility for premium credits. However, we do not believe this change to the definition of household income will have a material impact on our findings.
While we have reviewed each of these data sources for reasonableness, and where
discrepancies arose we performed further investigation to reconcile any differences, we have not independently audited any of these data.
Finally, please note that some exhibits show population distributions where the figures are rounded. In several cases, the sum of the rounded values from those distributions may not equal 100%. We have tried to provide total estimates for these distributions, but the reader should be aware that the total estimates will not agree with the sum of each weight.
4
Overview of Hawai’i’s Current Health Insurance Market
Hawai'i's geography, significant military presence, employer regulations, and existing public programs make it unique among the states and how it will be affected by the ACA. In this section, we will discuss in more detail some of those qualities that make Hawai'i unique. We provide an estimate of how prevalent modes of coverage are employed among Hawai'i's
residents, and we introduce those components of the ACA that we expect will most influence the viability of the Hawai'i Connector.
The Hawai'i Connector is intended to provide a robust marketplace where individuals and small employers will be able to shop for health coverage. Additionally, it is expected to provide greater transparency for these purchasers by grouping plans with similar actuarial values and clearly indentified premiums. The viability of the Hawai'i Connector will depend both on the number of participants and the willingness of carriers to offer coverage through them.
There are numerous distinguishing features that make Hawai'i unique among the states. Although we will use later sections to explore some of these features in more depth, there are three features of Hawai'i's health insurance market that we introduce here. First, Hawai'i has a much larger military presence as a percentage of the population than the rest of the country. As of 2010, the ACS data show that nearly 7% of Hawai'i's population received health coverage through the military; less than 2% of the nationwide population is insured through military coverage.
Second, Hawai'i's Prepaid Health Care Act (PHCA) ensures that employers in the State provide coverage to their workers at a much higher rate than do employers in the rest of the country. According to the ACS, nearly 60% of Hawai'i's residents (both active and retired) receive some level of coverage through an employer (e.g., their employer, their spouse’s employer, etc.). For the country as a whole, 53% of individuals obtain coverage from an employer. We anticipate that the presence of the PHCA will strongly affect how the ACA influences Hawai'i's health insurance marketplace.
Third, Hawai’i already has experience with an expanded Medicaid program. Hawai’i’s QUEST program began as a demonstration waiver (1115a) in August 1994. And through the QUEST-Net and QUEST-ACE programs, Hawai’i has provided some level of coverage to low-income, childless adults. Although the total percentage of the State’s population in Medicaid is
comparable to the rest of the country, there are far more adults in Hawai'i's Medicaid program. As a consequence of these three dynamics, Hawai'i also has a much lower rate of uninsured persons than the rest of the country. The following table shows our estimates of enrollment in
2010 both for Hawai'i’s residents and the country as a whole. (Please note that the estimates of persons and standard deviations are in 1,000’s).
Table 4.1
Coverage Summaries (in 1,000's)
Coverage Persons Distribution Stand Dev +/- Persons Distribution Stand Dev
+/-Employer (non-Medicare) 717 52.6% 4.7 148,868 48.2% 70.9
Employer (Medicare) 95 7.0% 1.3 13,668 4.4% 16.6
Military (Active) 93 6.8% 2.3 5,236 1.7% 17.5
Military (Retired) 1 0.1% 0.2 357 0.1% 3.3
Direct Purchase 44 3.2% 1.6 16,616 5.4% 34.0
Medicare 77 5.6% 1.4 22,455 7.3% 20.0
Medicaid 193 14.2% 3.5 43,541 14.1% 49.9
Dual 39 2.9% 1.4 9,815 3.2% 19.2
No Coverage 104 7.6% 2.2 48,257 15.6% 48.1
Total 1,363 100.0% 308,813 100.0%
2010 American Community Survey – Person Level Data, http://www2.census.gov/acs2010_1yr/pums/
Hawai'i Nation
Based on the hierarchy that we applied to the ACS data, the table shows that approximately 104,000 residents of Hawai'i are uninsured. As a percentage of the population, the 7.6% estimate of the uninsured also compares favorably with an estimate prepared by the Kaiser in 2010.11 Next, the table shows that approximately 211,000 residents are covered by Medicare
(i.e., retirees with employer administered benefits, those with Medicare alone and those residents dually eligible for Medicare and Medicaid). We do not expect the presence of the Hawai'i Connector to substantially affect the coverage for those residents under Medicare or TriCare. Also, the estimate is consistent with estimates of the Medicare eligible population as identified by CMS (i.e., 204,000).12 The table shows that the number of residents covered by
Direct Purchase insurance is approximately 44,000. This is somewhat higher than the membership (i.e., 31,000) reported in 2010 statutory financial statements by insurance companies with products in Hawai'i. There are multiple reasons why these enrollment figures may be higher than expected. For example, the ACS data may include persons who have
11 Lee, Dr. Sang Hyop. 2011. Hawai’i’s Uninsured Population Update. Kaiser Permanente.
12
http://www.cms.gov/Research-Statistics-Data-and-Systems/Statistics-Trends-and-Reports/MCRAdvPartDEnrolData/MA-State-County-Penetration-Items/CMS1234724.html
coverage through COBRA (who should be classified as ESI). Finally, the table shows that Hawai'i's Medicaid enrollment was approximately 232,000 in 2010 (Medicaid eligible and dually eligible residents). As discussed in the Data section, this estimate is lower than what is directly reported by the Med-QUEST Division, but higher than what is reported in other survey data. Because residents can reflect multiple modes of insurance through the ACS, we must classify these individuals into a single category to ensure that we do not double count them. Our hierarchy is very aggressive in assigning enrollees to Medicaid.13 That is, the hierarchy automatically assigns enrollees to Medicaid if they show any indication of Medicaid coverage. We have not removed anyone from these estimates; so, they may be somewhat different than what is shown on the US Census Bureau's website. Finally, in addition to best estimates, we have included estimates of standard deviation; the ACS provides the tools to prepare these measures. As we model migration, we can employ ranges implied by these statistics to reflect potential statistical error in our starting assumptions.
Key Provisions
There are several key elements of the ACA that we expect will affect how individuals move between their current coverage (or non-coverage) and other coverage modes. As we reviewed Hawai'i’s population, we tried to identify those characteristics that would most likely interact with the provisions of ACA. In the following paragraphs, we describe the provisions on which we put particular weight.
The ACA introduces a number of new rating requirements for insurers offering coverage in the individual and small group markets beginning in 2014. Specifically, insurers will no longer be allowed to deny coverage for pre-existing conditions, they will no longer be allowed to rate based on morbidity, gender, industry or group size, and they will be limited in how they are allowed to vary rates based on age.
In general, the ACA's restrictions will have the effect of increasing rates for the young, for males in younger age ranges and for the healthy. They will likely also lower rates for the elderly, for females in younger age ranges, for the unhealthy and for those in very small groups or industries that tend to exhibit higher than average morbidity. These restrictions will limit the extent to which carriers can reflect differences in risk when setting premium rates. (Over time, and in the absence of other requirements, these new restrictions may drive the young and the healthy out of the market or to alternative sources of coverage. The Department of Health and Human Services (HHS) is attempting to mitigate these dynamics in the individual and small group markets by implementing a risk sharing mechanism that will require insurers with healthy enrollees to subsidize insurers with less healthy enrollees. From 2014 to 2016, a transitional reinsurance program is also being implemented in the individual market to help reduce rate
13
shock that might otherwise occur due to high risk individuals entering that market. These programs will be available for plans in the individual and small group markets.)
In addition, the government will now levy annual fees on health insurers of $8 billion starting in 2014 and increasing to $14.3 billion by 2018.14 The fees will be apportioned based on the
insurer’s market share, with tax exempt insurers considering only 50% of premium in calculating market share and self funded plans excluded. State managed Medicaid programs and Medicare Advantage plans will also be subject to these fees. Much of the ultimate cost of these fees will likely either be passed on to the insurers’ members or put additional pressure on state Medicaid budgets. Some parties have estimated the effect of these fees on premiums to be in the range of 2% to 3%.15
Under the ACA, insurers must offer qualified health plans, which satisfy requirements related to marketing, networks, covered benefits, etc. In addition, insurers must offer coverage for these qualified health plans with cost sharing at specific actuarial values. The law identifies these values as Platinum, Gold, Silver, and Bronze (with corresponding actuarial values of 0.9, 0.8, 0.7, and 0.6, respectively). Insurers must offer both Silver and Gold plans if they participate in the Exchange.
Central to the ACA is an individual mandate that imposes a penalty or tax for those individuals who do not maintain minimum essential coverage. The mandate is not universal and provides an exemption for certain low-income individuals who cannot afford coverage (those where the cost of coverage is more than 8% of their income).16 The penalty is a flat payment of $95 in
2014, $325 in 2015 and $695 in 2016 (on an individual basis), or alternatively, it is a percentage of the household income (1.0% in 2014, 2.0% in 2015, and 2.5% in 2016) with the tax reflecting the larger amount. For a single individual earning $25,000 per year (or approximately 220% FPL in 2010), the penalty would be the following:
Table 4.2
ACA Individual Mandate Example
2014 2015 2016
Income* $25,000 $25,000 $25,000
Flat Tax Amount $95 $325 $695
Percentage 1.0% 2.0% 2.5%
Dollar Amount $250 $500 $625
Resulting Tax $250 $500 $695
*Assumes no wage inflation
14
The Health Care and Education Reconciliation Act, Subtitle E, Section 1406
15 http://americanactionforum.org/sites/default/files/Case%20of%20the%20Premium%20Tax.pdf
16
Exemptions include those below with income below the filing threshold, those belonging to Native American tribes, those in prison, undocumented individuals, those with hardship exemptions, and those with religious exemptions.
Please note that our micro-simulation model reflects individual preference regarding the value of coverage and its cost relative to fees for being uninsured.
The ACA will provide tax credits to eligible individuals and families with incomes up to 400% of FPL toward the purchase of a qualified health insurance plan through the Hawai'i Connector. Credits will be determined based on the Silver plan in the Connector with the second lowest premium. The credits will be set so that the premium will be limited to a certain percentage of income (on a sliding scale). The following table shows sample income and tax credit levels for an individual related to a theoretical plan level with a monthly premium of $430:
Table 4.3
Sample Income and Tax Credit Levels
Sample FPLs Income Plan Cap % Plan Cap $ Plan Cost* Tax Credit
133% 14,815 2.0% 296 5,160 4,864
175% 19,493 5.2% 1,004 5,160 4,156
225% 25,063 7.2% 1,798 5,160 3,362
275% 30,632 8.8% 2,688 5,160 2,472
325% 36,202 9.5% 3,439 5,160 1,721
*Assuming this represents the cost for the second lowest cost Silver plan sold through the Connector
Ultimately, the individuals are not obligated to participate in a certain plan level. They may participate in a plan with additional benefits or lower cost sharing, but the tax credit will be calculated relative to the plan index cost (i.e., the Silver plan in the Hawai'i Connector with the second lowest premium).
The ACA requires an annual assessment from large employers (those with 50 or more full-time equivalent employees) that do not offer minimum essential health coverage to their employees. This assessment is equal to $2,000 per employee with a disregard for the first 30 employees. For example, an employer that did not provide coverage to its 250 full-time employees would face a penalty of $440,000 = (250 – 30) x $2,000. Similarly, large employers that do offer coverage and whose employees enroll through the Connector (as a result of eligibility for tax credits) will face an assessment of $250 per month for each month the employee receives coverage through the Connector. In a following section, we discuss the provisions of Hawai'i's PHCA and the incentives that it provides employers. We expect that the PHCA provisions will mitigate the effect of any employer penalty for non-coverage in the ACA.
Beginning in 2014, the ACA extends Federal funding to states that provide Medicaid coverage to individuals who are not Medicare eligible and have incomes below 138% of FPL (133% of FPL with a 5% disregard), regardless of their assets. Hawai’i already has expanded coverage for these childless, low-income adults, and the Federal government will pay a larger share of the cost for covering these individuals starting in 2014 (with funds increasing to 90% by 2020). Effective July 2012, Hawai'i introduced changes to the Medicaid program and how it provides
coverage to childless adults. In particular, the State decreased eligibility income thresholds for childless adults from 200% of FPL to 133% of FPL.
There are a number of other changes to the Medicaid program under the ACA. In particular, it requires that Hawai'i be able to enroll Medicaid eligible residents in Medicaid through the Hawai'i Connector (if that person is found to be eligible as a result of application for coverage through the Connector).
The ACA also provides states the option of establishing a Basic Health Program (BHP) under which a state may enter into contracts for offering one or more health plans providing at least the essential health benefits to eligible individuals.17 The BHP is intended to smooth the
transition between Medicaid and commercial coverage for those enrollees between 138% and 200% FPL (and below 133% FPL for lawfully present immigrants). There is evidence that this population transitions in and out of Medicaid eligibility with some frequency — the BHP is designed to ensure that there is limited disruption in coverage or access.
17
Eligible individuals are those with incomes between 133% and 200% of FPL (below 133% of FPL for lawfully present immigrants), are not eligible for Medicare, and do not have access to affordable ESI that provides minimum essential coverage.
5
Hawai’i’s Private Employer Market
In this section, we examine Hawai'i’s private employer market. We first present specific
provisions of the PHCA. An understanding of the PHCA and how it interacts with the ACA will be critical in anticipating employers’ responses to the new health reform law. We also examine new incentives facing Hawai’i’s employers under the ACA. Next, we present characteristics of
Hawai'i’s employers and their employees without regard to insurance coverage status. We then examine the subset of workers that have employer sponsored insurance (ESI) coverage. Finally, we present new small group rating requirements under the ACA.
Prepaid Health Care Act
The PHCA was enacted in 1974, and although it does not apply to government workers and certain other industries (e.g., seasonal agricultural workers); it has a substantial effect on Hawai'i's ESI market. The PHCA requires that applicable employers in Hawai'i provide health care coverage to employees who work twenty hours per week and earn 86.67 times Hawai'i's minimum wage over the course of a month. These coverage requirements begin after an employee has worked for his or her employer for four consecutive weeks.
The PHCA also prescribes certain other requirements. For example, all benefit designs must meet certain minimum standards as determined by the DLIR. The DLIR makes this
determination with the assistance of a PHC Advisory Council, which is made up of
representatives of various groups. The minimum standards for benefit designs apply to both self-funded employers and those purchasing coverage from insurers. Employers can offer a 7a plan (the prevalent plan), which includes benefits equal to or better than those offered by the plan with the most subscribers in the State. Currently, the prevalent PPO plan has a $100 deductible and 90% in-network coinsurance (with some services at 80%), and under it, the employer is not obligated to pay for any part of dependent coverage.18 Alternatively, employers
can offer a 7b plan, which has a more limited benefit design than the prevalent plan. However, employers that offer the 7b plan are then obligated to pay 50% of the dependent premium. Currently, the 7b plans have a $300 deductible and 80% coinsurance.
Under certain circumstances, employees can waive the mandated coverage. If, for example, an employee is covered through Medicaid, Medicare, or an approved plan, they can complete a notification form for their employer, effectively exempting the employer from its health care coverage responsibilities under the PHCA. However, if the employer does provide coverage, not
18
only must the coverage satisfy minimum benefit requirements, it must satisfy certain contribution requirements as well. Under the PHCA, employees can be required to contribute up to the lesser of 50% of plan cost or 1.5% of income; for most employees, contributions will almost always be capped at 1.5% of income. This contribution requirement is critical in understanding how the ACA will affect employee behavior. Employees will only be eligible for tax credits in the individual exchanges if they can demonstrate that their contributions for employer sponsored coverage are more than 9.5% of their income. Consequently, anyone whose employer complies with the PHCA is unlikely to qualify for tax credits in the Connector.
The PHCA imposes certain penalties for employers that do not comply.19 For example, an employer that does not provide coverage to eligible employees will be penalized $1 per day per employee for the time during which they were non-compliant. Also, an employer that willfully fails to comply with any provision of the PHCA can be fined $200 for each violation. Perhaps the most compelling provision is the following: any employer who fails to provide coverage to eligible employees will be liable to pay for health care costs incurred by these employees during the period in which the employer was non-compliant. An employer that does not provide coverage to an eligible employee faces significant risk if the employee becomes ill. In addition to the financial incentives for providing coverage, there is also likely additional difficulty in attracting employees that might have other job opportunities with employers that do offer coverage.
Based on discussions with the DLIR, we suspect that neither the 7a plan (i.e., the Prevalent Plan) nor the 7b plan will have an actuarial value near 70%, which is the actuarial value of plans at the silver metallic level. The ACA requires that carriers offer plans that provide the essential health benefits package. Based on discussions with the DLIR, some carriers currently offer parts of this package (e.g., prescription drug coverage) as a rider; they will no longer be able to
market any parts of the EHB package as an add-on.
Because of the presence of the PHCA, employers in Hawai’i may be less likely than those in other states to terminate their coverage. Because many more residents of Hawai’i obtain their coverage through their employer, the Connector (i.e., the individual Exchange) may have lower participation (as a percentage of the total population) than will the Exchanges in other states. If this high coverage rate among employers persists, fewer Federal funds in the form of tax credits would come into the State. In addition, the cost per enrollee to run an Exchange will be higher with fewer enrollees.
Employer Incentives
The ACA introduces several new rating requirements for insurers. Although we have discussed some of these requirements in a previous section, we continue our discussion of specific
requirements in this section. In general, the new regulations are expected to increase premiums for some groups and decrease them for others. The premium disruption will depend on the
19
demographic composition of the group, the group’s current morbidity load, and the efficacy of a new risk sharing mechanism. This new risk sharing mechanism will require small group insurers with healthy enrollees to subsidize insurers with less healthy enrollees.
The ACA includes other provisions that will affect premiums in the group market. First, the government will assess new fees against insurers; as previously identified, some estimate that these will be in the range of 2% to 3% of premium.20 In addition, there are several other new
taxes and fees (such as fees assessed on pharmaceutical manufacturers and a 2.3% excise tax on medical devices) that will affect premium.
In the short-term, some small employers will receive incentives in the form of tax credits to offer coverage to their employees.21 Employers with fewer than 25 full-time employees who have an
average annual salary of less than $50,000 and pay at least 50% of the single premium for health insurance can receive a tax credit up to as much as 35% of the employer’s contribution (25% if the employer is a non-profit) in 2010 through 2013. The maximum credit is available to employers with less than ten full-time employees and an average annual salary of less than $25,000. The credit is phased out as the number of full-time employees increase to 25 and the average annual salary increases to $50,000. In 2014 and later, employers can take the tax credits for two consecutive years, after which no additional credits are available. In these years the maximum credit is increased to 50% of the employers’ contribution, with a similar phase-out schedule based on employer size and average payroll as occurs between 2010 and 2013. Although the presence of the PHCA will likely minimize coverage attrition (among those employers to which it applies), the ACA introduces some incentives for employers to drop coverage. For example, most low-income individuals will be eligible for tax credits if they purchase coverage directly through the Connector. An employer with many low-income
employees may find that it is less costly to pay the penalty and simply provide their employees with additional compensation to cover the cost of the unsubsidized portion of the premium. In this case, these subsidy-eligible employees that purchase individual coverage in the Connector might also qualify for cost-sharing subsidies. As specified though, the presence of the PHCA will likely eliminate this option for many employers.
Hawai’i’s Private Employer Market
As we review Hawai’i’s ESI market, it will be important that we understand the composition of those employers participating in it. When looking at distributions of private workers in each industry across the island groups, there is a clear difference in the geographic concentration of those workers. The following table shows that distribution.
20
http://www.ahipcoverage.com/wp-content/uploads/2011/11/Insurer-Fees-report-final.pdf
21
Table 5.1
Employee Distribution by Industry
Industry
Industry Oahu Hawai'i Kauai, Maui, Molokai Distrubtion
Agr, Mining, Util 37.4% 33.7% 28.9% 2.8%
Const & Manu 60.6% 19.3% 20.1% 13.8%
Trade 70.7% 14.0% 15.3% 16.8%
Transp, Info, Finan 75.0% 8.6% 16.4% 11.5%
Real Estate 61.3% 11.2% 27.5% 3.8%
Prof, Sci, Tech 71.4% 10.2% 18.4% 5.3%
Mang, Admin Srv 57.4% 17.2% 25.5% 6.1%
Education 79.7% 14.7% 5.6% 3.6%
Health & Soc Srv 77.1% 11.8% 11.1% 12.1%
Arts, Ent, Food, Other 64.0% 13.5% 22.5% 24.1%
Total 67.2% 14.2% 18.6% 100.0%
2010 American Community Survey – Person Level Data, http://www2.census.gov/acs2010_1yr/pums/ Island
The table shows the distribution of persons employed in each industry group for all islands (rightmost column); it also shows the distribution for a specific industry across each island group. For example, the column at the right shows that 2.8% of the total privately employed population is in agriculture, mining or utilities. While the preceding columns show that approximately the same number of people across each island group are employed in agriculture, mining, and utilities (at 37.4%, 33.7%, and 28.9% in Oahu, Hawai’i, and the remaining islands, respectively).
There are several notable observations from the preceding table. First, Oahu has a higher concentration of persons employed in transportation, information, and finance, as well as education and health and social services (75.0%, 79.7%, and 77.1% respectively versus 67.2% for all industries in total). Second, the other islands have a higher concentration of persons employed in construction, manufacturing and real estate as well as in agriculture, mining and utilities. For many in this second group, the PHCA does not apply. Businesses employing seasonal agricultural workers or real estate salespersons paid by commission are exempt from the law (as it applies to those workers). As such, a higher proportion of workers outside Oahu may decide to take advantage of subsidies available through the Exchanges.
As part of Oliver Wyman’s micro-simulation model, we create theoretical (or synthetic groups) for estimating the possible effects of various elements of the ACA. In creating these groups, we pool persons with the same industry type; as a consequence, we are able to tailor other
assumptions, like group size or participation, to specific industries. The distributions in the preceding table are critical in creating these synthetic groups.
The ACS also permits us to examine coverage status by industry for employed persons.
Table 5.2
Coverage Status by Industry
Industry with ESI FT Uninsured PT Uninsured Other Cov Total
Agr, Mining, Util 70.2% 5.8% 5.7% 18.3% 2.8%
Const & Manu 64.9% 7.2% 8.2% 19.7% 13.8%
Trade 69.8% 3.9% 5.9% 20.4% 16.8%
Transp, Info, Finan 75.1% 4.3% 4.7% 15.8% 11.5%
Real Estate 69.8% 2.4% 4.4% 23.4% 3.8%
Prof, Sci, Tech 69.6% 4.9% 4.6% 20.8% 5.3%
Mang, Admin Srv 65.0% 7.3% 10.0% 17.7% 6.1%
Education 72.1% 1.3% 4.2% 22.4% 3.6%
Health & Soc Srv 78.0% 2.9% 3.4% 15.7% 12.1%
Arts, Ent, Food, Other 66.7% 4.7% 8.4% 20.2% 24.1%
Total 69.8% 4.6% 6.4% 19.1% 100.0%
2010 American Community Survey – Person Level Data, http://www2.census.gov/acs2010_1yr/pums/
As with the preceding table, the distribution in the rightmost column shows private employment by industry. Each column on the rows preceding those entries show how the employed
population is distributed for each specified status. For example, the table indicates that 12.1% of privately employed persons work in health and social services. Among those employed persons, 78% have health insurance through an employer.
Please note that we identify full-time workers as those who have worked 35 hours or more in the week preceding the response to the ACS questionnaire. The ACS does not provide information with the detail that would be necessary to assess coverage eligibility under the PHCA. Also, the ACS does not specify whether coverage is obtained through the respondent’s employer or someone else’s employer. For example, a real estate agent might have coverage through his wife who works as a health care worker. This theoretical person would contribute weight to the ‘real estate employee with ESI’ cell even though the coverage in that case is not truly associated with the industry. (We do not think this introduces error unless there is reason to suspect a systematic bias in coverage. For example, if we thought most real estate agents were married to health care workers, such a dynamic could produce a bias in our estimates.)
On average, about 69.8% of private employees have coverage through an employer. The table identifies some industries in which workers are more likely to be covered by an employer (e.g., health and social services at 78.0% and transportation, information, and finance at 75.1%). We have already noted geographic differences in distributions of employment by industry. It is not clear that persons are more or less likely to have coverage because of the industry in which they work (e.g., health and social services) or because of the place in which they work (e.g., Oahu).
Data sources beyond the ACS allow us to examine other characteristics of Hawai’i’s private employer market. The following table is from the 2010 MEPS data summaries, and it shows distributions of private employees by group size.
Table 5.3
Group and Employee Distributions (Private) Organization
Employees Groups Employees Groups Employees
2 to 9 55% 12% 58% 12%
10 to 24 13% 9% 12% 9%
25 to 99 10% 18% 8% 14%
100 to 999 8% 19% 7% 18%
1,000 or more 15% 42% 15% 47%
2010 Medical Expenditure Panel Survey – http://meps.ahrq.gov/mepsweb/data_stats/state_tables.jsp Nationwide Hawai'i
Please note the group size classifications are determined at the organization level. For example, the employees at a large chain, fast food restaurant might be classified in the largest group size even though the particular establishment responding to the MEPS questionnaire might only employ a few dozen people.
Although employers in the mid group market (i.e., 25 to 99) are proportionally larger in Hawai’i than in the country as whole, the table shows that the composition of groups by organization size in Hawai'i is very similar with the nationwide composition. The MEPS data yield some other interesting observations about Hawai’i’s private employers. For example, MEPS reports the average nationwide single premium as $4,940 for employees at establishments that offer coverage. In Hawai’i, the corresponding single premium estimate is $4,294; this estimate is also reported with an average deductible estimate that is lower in Hawai’i than in the country as a whole.
The following table, also from the 2010 MEPS data, highlights how unique coverage rates are in Hawai’i’s employer market relative to the country as a whole. Coverage is offered at a much higher rate in all group sizes. In total, 84.7% of employers in Hawai’i offer coverage, while only 53.8% of employers nationwide do. This difference is particularly striking among groups with fewer than 25 employees. In Hawai’i, 77.2% employers in this segment offer coverage; for the whole country, 36.7% of employers in this segment offer coverage. As a consequence, a larger percentage of small group employees will likely be eligible to enroll in the Hawai’i SHOP
Exchange than will employees of groups this size in other states. However, the ultimate decision to enroll in the SHOP lies with the employer; even if the potential market for the SHOP is
relatively large, potential enrollment is no guarantee of participation. The enrollment will ultimately depend on the SHOP’s appeal to employers.
Table 5.4
Employee Contribution Rates
Hawai'i
Employer % of Establishments
Size Offering Coverage Contribution % of Total Contribution % of Total
2 to 9 73% $223 5% $1,330 11%
10 to 24 94% $108 2% $2,327 20%
25 to 99 100% $266 6% $3,112 26%
100 to 999 100% $597 14% $4,945 41%
1,000 or more 100% $633 15% $3,060 25%
Nationwide
Employer % of Establishments
Size Offering Coverage Contribution % of Total Contribution % of Total
2 to 9 32% $857 16% $3,208 24%
10 to 24 61% $889 18% $4,427 33%
25 to 99 81% $1,009 21% $4,574 35%
100 to 999 95% $1,081 21% $4,050 29%
1,000 or more 100% $1,044 21% $3,443 24%
2010 Medical Expenditure Panel Survey – http://meps.ahrq.gov/mepsweb/data_stats/state_tables.jsp
Employee Family
Employee Family
In addition to showing offer rates, the table also shows annual employee contribution rates for single and family coverage. In particular, the average contribution rates for single employees are lower for all group sizes in Hawai’i than they are nationwide. The table also shows that average family contribution rates for groups with 100 or more employees are higher in Hawai’i than they are nationwide. We suspect that these higher contribution rates are present because the PHCA does not require employers to contribute to dependent coverage under the prevalent plan. According to the MEPS data, 98% of all employees working for a private employer in Hawai’i work for an employer that also offers coverage. Of those employees, only 80% are eligible for coverage, and of those that are eligible, only 84% enroll in the plan. This means that 67% (= 80% x 84%) of employees working for a private employer offering coverage are actually enrolled in the plan. The corresponding estimate for employees nationwide is 60%. For the whole
country, 78% of employees that work for employers offering coverage are eligible; of these nationwide employees, only 77% of them actually enroll. Not only do more employees in Hawai’i work for employers offering coverage, but those that are eligible, enroll at a higher rate (84% versus 77%).
There are several possible reasons why only 84% of the employees in Hawai’i who are eligible for coverage are enrolled. First, some may find that coverage offered through their spouse’s employer is more affordable (e.g., $0 premium). Further, some employees, particularly those in
good health, may perceive the value of coverage to be less than the cost. Finally, some employees may have coverage through other means (e.g., through Medicaid).
The table below shows the distribution of the previously mentioned 67% enrollment rate in Hawai’i and the 60% enrollment rate nationwide by group size. The table shows that, for both large and small groups, the enrollment rate for private sector employees who are offered ESI coverage is higher in Hawai’i than it is for the nation as a whole. This higher rate of enrollment is principally due to higher take-up of coverage among employees that are eligible for it.
Table 5.5
ESI Coverage by Group Size Among Private Sector Employees
Distribution % Covered Distribution % Covered of Employees by Employer of Employees by Employer Group Size
2 to 9 12% 72% 12% 64%
10 to 24 9% 70% 9% 57%
25 to 99 18% 71% 14% 56%
100 to 999 19% 69% 18% 58%
1,000 or more 42% 62% 47% 61%
SG & LG
0 to 49 29% 70% 28% 59%
50 or more 72% 65% 73% 60%
Total 100% 67% 100% 60%
2010 Medical Expenditure Panel Survey – http://meps.ahrq.gov/mepsweb/data_stats/state_tables.jsp Nationwide Hawai'i
It is also worth noting that a larger proportion of Hawai’i’s private employees work in groups with 25 to 99 employees (relative to the nation as a whole), while there is a lower representation of private employees in groups with 1,000 or more employees.
In addition to examining employers and their coverage tendencies, it is also important to examine the characteristics of the Hawai’i’s employees that are covered by ESI. The following table shows the distribution of active employees of groups by age and gender:
Table 5.6
ESI Enrollment Rates (Active Private Employees)
Age Band Male Female Male Female
0 to 17 11.7% 10.7% 12.6% 12.0%
18 to 24 4.8% 3.9% 4.7% 4.7%
25 to 29 3.5% 3.7% 3.2% 3.6%
30 to 34 3.9% 3.7% 3.6% 3.9%
35 to 39 4.7% 4.1% 3.9% 4.2%
40 to 44 4.1% 4.7% 4.3% 4.5%
45 to 49 4.8% 4.7% 4.6% 5.0%
50 to 54 4.4% 5.0% 4.6% 5.0%
55 to 59 4.3% 4.6% 4.0% 4.4%
60 to 64 3.9% 4.1% 3.3% 3.5%
65+ 0.4% 0.5% 0.3% 0.3%
Total 50.5% 49.5% 49.1% 50.9%
2010 American Community Survey – Person Level Data, http://www2.census.gov/acs2010_1yr/pums/
Hawai'i Nationwide
As the table shows, there are not substantial differences between Hawai'i's age and gender composition and the composition for individuals from the rest of the country. Other than
enrollment of child dependents, the number of persons covered by ESI appears to peak around the 45 to 54 age ranges. We also note that, with some minor exceptions, enrollment for men and women tracks very closely between Hawai’i and the nation as a whole.
In addition to demographic estimates, we can also examine coverage through ESI by income level. The following table shows the distribution of active employees of private groups by their relationship to FPL:
Table 5.7
ESI Coverage (in 1,000's)
FPL Persons Percentage Persons Percentage
0 to 100% 36 5.0% 7,704 5.2%
101% to 138% 17 2.4% 4,214 2.8%
139% to 200% 37 5.2% 11,173 7.5%
201% to 300% 113 15.8% 24,231 16.3%
301% to 400% 137 19.0% 25,214 16.9%
401% + 377 52.5% 76,332 51.3%
2010 American Community Survey – Person Level Data, http://www2.census.gov/acs2010_1yr/pums/
Hawai'i Nationwide
Consistent with the country as a whole, Hawai’i’s residents with ESI are weighted toward the higher income ranges specified here. Given the contribution requirements of the PHCA, it is somewhat surprising that there are not more ESI enrollees at the lower income levels. In fact,
the table shows that there are a higher proportion of individuals with ESI at the higher income ranges (i.e., above 300% of FPL) in Hawai’i than in the rest of the country.
Fully Insured Group Coverage Offered in Hawai’i
Beginning in 2011, the ACA implemented rules that require carriers to meet new minimum loss ratio requirements separately for the small group and large group markets. Carriers that do not meet the loss ratio requirements must refund premiums to policyholders. In order to support enforcement of these new rules, Statutory Financial Statements now include a Supplemental Health Care Exhibit that permits review of each carrier’s experience by line of business. The following table provides a summary of the 2011 large group experience (51 employees or more) for each carrier in the Hawai’i market.
Table 5.8
Large Group Carriers
Member Premium Claims Loss
Carrier Months PMPM PMPM Ratio
Hawai'i Medical Services Assn 3,928,805 $275.45 $247.95 90%
Kaiser Foundation Health Plan Inc 1,625,121 305.09 295.66 97%
University Health Alliance 223,800 129.42 118.77 92%
Hawai'i Management Alliance Assn 228,897 227.04 204.12 90%
Kaiser Permanente Ins Co* 80,186 66.71 58.66 88%
Total 6,086,809 $273.42 $251.79 92%
Average 507,234
*Kaiser Permanente is part of Kaiser Foundation Health Plan, but files separately for their OON POS benefits 2011 Annual Statutory Financial Statements, Supplemental Health Care Exhibit
The table shows that approximately 507,000 individuals were covered under a fully insured large group policy in 2011. These individuals are covered by five carriers (under four organizations) that filed statutory financials for group business in Hawai'i. Of those five, over 90% of individuals covered in large groups are covered by the top two carriers, Hawai'i Medical Services
Association and Kaiser Foundation Health Plan, Inc. Although there is some variation of loss ratio by carrier, the aggregate loss ratio is consistent with our expectations for large group blocks of business. (Please note member months reflect covered individuals, not employees) Although reported premiums vary by insurer, it is important to note that the premiums in the table above reflect the underlying differences in demographics and benefits.
For several reasons, we anticipate that a majority of the individuals covered by large groups are unlikely to participate in the Connector or the SHOP (at least until 2017). First, states may expand the SHOP to include large employers starting 2017, but until then, large groups are not eligible to enroll in them. Second, the PHCA provides large employers significant financial incentives to maintain coverage for their employees. It is unlikely that these groups would drop coverage and move the enrollees into the individual Connector.