SP Betting as a Self-Enforcing Implicit Cartel
by Adi Schnytzer
and Avichai Snir
Department of Economics Bar-Ilan University
Ramat Gan Israel 52800
e-mail: [email protected] [email protected] Abstract
A large share of the UK off-course horse racing betting market involves winning payouts determined at Starting Prices (SP). This implies that gamblers can bet with off-course bookies on any horse before a race at the final pre-race odds as set by on-course bookies for that horse.
Given the oligopolistic structure of the off-course gambling market in the UK, a market that is dominated by a small number of large bookmaking firms, we study the phenomenon of SP as a type of self-enforcing implicit collusion. We show that given the uncertainty about a race outcome, and their ability to influence the prices set by on-course bookies, agreeing to lay bets at SP is superior for off-course bookies as compared with offering fixed odds. We thus extend the results of Rotemberg and Saloner (1990) to markets with uncertainty about both demand and outcomes,
We test our model by studying the predicted effects of SP betting on the behavior of on-course bookies. Using data drawn from both the UK and Australian on-course betting markets, we show that the differences between these markets are consistent with the predicted effects of SP betting in the UK off-course market and its absence from the Australian market.
A. Introduction1
It is often argued that horse betting markets share many common features with financial markets (Thaler and Ziemba, 1988, Shin, 1992, 1993, Vaughan Williams and Paton, 1997, among others). In both markets, well informed participants trade risky assets, and intermediaries play an important role in setting prices (Shin, 1992). At the same time, unlike more complicated financial markets, betting markets are bounded in time and yield a single and unequivocal outcome. Thus, betting markets "provide a clear view of pricing issues which are more complicated elsewhere" (Sauer, 1998, p. 2021).
In this paper we study the UK market for SP betting on horse races. In the UK, bettors may place bets with bookmakers both at the track (on-course bookmakers) and in bookmakers' offices around the country (course bookmakers). Most of the off-course betting is carried out at Starting Prices (SP),2 which are the odds offered by on-course bookmakers at the end of the betting period. Thus bettors who bet at SP are not only gambling on the outcome of the race, but also on the returns.3 SP betting also seems to be risky for off-course bookmakers: Whereas on-course bookmakers hedge against the contingency of having a large share of the bets placed on high odds horses by continually adjusting odds, off-course bookmakers do not have direct control over SP. Offering bets at SP thus seems to be inconsistent with common models that view the bookmakers' target function as either guaranteeing profit at minimum risk or maximizing profits by outperforming bettors (Crafts, 1985, Vaughan Williams and Paton, 1997, Lee and Smith, 2002, Levitt, 2003, Strumpf, 2003)
To explain why SP betting is nevertheless the preferred form of betting in the UK, we develop a model that focuses on the concentrated structure of the UK off-course market. In our model there are two types of bookmaker: Large off-off-course bookmakers with the ability to influence market outcomes and small on-course bookmakers who operate in competitive markets. Our results imply that in
equilibrium, the off-course bookmakers may choose to collaborate implicitly and sell bets at SP. Owing to the tacit collusion, SP betting allows the off-course bookmakers
1
The authors wish to thank Arthur Fishman, Han Guowen and Daniel Levy for their helpful comments.
2
Dowie (1976), for example, estimates that 95% of the off-course betting are made at SP.
3
Interestingly, J.K. Rowling satirizes SP betting in "Harry Potter and the Goblet of Fire." There, a bookmaker offers bets without naming the odds. and only promises to give "excellent odds" later. The negative attitude towards SP betting continues when the bookmaker cheats and pays winners with fake money.
to manipulate the on-course prices and thus increases their expected profits.4 Our analysis thus extends the results of Rotemberg and Saloner (1990) who show that sellers who face demand uncertainty have an incentive to collude. We show that when both sellers and clients face uncertainty about outcomes, then sellers have an even stronger incentive to collude.
We test our empirical hypotheses by comparing the UK bookmakers’ market with the Australian market. These two markets share many common features, with the exception that SP betting is illegal in Australia. We show that the data support our theoretical predictions in suggesting that the UK horse racing market is less efficient than the Australian market in predictable ways. Our findings are strengthened by recent findings on inefficiencies in the UK horse racing market (see for example: Gabriel and Marsden, 1990, Vaughan Williams and Paton, 1997, Bruce and Johnson, 2005, Johnson and Sung, 2006). Our results may also contribute to the study of tacit collusion in concentrated markets (Rotemberg and Saloner, 1990, Slade, 1992, Borenstein and Shepard, 1996).
B. Market Structure
Before developing our model, we briefly describe the structure of the UK and Australian horse betting markets.
In the UK, bettors may place bets with both the pari-mutuel or with on- and off- course bookmakers. The pari-mutuel market normally opens for bets around 24 hours before races begin, and the odds are settled according to the final sums placed on each horse.5 The off-course market is controlled by a small number of bookmaking firms, who operate a large number of offices throughout the country.6 These outlets normally open for betting (like the pari-mutuel market) around 24 hours before each
4
Previous authors have already noted that off-course bookmakers may intervene in the on-course markets. Dowie (1976, p. 140), for example, notes that: "actual SP is thus determined by both off- and on- course activity."
5
For more on pari-mutuel markets see: Thaler and Ziemba (1988), Sauer (1998) and Gandar et al. (2001), among others.
6
According to the internet site Wikipedia, there are four main off-course bookmaking firms in the UK. In 2004, those four firms operated over 8,000 betting offices (en.wikipedia.org/wiki/Bookmaker), and had a considerable turnover and market power; William Hill, for example, had a total turnover of over £8 billion in 2004 (http://miranda.hemscott.com/ir/wmh/pdf/p_and_l2004.pdf).
race.7 They offer bets mainly at SP, which are the final odds offered by on-course bookmakers and are thus unknown at the time the bet is made.
Unlike the concentrated off-course betting market, the on-course market is normally far more competitive, with 10–50 on-course bookmakers at each track. The on-course bookmakers open for betting about twenty minutes to half an hour before each race, and they offer betting at fixed odds. The first set of odds they post at the time they open for bets are known as Opening Prices (OP). As the market progresses, they often change odds in order to manage their exposure.8 In particular, bookmakers often shorten the odds on horses that are plunged. A plunge occurs when a large bet on a horse is made simultaneously with many bookmakers; past research shows that plunges usually indicate the presence of bettors with superior information (insiders), such as horse owners and trainers (Shin 1991, 1992, 1994 and Schnytzer and Shilony 1995, 2003, 2005). The last set of prices that the bookmakers post before the market closes are known as the Starting Prices (SP). As noted above, these are also the set of prices that determine the payouts for most of the bets laid by the off-course
bookmakers.
The Australian on-course market is structured in the same way as the UK market. The differences occur off-course, where SP betting is illegal and bets are made either at fixed odds offered on selected races, more or less as in the UK, or with various mutuels. Finally, there are on-line bookmakers who offer betting at pari-mutuel odds.9
7
The off-course bookmakers also offer betting at fixed odds. However for most races, they open for bets at fixed odds only around half an hour before the races start. The only exceptions are very important races; in such cases fixed odds are sometimes offered even months before the race. These exceptions notwithstanding, the vast majority of bettors who bet with the off-course bookmakers choose to do so at SP.
8
In over 42,000 observations that we have in our UK data set, fewer than 8.5% of the runners maintained a constant price from the time the market opened and until it closed.
9
Even in 2007, when there are legal on-line bookmakers in Australia, SP betting remains illegal and, for most races, the bookmakers offer the odds which are determined by the various pari-mutuels operating in the different states. These bookmakers compete by permitting bettors to choose according to which pari-mutuel they wish to be paid if successful or by offering to pay the maximum dividend among the pari-mutuels. Thus, to the extent that Australian off-course bookies themselves bet
anywhere it will be with the pari-mutuel. It is interesting to note that UK off-course bookmakers do not compete by offering discounts from SP, although loss rebates are occasionally employed.
C. The model 1, Assumptions
Our model combines elements from Shin (1992, 1993), Rotemberg and Saloner (1990) and Schnytzer and Shilony (2005). It describes a market for bets on a horse race with horses, labeled by the set {1,2… }. Each horse, has (unknown) probability of winning, such that and .
N n i∈{1,2...n)
i p 1 1 =
∑
= N i ip 1> pi >0 10
Since our focus is on the behavior of off-course bookmakers, we define the setting as follows. First, there are two off-course bookmakers, identified as bookie 1 and bookie 2. Each of the bookies offers a set of N tickets that are labeled 1,2…n. Each bookie chooses the price of each ticket, such that the price of ticket i∈
{
1,2...,n}
sold by bookie j∈{1,2}is πij where 0<πij <1. The ith
ticket costs 1 and pays
ij
π
1
in the event that horse i wins the race and zero otherwise.11 We show below that in equilibrium, both bookies set SP prices rather than offer tickets at fixed odds. We assume that the goal of the off-course bookies is to maximize their expected profits and that they are risk averse in the following sense:
Assumption 1 (Risk Aversion): The bookies always maintain a balanced book, such that for every ticket the expected contingent payout is less than or equal to the total sum accumulated by the bookie. Denoting by the total sum of money wagered by all bettors on horse i with bookie j, this implies that:
} ... 2 , 1 { n i∈ ij T
( )
∑
= ≤ × ∈ ∀ ∈ ∀ n i ij T i i ij p E T j n i 1 } 2 , 1 { } ... 2 , 1 { π,12 where E denotes expectations. We assume the demand for each of the tickets is given by:
10
Shin (1992) investigates the case where a horse has a probability of 1 of winning. However, in such cases bookmakers normally refuse to take bets. As our interest is essentially empirical, we do not consider such cases.
11
Normally, bookmakers post prices in terms of odds rather than prices. The relationship between the odds and the prices is given by:
t i t i t i O , , , 1 π π −
= where Oi,t is the odds offered on horse i in race t and
t i,
π is its price.
12
This assumption is often made in the literature. For example, Crafts (1985, p. 295) assumes that bookmakers goal is to have a "perfect book," meaning that "the bookmaker… make[s] money whichever horse wins."
[
]
[
]
⎪ ⎩ ⎪ ⎨ ⎧ < − − + ≠ = − − = otherwise if p E a j k if p ET ij ik ij off i ij ik
ik ij i off ij ij ij 0 ) ( ) ( π π π β α π π π β α (1)
Where αij is the demand for horse i at bookie j if bookie j's price is equal to the expected winning probability, β is the marginal change in the demand as a result of a change in the price and denotes the expectation formed by off-course bettors based on all public information. We assume that all the off-course bettors have the same set of information and similar expectations about the prospects of runners. This leads us to follow Rotemberg and Saloner (1990) and assume that if the bookies offer equal prices they expect equal demand. That is, we assume that
off E
) , (
~ α σ
αij N i and that, in the case of equal prices, demand varies between them only by a random component with equal deviations.
We assume further that the off-course bookies have the same set of information as the bettors. Therefore, they also have the same expectations as off-course bettors.13
Since expected demand depends on posted prices, the two bookies face Bertrand-type competition (Carlton and Perloff, 1994), where bettors buy tickets from the cheaper bookie in an amount proportional to the difference between the price and the expected probability of each runner. Note that in the case where prices equal expected probability, the expected demand for each horse i is αi. Therefore, under the (strong) assumption that we make about αij, it is possible to deduce the subjective probability that off-course bettors assign to each horse i by calculating:
∑
∑
= = = ⎟ ⎟ ⎟ ⎟ ⎟ ⎠ ⎞ ⎜ ⎜ ⎜ ⎜ ⎜ ⎝ ⎛ = n i i i n i ij ij off ioff p E
E 1 1 ) ( α α α α .
Another set of players that exist in the model is the on-course bookmakers and bettors. We assume that on-course bookmakers maximize their expected profits and that the on-course betting market is efficient, so that expected profits are zero. This implies that the on-course bookmakers behave in a way that is similar to that modeled
13
This assumption can be defended on the grounds that off-course bookmakers open for bets a relatively long time before races begin. It is well documented that prices in on-course markets often change until the final moments before they close. This implies that unlike, for example, the US markets for bets on point spreads (Levitt, 2003), bookmakers do not possess all the relevant information until the end of the betting period.
by Schnytzer and Shilony (2005) and Shin (1992). We further assume that bettors in the on-course market are better informed than off-course bettors and that they bet in proportion to their expectations. 14 Denoting by the expectation formed by on-course bettors, we arrive at assumption 2:
) ( i on p E
Assumption 2 (On-Course \ Off-Course Expectations): For every runner
, and has greater predictive power than .
i
E
on(
p
i)
E
off(
p
i)
<>
= ( )
i on p
E Eoff(pi)
Assumption 2 is justified on both theoretic and empirical grounds:
Theoretically, if one assumes that the main goal of the bettors is to profit, then coming to the racetrack involves higher costs than betting off-course. Thus, bettors travel to the track only if they could gain additional information there, or if they were
determined to exploit inside information at fixed odds in a competitive setting, or both. From an empirical stand point, on-course bettors have a better opportunity to inspect the condition of the runners, and also to observe the actions of insiders. The findings in the literature also support the view that on-course bettors out perform off-course bettors (Figlewski, 1979; Schnytzer and Shilony, 1995; Gandar et al., 2001).
Our remaining two assumptions concern the relationship between the off-course and on-off-course markets:
Assumption 3 (Off-Course Bookies’ Intervention): Off course bookies can change the prices in the on-course market by plunging runners. As described above, on course bookmakers respond to plunges by increasing the price of the plunged horse in order to avoid loses in the case that the plunges horses win. Off-course bookmakers can take advantage of this and because the off course market is much larger than the on-course market. Off-on-course bookmakers can thus plunge horses on-on-course without offsetting their books significantly. Moreover, in the case that they receive large bets on horses with a low on-course price, off-course bookies can hedge some of their risk by betting on those horses, and thus doing so is almost always profitable.
The last assumption concerns the ability of off-course bookmakers to observe the SP prices before the close of betting. In order to simplify the model we make the following assumption:
14
This is similar to the assumption made by Schnytzer and Shilony (2005) where they assume that there is a hierarchy of information. At the top of the hierarchy there are bettors with inside information and bet on-course, and at the bottom there is the general gambling public.
Assumption 4 (Observing SP): The off-course bookmakers can observe the equilibrium prices in the on-course market just before the close of betting and thereby imply starting prices. Once they compare these near final equilibrium prices with their desired SP, they can influence prices by plunging horses before the close of betting. 15
We therefore model the sequence of events in as follows:
First, the off-course market is opened and the off-course bookies set their prices for each ticket.16
In the second stage, course bettors place their bets by buying tickets from the off-course bookies at the price offered, according to the demand function given by (1) and their expectations about outcomes.
In the third stage, equilibrium prices are reached in the on-course market and are observed by the off-course bookies.
In the final stage the off-course bookies may plunge horses in order to influence SP. 2. Solution
Each bookie sells tickets 1,2…n at a price of πi, and pays out i
π
1
for each unit of ticket i sold in the event that horse i wins, an event that occurs with
probability . His profits on each horse are therefore given by (1) times the price of a ticket minus the sum he pays in the event that the horse wins. His total profits are therefore:
i p
[
]
{
}
⎟⎟⎠ ⎞ ⎜⎜
⎝ ⎛
− × −
− =
∑
= i
i n
i
i off i ij j
p p
E R
π π
β
α ( ) 1
1
(2)
Since the bookies have no informational advantage over the bettors, it follows that if they try to compete by prices, the only possible equilibrium is a Bertrand equilibrium with zero expected profits. The price of each horse in such case is given,
15
Assuming that the off-course bookmakers do not actually know the equilibrium levels but employ stochastic linear programming to determine the actions according to expected equilibrium prices close to the end of betting would not change the results, so long as the noise in their predictions was not too great.
16
We assume that off-course bookmakers offer only one type of asset, although in reality they may offer a mixture of assets. For example, off-course bookmakers normally open for bets at fixed odds about twenty minutes from the start of each race. However, at that time most bettors bet at fixed odds and not at SP, and in addition the SP market is many times larger than the off-course fixed-odds market.
under our assumptions about the distribution of αij, by:
∑
∑
= = = ⎟ ⎟ ⎟ ⎟ ⎟ ⎠ ⎞ ⎜ ⎜ ⎜ ⎜ ⎜ ⎝ ⎛ = = = ∀ n i n i ij ij off i offi E p E
j 1 1 ) ( } 2 , 1 { α α α α
π ,
and expected demand is E(αij)=α .
However, in this model, this is not a unique equilibrium. Assume (without loss of generality) that bookie 1 declares that he would pay bettors according to SP as set in the on-course market, and that bookie 2 follows. Note that we define the SP of horse
in a similar fashion to our definition of
i πi; i.e. the starting price of horse is the
price of a contingent claim to 1 in the event that horse wins the race. We show that this is a stable equilibrium. To see that this is indeed an equilibrium outcome, first assume that for every horse in the race, off-course bettors take the expected SP of that horse to equal their expected probability. If bettors take SP to equal expected
probabilities, expected demand for each bookie again equals
i i
i ij
E(α )=α and expected profits for each bookie are given by:
∑
∑
∑
∑
∑
= = = = = × − × × = ⎭ ⎬ ⎫ ⎩ ⎨ ⎧ × − × = ⎭ ⎬ ⎫ ⎩ ⎨ ⎧ ⎟⎟ ⎠ ⎞ ⎜⎜ ⎝ ⎛ − × = n i n i i i n i i i i n i i i ij i ij i i n i ij j E E P E p E R i 1 1 2 1 1 1 ) ( ) ( 1 α π α α π α π α π α πα (3)
where E denotes the expectations formed by the bookies.
Assumption 4 states that each off-course bookie knows the equilibrium price set in the on-course market before it closes. We denote the equilibrium price of horse i that is observed before the close of the market by . When the off-course bookie observes he has two possible cases to consider:
e i SP e i SP
First, 0
1 2 1 1 ≥ × − × × ⇒ ≥
∑
∑
∑
= = = n i i e i n i i e i i n i i e i SP SP SP i i α α α α α α. (4)
In this case, the on-course bettors view the horse as at least as hot a favorite as the off-course bettors. In consequence, the off-off-course bookies make positive expected profits from adopting SP as the quoted price.
In the other case: 0 1 2 1 1 < × − × × ⇒ <
∑
∑
∑
= = = n i i e i n i i e i i n i i e i SP SP SP i i α α α α α α. (5)
Here, the off-course bookies have negative expected gains from the horse. Moreover, in this case, their books are not balanced and this breaches Assumption 1. However, each bookie knows that he can influence SPi by plunging. Since the other
bookie faces, in expectation, the same demand for that horse, each bookie predicts that if (5) holds, both of them would plunge the horse to the point where its price equals
∑
= n i i i 1α
α
.17 If, in response, the on-course bookmakers decrease the price of any
other horse j so that its price falls below
∑
= n i i j 1α
α
, then the off-course bookmakers
respond in the same way with regard to that horse as well, so that eventually, were there sufficient time remaining before the start of the race for complete adjustment to equilibrium, the price of all runners would be either greater than or equal to the share of bets placed on them in the off-course market. Now, since on-course bookies presumably only change prices when there is sufficient time remaining for further bets, it is reasonable to assume that no horse’s price will fall sufficiently in response to an off-course bookmaker’s plunge, on a different horse, to necessitate a further plunge for which there is insufficient time.
As a consequence, under Assumptions (1) – (4), selling SP bets allows the bookies to make non-negative expected profits on each horse, whereas he would make zero expected profits if he offers bets at fixed odds. The intuition that drives this result is simple: By deferring the decision to the on-course market, the off-course bookies can make expected profits on horses that off-course bettors favor more than on-course bettors. As long as they collude tacitly to offer SP, they can also use their market power to hedge against expected losses on horses that on-course bettors favor more than off-course bettors.
17
Note that plunging the horse helps the bookies to hedge their own risks, so plunging does not create a public good dilemma.
To prove that SP pricing is indeed an equilibrium, it remains to be shown that the bookies cannot gain from deviating, and that off-course bettors indeed take SP to equal expected prices.
First we show that the bookies cannot gain from deviating. Assume that bookie 1 announces his prices to be SP, and bookie 2 considers deviating. This can only be profitable to bookie 2 if he sets his price to be below the expected SP price. Assume that bookie 2 announces that for ticket i, the price is set below its expected price, so that it equals: , 0
1 > −
∑
= ε ε α α n i i i. In this case the demand for horse would
equal i ij i off n i i i ik
ij b ε E p α
α α α α > ⎥ ⎥ ⎥ ⎥ ⎥ ⎦ ⎤ ⎢ ⎢ ⎢ ⎢ ⎢ ⎣ ⎡ − − − +
∑
= ) ( 1 .At the same time, if he sets the price below the expected probability, it follows that: 0
1 ⎟⎟<
⎠ ⎞ ⎜⎜ ⎝ ⎛ − i i off p E
π .
Substituting this result in the bookie's profit function (equation (2)), it follows that the expected profits of bookie 2 are negative and his book is not balanced. This breaches Assumption 1, and therefore cannot hold in equilibrium. This is true for the price of any horse, and therefore bookie 2 cannot gain from deviating.18
Considering the bettors, being rational, they know the incentives of the bookies. They therefore know that, in equilibrium:
⎪ ⎪ ⎪ ⎩ ⎪ ⎪ ⎪ ⎨ ⎧ = = = ≤ =
∑
∑
∑
= = = otherwise p E E p E p E p E if SP n i i i i on off i on n i i i i off i on n i i i i 1 1 1 )) ( ( ) ( ) ( ) ( α α α α α αSince off-course bettors use all the information available to them, the best expectations they can form is to expect the on-course bettors to have the same
18
Note that even if bookie 2 is insensitive to breaching Assumption 1, bookie 1 would find that he earns no money on horse i and that he can therefore improve his situation by selling ticket at a lower price: and therefore even if bookie 2 agrees to increase his personal risk, the situation is not an equilibrium.
expectations. It thus follows that the off-course bettors expect SP prices to equal their expectation. Thus, although they know the incentives of the off-course bookmakers, betting at SP prices is as worthwhile for them as betting according to their own expectations. Betting with the pari-mutuel also involves betting at odds which are determined only at the time the race begins, and thus betting with the pari-mutuel does not a priori improve their expected returns. Off-course bettors could therefore increase their profits only by collecting more data and betting at fixed odds either on-course or with off-on-course bookies shortly before race time; however it seems that for most bettors the costs associated with doing so exceed the gains.
Although SP betting is not a unique Nash equilibrium in the model, it is evidently preferred from the standpoint of the off-course bookmakers. In addition, the historical conditions have also favored the emergence of SP betting as the
common betting price.19 Once it became accepted, then its properties as an equilibrium solution explain its persistence and robustness over time. C. Empirical hypotheses, data and tests
1. Empirical Hypotheses
The theoretical model developed in section B predicts that off-course bookies will intervene in on-course markets when horses which are heavily backed by off-course bettors receive a lower price in the on-off-course market.
Our model implies that the off-course bookmakers are most likely to intervene in the on-course market close to the time that it closes, by plunging those horses that are, in terms of their profit considerations, under-priced and, thereby, raise their prices. Since off-course bookmakers who offer SP exist in the UK but not in Australia, and since the two markets are similar in most of their other features, this leads to the following testable hypotheses:
Hypothesis 1: OPs in the UK will be higher than elsewhere, but SPs in the UK should not be significantly different than in other markets with a similar level of competition.
This motivation for this hypothesis comes from Shin (1991, 1992 and 1993) and Schnytzer and Shilony (2005) who show that on-course bookmakers increase opening prices (OPs) in response to an increase in the rate of plunges. As the latter
19
paper shows, by raising the opening prices the bookmakers give themselves a greater margin for adjusting prices in response to plunges. It is also shown that starting prices are mostly determined by competition considerations and that their level is therefore independent of the threat of plunges.
Hypothesis 2 considers the effect of intervention by off-course bookmakers on the favorite-longshot bias. Shin (1991, 1992, 1994), Vaughan-Williams and Paton (1997), Schnytzer and Shilony (2003, 2005) and Bruce and Johnson (2005) show that bookmakers tend to increase not only their OP in response to the threat of plunges, but that the threat of plunges also makes them accentuate the favorite-longshot bias. We therefore predict that the UK market will exhibit a greater extent of favorite-longshot bias in its opening prices than the Australian markets. Moreover, without the intervention of off-course bookmakers, the actions of bettors with superior inside information should reduce the favorite-longshot bias by the time that the betting period closes (Crafts, 1985, Hurley and McDonough, 1995, Sauer, 1998, Gandar et al., 2001). However, if there is a group of bettors (such as off-course bookmakers) which plunges horses in accordance with the betting patterns of uninformed bettors, then they will counter the effect of the informed traders. We therefore predict that the UK market should present a higher level of favorite-longshot bias than other markets. This hypothesis is supported by the recent findings of Johnson and Sung (2006) who report that the favorite-longshot bias in the UK is sufficiently severe to permit the existence of profitable wagering rules even at SP.
In addition, the model predicts that off-course bookmakers have an incentive to intervene in the on-course market when the prices of runners that are favored by off-course bettors drop in that market. In such cases, the off-course bookmakers have an incentive to plunge those horses and force the on-course bookmakers to raise the relevant prices.20 If this hypothesis is true, then we should find that horses whose price fell and then increased in the late stages of the betting, should be over-priced relative to their true winning probabilities. And there will be other horses whose prices fell in consequence, to the point where they are now under-priced. If, on the other hand, the markets are efficient and the changes in prices arise in consequence of new relevant information, then we should find that the starting prices of all runners
20
Dowie (1976, p. 140), mentions that: "instances of manifestly imperfect equilibrium are the focus… of complaints by both smaller off-course bookmakers and… punters."
should be the best predictors of performance. We are therefore led to the following hypothesis:
Hypothesis 3: Runners whose prices fell and then rose in the UK market should have a starting price that is too high relative to their actual performance. In contrast, horses whose prices rose and then fell should have starting prices low relative to actual performances. We do not expect to find a similar pattern in markets without off-course SP betting.
2. Data
Our testing procedure involves comparing the UK on-course bookmakers’ market with similar data collected from the Australian on-course betting market. The difference between these markets is that SP betting is illegal in Australia and off-course betting is dominated by the pari-mutuel. 21 In most other respects, the two markets are similar, with off-course bookmakers in both countries offering the same types of bets. In addition, the two on-course markets share many common features: In both markets there are about the same number of bookmakers who compete among themselves and with the pari-mutuel. Prior research reveals that in both markets there is similar activity on the part of insiders (Schnytzer and Shilony, 1995, Vaughan-Williams and Paton, 1997, Gandar et al., 2001, Bruce and Johnson, 2005). Further, unlike, for example, the Hong Kong market, both the Australian and UK betting markets reveal the same patterns of biases, including the favorite-longshot bias (Busche and Hall, 1988, Sauer, 1998).
The database we use for the UK contains information on all flat races with six runners or more held in the UK over the entire 1995 season, which was provided by
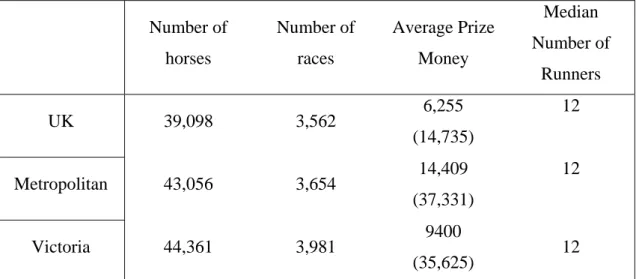
Timeform. This data set includes information on 39,098 runners that took part in 3,562 races. We compare these data with two different data sets on the bookmakers’ market in Australia that derive from the CD version of the "Australasian Racing Encyclopedia '98." The first data set contains information on all the flat races with six starters or more run at Metropolitan race tracks in Australia in the 1997/8 season. It includes data on 43,056 runners that took part in 3,654 races. Since Metropolitan races tend to attract large audiences, offer large prizes and attract considerable media
21
Concerns have been expressed in the UK as to whether SP betting is really fair. For example: Crafts (1985), p. 303 quotes a home office report that expresses concern over "…whether punters should be unreasonably penalized for their ignorance."
attention, this data set may be expected to exhibit the smallest degree of bias and also to offer relatively fewer opportunities for insiders (Vaughan Williams and Paton, 1997 and Bruce and Johnson, 2005). This implies that for some of the tests we perform, comparing this data set with bets on races that took place at all the UK racetracks would be expected to yield conservative results.
Thus, in addition, we use another data set that includes observations on all the flat races with six runners or more run in the state of Victoria in the 1997/1998 season. This data set is more similar to that of the UK in terms of prize money and in the combination of large and small tracks, although some Victorian tracks are
certainly smaller and more remote than any of those found in the UK. This is evident from the far greater variance of prize money relative to the average in the Victorian market as shown in Table 1. It is possibly a more natural benchmark for comparisons between the UK and Australian markets than the Metropolitan market. Thus, if the existence of SP betting in the UK is of no particular consequence and the main force that drives prices is the beliefs of bettors and the existence of insiders (Shin, 1991, 1992), then we would expect the UK results to fall somewhere between those provided by the two Australian markets.
All data sets include information on opening and starting odds offered on each horse and on its actual place in the race. For some runners, the data sets also include information on their price at some mid-point in the betting. This information is apparently made available, in general, for horses whose price did not change
monotonically during the betting period. That is, this information is given for runners whose prices decreased in the first stages of the betting period and then increased or vice versa.22
Table 1 provides summarized data for the three markets. *** Table 1 about here ***
2. Results:
Testing Hypothesis 1: The presence of bettors who are willing to place large sums of money on horses (plunges) is a risk to bookmakers who must hedge
themselves against this contingency. Under our hypothesis that off-course
22
In the full data set that includes information on the UK, Victorian and Metropolitan meetings throughout Australia, there were only 164 cases where the middle price was given for horses whose middle price was between their OP and SP.
bookmakers in the UK have an incentive to plunge horses whose price drops on-course during the betting period, it follows that UK on-on-course bookmakers face a greater risk of plunges than do their Australian counterparts, where off-course bookmakers are not a source of concern. We therefore predict that the average OP should be higher in the UK. To test this hypothesis we first define the Opening Price of horse i that participates in race j, , as the price of a contingent claim to £1 in the event that horse i wins. Defining as the opening odds for runner i in race
ij p ij
O j, then
the opening price of runner is the one that solves: i
ij ij ij
p p O =1− .
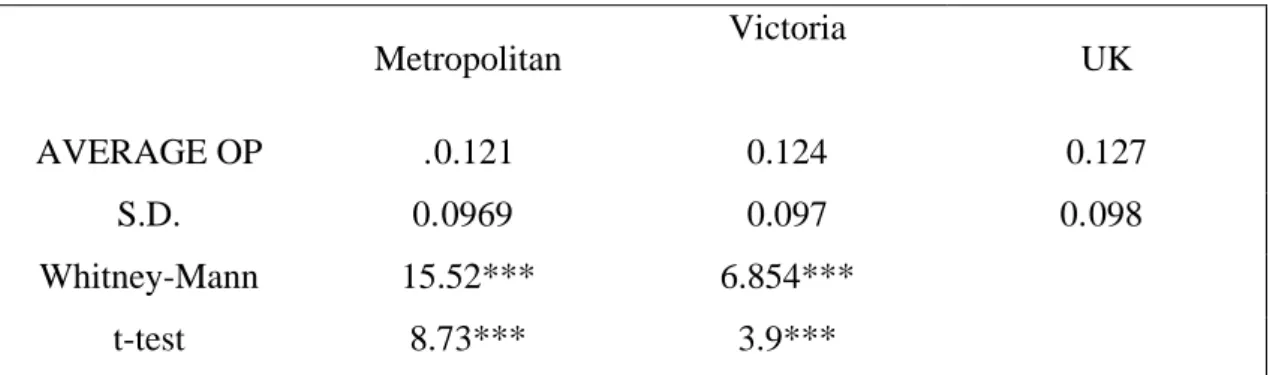
We summarize the data on OP in the three data sets and compare them by using both a t-test and the Mann-Whitney test. Table 2 summarizes the results: We find that the average opening prices of runners in the two Australian samples are significantly lower than in the UK at the 1% level.
*** Table 2 about here ***
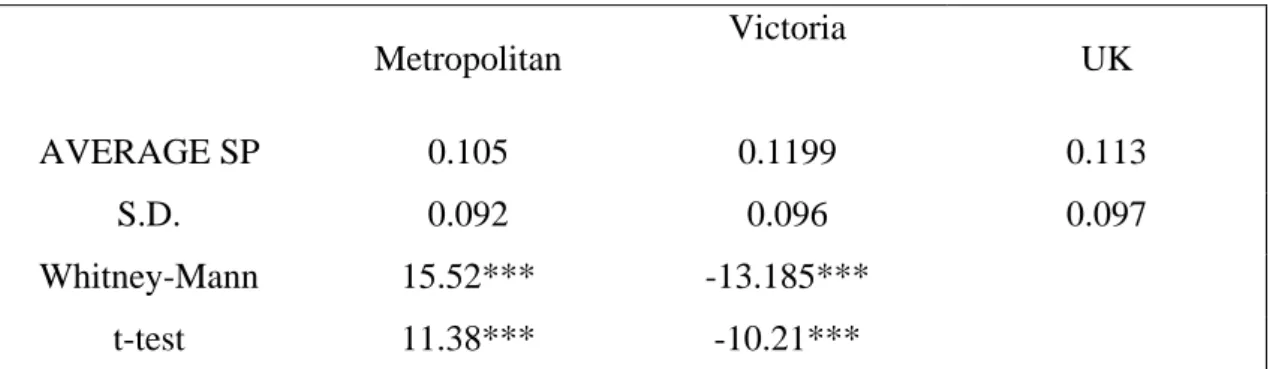
To check further that the higher opening prices in the UK are a response to plunges and not the result of less competitive markets, we compare the average SP prices in all the markets. Under the common assumption in the literature that on-course markets are competitive (Shin, 1993, Vaughan Williams and Paton, 1997, Schnytzer and Shilony, 2004), the starting prices should be set at a level that gives on-course bookmakers zero profits. The average level of SP should therefore be independent of the rate of plunges. Table 3 summarizes our findings. The results indicate that the starting prices in the UK are, on average, higher than in the Australian Metropolitan races but lower than in races held in Victoria. The lower average starting prices in the Australian Metropolitan races may be explained by the fact that the Australian
Metropolitan races are larger than most of the races in the UK and attract higher prizes, higher media attention and a large number of bookmakers. However, the starting prices in the UK markets are lower on average than the starting prices in Victoria. This implies that the UK on-course bookmakers’ market is at least as competitive as the Victoria market. This may be explained by the presence, in the Victorian data set, of remote race tracks which attract far fewer bookmakers and whose markets are thus not very competitive. Nevertheless, despite the more intensive
competition, the Opening Prices in the UK are, as we showed in Table 2, significantly higher, which further strengthens our assertion that they are set in order to allow UK bookmakers greater maneuverability in response to plunges than that perceived as necessary by Australian on-course bookmakers.
*** Table 3 about here ***
Testing Hypothesis 2: According to this hypothesis, the favorite-longshot bias will be more pronounced in the UK market than in other markets. To test this hypothesis we use a similar methodology to that employed by Gandar et al (2001).23 This
methodology relates the returns from each runner to the odds offered on it by the bookmakers. We define the opening net returns (ORij) from runner in race i j as the net returns from placing a £1 bet on it at the opening price in race j. That is, the opening returns to runner in race i j equal its opening odds in the case that it wins the race and -1 otherwise. Similarly we define the starting net returns ( ) as the returns for placing a £1 bet on a runner at its starting price. We test for the existence of a favorite-longshot bias by running regressions where the explained variables are the net opening and starting returns and the explanatory variables are the relevant odds; if there is no favorite-longshot bias there should be no correlation between the odds set by the bookmakers and the returns. If, on the other hand, there is a favorite-longshot bias in the data, then there should be a negative correlation between the odds and the returns, indicating that low probability (high odds) runners are over-priced. Since we are interested in comparing the favorite-longshot bias between the UK and both the Australian Metropolitan and the Victorian data sets, we created two data sets: The first combines the observations from the UK with observations from the
Australian Metropolitan races and the second combines all the observations from the UK and Victoria. We defined two dummy variables, Metropolitan and Victoria for differentiating between observations from the UK and observations from
Metropolitan races and from races in Victoria. For each data set we then ran two regressions: one checking for the existence of a favorite-longshot bias in opening prices and one testing for the existence of a favorite-longshot bias in starting prices. To check for the difference between the UK and the Metropolitan and Victorian races,
ij
SR
23
respectively, we added dummy and interaction variables to control for possible shifts in the intercept and in the slope. This gave us four equations of the following
structure:
i
ij Odds Dummy Dummy Odds
R =α +β× +δ1× +δ2× × +ε
where R is either OR or SR, Odds is the relevant odds type (opening odds or starting odds) and Dummy denotes either the Metropolitan dummy or the Victoria dummy, as appropriate.
Since the net returns are censored at -1 we use Tobit regressions and we clustered observations by races because the returns on horses in each race are not independent.24
The results for the opening net returns are reported in Table 4 and for the starting net returns in Table 5. The results support our hypothesis. There is a significant favorite-longshot bias in the opening prices in all three data sets as indicated by the negative coefficient of the opening odds in all the regressions. However, the favorite-longshot bias is significantly more pronounced in the UK, as predicted by our hypothesis and as indicated by the positive sign of the interaction coefficient. In addition, the favorite-longshot bias is smaller in all data sets at SP prices, but we find that the smallest decrease occurs in the UK.
*** Table 4 about here *** *** Table 5 about here ***
An alternative explanation for the stronger favorite-longshot bias in SP in the UK is that insiders bet less in the UK, and that the bias in OP is the result of some phenomenon other than a response by bookmakers to the threat of plunges. To control for such a possibility, we employ Shin's (1993) procedure to estimate the share of inside money in the different markets. Shin (1993) developed a model that relates the sum of starting prices in a race and the share of bets places by insiders with superior information. The model is based on the assumption that insiders have perfect foresight and therefore always bet correctly. Shin (1993) shows that bookmakers respond to the existence of such superiorly informed bettors in a way that makes the total sum of
24
We also ran the regressions under more general hetroscedasticity assumptions. The results remained virtually identical.
starting prices depend on the number of horses in a race. Vaughan-Williams and Paton (1997) also employ this procedure and report that it is a reliable indicator of insiders' activity. We therefore employ this procedure for the three markets with which we are concerned and report the estimated share of insider trading in each of the markets in our data sets. The results are reported in Table 6. Our estimate of insider share in the UK is of the same magnitude as those of Vaughan-Williams and Paton (1997) and somewhat greater than those reported by Shin (1993). However our data set includes many more races than Shin's, which might explain most of the difference (Vaughan and Paton, 1997). Table 6 also indicates that the share of insider trading in the UK is somewhat larger than in the Australian Metropolitan meetings, which is to be expected, given the smaller returns for insider information in races with relative high public and media attention (Vaughan and Paton, 1997, Bruce and
Johnson, 2005). Further, the share of smart money in the UK is a little less than in Victoria as is to be expected from the greater opportunities for insiders offered in rural Victoria. However, the differences between the three markets are small. Thus, it is unlikely that it is the activity of inside traders that induces the different favorite-longshot biases in the three markets. This strengthens our hypothesis that the bias is induced by a force that exists in the UK but not in Australia.
*** Table 6 about here ***
The tests on Hypotheses 1 and 2 provide evidence for the existence of an element that affects the UK market in a way that does not exist in the Australian markets. We therefore turn to Hypothesis 3, which tests the possible effects on the prices of runners that are seen by on-course bettors (including the informed bettors) as having a low probability of winning. Our theoretical model suggests that in such cases, the off-course bookmakers may have an incentive to intervene in the market and push the prices of those runners by plunging them. As a consequence, the starting price of such runners should over-estimate their ability. In markets where there is no such intervention, then prices may vary randomly during the betting to reflect changes in information. In such markets, the starting price should be the best predictor of outcomes, and the pattern of changes in the prices should not contain any extra information. More specifically, we use the middle prices that we have in the data set
to define two dummy variables:
up_down, which equals 1 if the middle price of a runner is higher than both its opening and starting price and down_up, which equals 1 if the middle price of a runner is lower than both its opening and starting price.
We then multiply these dummies by the absolute value of the difference between the middle and starting odds, so that we have a measure of the relationship between the change in the odds and the winning probability of the runner. We use these variables to estimate the following regression:
+ ×
× + ×
+
= ij 1 _ ij abs( ij − ij)
ij Sodds up down Sodds Modds
SR α β δ
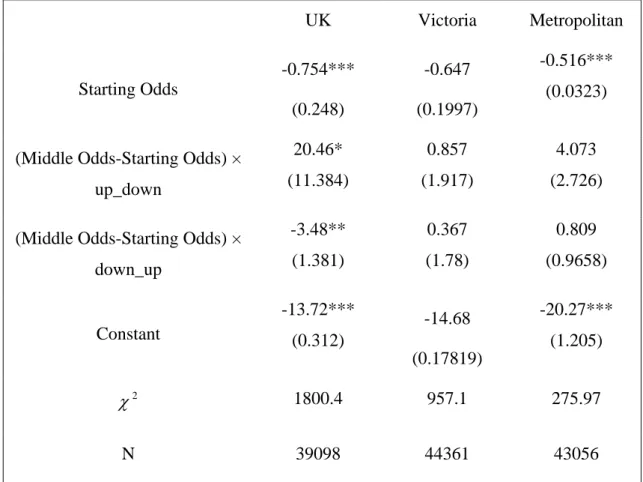
+δ2×down_upij×abs(Soddsij −Moddsij)+εij25 where Sodds are the starting odds and Modds are the middle odds, This is a similar regression to the one we used to test hypothesis 2; however, our main interest here is in the coefficients, δ1 and δ2 : a negative and significant coefficient would allow us to reject the null hypothesis that runners whose prices fell and then rose during the on-course betting have the same winning probabilities as other horses in their price group. We estimate the regressions using the Tobit estimation procedure, and we assume that observations are clustered by races. The results are reported in Table 7, and they are as predicted by our hypothesis. Thus, in Victoria and in the Australian Metropolitan races, the pattern of changes in the prices during the betting period is not significant as a predictor of the returns when starting prices are included in the
regression. In the UK, however, horses whose prices fell and then rose are significantly over-priced. The greater is the difference between their middle and starting prices, the less likely are those horses to win: this is inconsistent with the assumption that the changes in the prices between middle and starting prices are the result of new information. It does, however, support our hypothesis that off-course bookmakers try to increase the prices of runners that are favored by off-course bettors but not by the bettors on-course. Furthermore, horses whose prices initially rose in the UK - indicating the presence of positive inside information, but then fell - suggesting that other horses had been plunged by off-course bookmakers, forcing the on-course bookmakers to raise the odds of non-plunged horses in an attempt to balance their
25 abs(Sodds−Modds)
stands for the absolute value of the difference between the Starting and Middle odds.
books, were under-priced (albeit at a 10% level of significance) and thus had an increased probability of winning.
*** Table 7 about here *** D. Conclusion
In this paper we study the optimality of SP betting for off-course bookmakers in the UK. We do so by presenting a model that combines elements from Rotemberg and Saloner (1990) together with Shin's (1991, 1992) and Schnytzer and Shilony's (2004) models of horse betting bookmaking markets. Rotemberg and Saloner (1990) show that when sellers in a repeated game face demand uncertainty, they may tacitly collude. We thus extend their contribution by showing that this also applies to an environment where both sellers and clients face uncertainty about outcomes.
More specifically, we analyze the UK off-course bookmaking market, where most betting is carried out at Starting Prices. We show that despite the fact that selling bets at SP seems to violate the common assumption that bookmakers profit by
offering fixed odds and maintaining a balanced book, i.e. by adjusting odds to reflect the share of bets placed on each horse, it may be reconciled with profit maximization in a concentrated market, because it enables bookmakers to form an implicit cartel. Indeed, selling bets at SP is especially suitable for coordinating implicit collusion; as Rotemberg and Saloner (1990) note, in order to maintain tacit collusion sellers have to set easy to follow prices and maintain them over long periods. Starting prices clearly comply with this rule because, by definition, they are a fixed reference price which cannot be changed directly by the actions of a single off-course bookmaker.
Our model implies that this tacit collusion increases the profits of the off-course bookmakers by allowing them to influence the prices in the on-off-course market in their favor. We test some empirical implications of the model by comparing the UK market with similar on-course bookmaking markets in Australia, the difference being that in Australia SP betting is illegal. We find evidence that the UK market is different from the Australian markets in ways that are consistent with the implications of our model. Especially, we find evidence that UK markets are less efficient in ways that may be explained by the existence of a large bettor (or a few large bettors) that make prices in the market overstate the winning probability of runners that on-course
bettors back less than merited by the final, pre-race prices. This evidence strongly supports our hypothesis that the UK market is different from other markets owing to the intervention of large off-course bookmakers who offer SP betting. This also leads the UK bookmaking market to be less efficient than other markets, in the sense that prices convey less accurate information than in Australia. Thus, the intervention of the off-course bookmakers may be against the interest of the bettors, given that betting is a zero-sum game.
Our findings are consistent with other recent findings in the literature on the UK bookmaking market that show that the biases in that market are larger than in other markets and might be large enough to violate, in practical terms, weak-form efficiency. For example, Gabriel and Marsden (1990) report that betting with the Tote (pari-mutuel) gives bettors consistently higher revenues than betting with bookmakers at SP. Johnson and Sung (2006) also report that the UK market is less efficient than other betting markets, and that the biases in SP may be large enough to allow positive expected profits. These finding are inconsistent with the assumption that SP represent equilibrium prices (Dowie, 1976), but our findings suggest a possible explanation for this seeming anomaly; namely, the existence of large bettors who bet in proportion to bets placed by the uninformed public.
An important caveat is that our findings are for the 1995 UK season. It is possible that changes in the market structure that have occurred since of the
introduction of on-line betting and the fact that SP betting is currently losing some of its former popularity may have lessened the motivation for off-course bookmakers tacitly to collude.26
26
E. References:
Borenstein Severin and Andrea Shepard (1996), "Dynamic Pricing in Retail Gasoline Markets," 27,3: 429-451.
Bruce, Alistair C. and Johnnie E.V. Johnson (2005), "Market Ecology and Decision Behavior in State-Contingent Claims Markets," Journal of Economic Behavior and Organization 56: 199-217.
Busche, Kelly and Christopher Hall (1988), "An Exception to the Risk Preference Anomaly," Journal of Business 61: 337-346.
Carlton, D.W. and J. M. Perloff (1994), Modern Industrial Organization, 3rd edition, (New York, NY: Harper-Collins-College-Publishers).
Crafts N.F.R (1985), "Some Evidence of Insider Knowledge in Horse Race Betting in Britain," Economica 52,207: 295-304.
Dowie, Jack (1976), "On the Efficiency and Equity of Betting Markets," Economica 43,170: 139-150.
Figlewski, Stephen (1979), "Subjective Information and Market Efficiency in a Betting Market," Journal of Political Economy 87,1: 75-88.
Gabriel, Paul E. and Marsden James R. (1990), "An Examination of Market
Efficiency in British Racetrack Betting," Journal of Political Economy 98,4: 874-885. Gandar, John, M., Richard A. Zuber and R. Stafford Johnson (2001), "Searching for the Favourite-Longshot Bias Down Under: An Examination of the New-Zealand Pari-Mutuel Betting Market," Applied Economics 33: 1621-1629.
Hurley, Williams and Lawrence McDonough (1995), "A Note on the Hayek Hypothesis and the Favorite Long Shot Bias in Pari-mutuel Betting," American Economic Review 85,4: 949-955.
Johnson, Johnnie E.V. and Sung (2006), "Revealing Weak Form Inefficiency in a Market for State Contingent Claims," Working Paper.
Lee, Marcus and Gary Smith (2002), "Regression to the Mean and Football Wagers," Journal of Behavioral Decision Making 15: 329-342.
Levitt, Steven D. (2004), "Why are Gambling Markets Organized so Differently from Financial Markets?" Economic Journal 114: 223-246.
Rotemberg, and Saloner (1990), "Collusive Price Leadership," journal of Industrial Economics 39,1: 93-111.
Sauer, Raymond D. (1998), "The Economics of Wagering Markets," Journal of Economic Literature 36,4: 2021-2064.
Schnytzer, Adi and Yuval Shilony (1995) ,"Inside Information in a Betting Market," Economic Journal 105: 963-971.
Schnytzer, Adi and Yuval Shilony (2003), "Is the Presence of Inside Traders Necessary to Give Rise to a Favorite-Longshot Bias?" in L. Vaughan Williams (ed.) The Economics of Gambling, Routledge, 14-17.
Schnytzer, Adi and Yuval Shilony (2005), "Insider-Trading and Bias in a Market for State-Contingent Claims," in L. Vaughn Williams (ed.) Information Efficiency in Financial and Betting Markets, Cambridge University Press, 287-312.
Shin, Hyun Song (1993), "Measuring the Incidence of Insider Trading in a Market for State-Contingent Claims," Economic Journal 103,420: 1141-1153.
Shin, Hyun Song (1992), "Prices of State Contingent Claims with Insider Traders and Favorite-Longshot Bias," Economic Journal 102,411: 426-435.
Shin, Hyun Song (1991), "Optimal Betting Odds against Insider Traders," Economic Journal 101,408: 1179-1185.
Slade, Margaret E. (1992), "Vancouver's Gasoline Price Wars: An Empirical Exercise in Uncovering Supergame Strategies," Review of Economic Studies 59,2: 257-276. Strumpf, Koleman S. (2003), "Illegal Sports Bookmakers," Working Paper.
Thaler, Richard H. and Williams T. Ziemba (1988), "Anomalies: Pari-mutuel Betting Markets: Racetrack and Lotteries," Journal of Economic Perspective 2,2:161-174. Vaughan Williams, Leighton and David Paton (1997), "Why is there a favorite-Longshot Bias in British Racetrack Betting Markets?" Economic Journal 107,440: 150-158.
Table 1: Summary Statistics Number of
horses
Number of races
Average Prize Money
Median Number of
Runners
UK 39,098 3,562 6,255
(14,735)
12
Metropolitan 43,056 3,654 14,409
(37,331)
12
Victoria 44,361 3,981 9400
(35,625) 12
Table 1: Number of horses is the total number of starters. The average prize money is given in UK pounds (For observations on races run in Australia we converted the prize money to UK pounds at the then ruling exchange rate between the Australian dollar and the UK pound, which averaged 0.47 £/Aus$. Standard deviations are in parenthesis.
Table 2: Average Opening Prices
Metropolitan Victoria UK
AVERAGE OP .0.121 0.124 0.127
S.D. 0.0969 0.097 0.098
Whitney-Mann 15.52*** 6.854***
t-test 8.73*** 3.9***
Table 2: Comparing Opening Prices (OP) in the UK and Australia. The column marked as Metropolitan gives the results for runners in all the Metropolitan meetings in Australia in the 1997/8 season. The Victoria column gives the results for runners participating in all races held in Victoria during the 1997/1998 season. The UK column is for all the runners in the UK during the 1995 season.
The line marked as Whitney-Mann gives the value of the Whitney Mann test for comparing the relevant data set with the data set on the UK races. The t-test line gives the value of the t-test for equal means in the UK and the relevant Australian data set. ***- significant at 1%.
Table 3: Average Starting Prices
Metropolitan Victoria UK
AVERAGE SP 0.105 0.1199 0.113
S.D. 0.092 0.096 0.097 Whitney-Mann 15.52*** -13.185***
t-test 11.38*** -10.21***
Table 3: Comparing Starting Prices (SP) in the UK and Australia. The column marked as Metropolitan gives the results for runners in all the Metropolitan meetings in Australia in the 1997/8 season. The Victoria column gives the results for runners participating in races held in Victoria in the 1998 season. The UK column is for all the runners in the UK in the 1995 season.
The line marked as Whitney-Mann gives the value of the Whitney Mann test for comparing the relevant data set with the UK. The test line gives the value of the t-test for equal means in the UK and the relevant Australian data set.
Table 4: Favorite-Longshot bias at OP
Victoria Metropolitan
Opening Odds -0.849***
(0.023)
-0.89*** (0.034) Opening Odds × Victoria dummy 0.222***
(0.023)
Victoria dummy -1.65***
(0.238)
Opening Odds × Metropolitan dummy 0.325***
(0.069)
Metropolitan dummy -2.4***
(0.506) Constant -11.15***
(0.216)
-12.62 *** (0.395)
2
χ 4349.63*** 3734.75***
Table 4: The results of Tobit models estimating the favorite-longshot bias in the three markets. Dependent variable: the returns to each horse on each race calculated according to its Opening Prices (OP). The Victoria column gives the results of a regression which includes observations from the UK and Victoria. The Metropolitan column gives the results of a regression on all observations from the UK and the Australian Metropolitan races. Opening Odds × Victoria (Metropolitan) is an interaction variable that measures the marginal effect of a change in the odds in Victoria (Metropolitan) as compared with the effect in the UK. Standard deviations are in parenthesis.
Table 5: Favorite-Longshot bias at SP
Victoria Metropolitan
Starting Odds
-0.74*** (0.023)
-0.851*** (0.035) Starting Odds × Victoria dummy 0.114***
(0.023)
Victoria dummy -1.65***
(0.238)
Starting Odds × Metropolitan dummy 0.389 ***
(0.069)
Metropolitan dummy -3.298***
(0.592 )
Constant -12.428***
(0.233)
-15.27*** (0.49 3)
2
χ 4380.15*** 4454.11***
Table 5: The results of Tobit models estimating the favorite-long shot bias in the three markets. Dependent variable: the returns from each horse on each race
calculated according to his Starting Price (SP). The Victoria column gives the results of a regression which includes observations from the UK and Victoria. The
Metropolitan column gives the results of a regression on all observations from the UK and the Australian Metropolitan races. Opening Odds × Victoria (Metropolitan) is a an interaction variable that measure the marginal effect of a change in the odds in Victoria (Metropolitan) as compared with the effect in the UK. Standard deviations are in parenthesis.
Table 6: Share of Insider Money in Total Betting
UK Victoria Metropolitan
z- the share of insider trading in the market
0.023246 *** (0.000101)
0.0241441 *** (0.
0.022071 0001557 )
*** (0.0001168)
N 3,562 3,981 3,654
2
R 0.9339 0.9198 0.9103
Table 6: The share of insider money in each of the markets according to Shin's (1993) model. The value of z is the coefficient of n-1 in the regression:
Where is the deviation of the sum of SP from 1 in race i, is the number of runners in race, is Shin's variance of winning probabilities in race i and.
i k
k i k i
k k i k i
i z n n V n Vi
D = − +
∑
= α +∑
2= β 2 +ε0 2
0
) 1 (
i
D ni
i
V εi is a
random error (see: Shin, 1993 for the full derivation of the theoretical model). *** significant at 1%.
Table 7: Changes in Mid Prices as predictors of Profits
UK Victoria Metropolitan
Starting Odds
-0.754*** (0.248)
-0.647 (0.1997)
-0.516*** (0.0323)
(Middle Odds-Starting Odds) × up_down
20.46* (11.384)
0.857 (1.917)
4.073 (2.726) (Middle Odds-Starting Odds) ×
down_up
-3.48** (1.381)
0.367 (1.78)
0.809 (0.9658)
Constant
-13.72*** (0.312)
-14.68 (0.17819)
-20.27*** (1.205)
2
χ 1800.4 957.1 275.97
N 39098 44361 43056
Table 7: Dependent variable: actual profits from betting £1 on each horse. down_up is a dummy which takes on the value of 1 if the middle price of a runner is smaller than both its opening and closing prices. up_down is a dummy variable receiving the value of 1 if the middle price is higher than both the opening and starting prices. The UK column gives the result of the regression on all the UK observations, the Victoria column gives the result of the regression on all the Victoria observations and the Metropolitan column gives the result of the regression on all the observations in Australian Metropolitan races. Standard deviations in parenthesis.