National Energy and Cost Savings
Full text
Figure


Related documents
Although the general trend of plume migration during the injection period has been history matched in the near- field region of the geological model, it is recognised that there
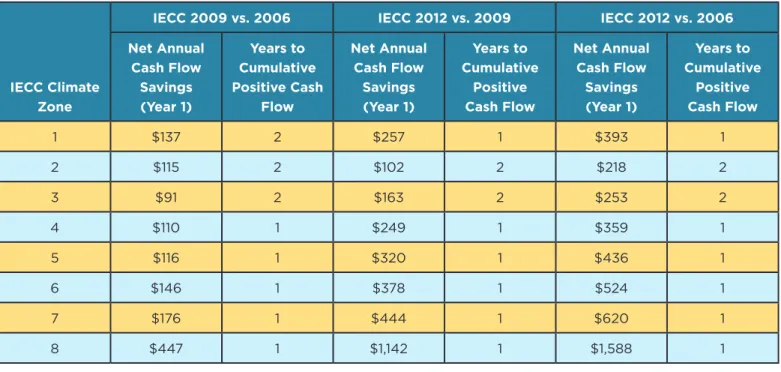
Projected Annual Energy Cost Savings Projected Annual Energy Cost Savings Over Minimum 1 Total Improvement Costs Incremental Improvement Costs Incremental Annual Cash
Case Study 2 – Energy Conservation Measures Energy Conservation Measures Cost Annual Savings Payback –
Annual C-PACE Assessment: $12,044 Annual Energy Cost Savings: $20,934 Lifetime Energy Cost Savings: $418,690 Annual Energy Savings: 65,000 kWh.. CT Green Bank’s Role
Shape memory polymers (SMP) can be used to close cracks in concrete and produce a compressive stress across crack faces, enhancing the load recovery associated with this
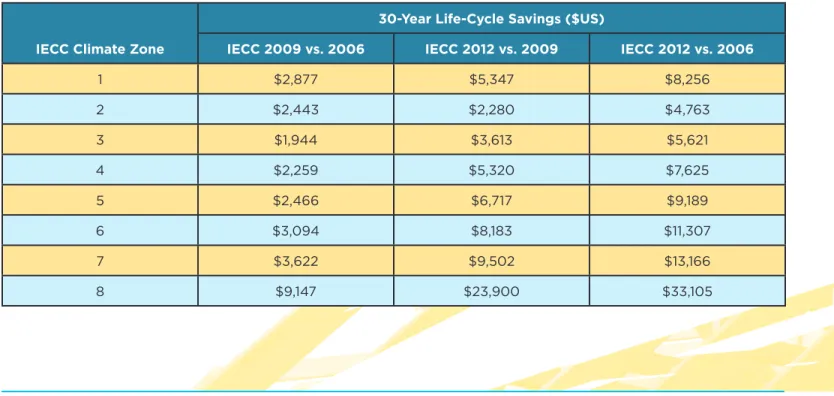
• Life-Cycle Cost: Full accounting over a 30-year period of the cost savings, considering energy savings, the initial investment financed through increased mortgage costs,
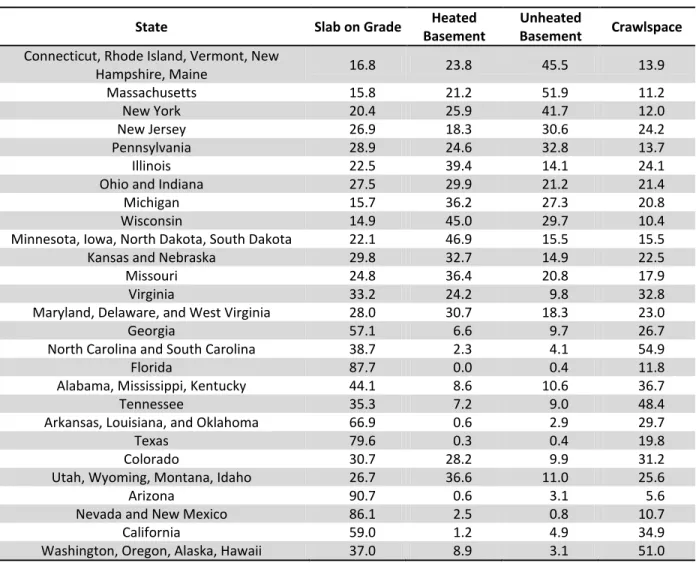
Table 2 presents the regional cost ($) and energy (Btu 3 ) savings estimates for using ENERGY STAR qualified windows under three conditions: relative to single pane, relative to
• Life-Cycle Cost (LCC): Full accounting over a 30-year period of the cost savings, considering energy savings, the initial investment financed through increased mortgage costs,
