1
Fake Biometric Detection Using Improved Features in
Image and Dempster-Shafer Method
SNEHA S Mrs. R.INDUMATHI, ME, MBA
PG Scholar, Department of CSE, Assistant Professor, Department of CSE Dhanalakshmi Srinivasan College of Engineering, Dhanalakshmi Srinivasan College of Engineering,
Coimbatore- 641 105 Coimbatore- 641 105
Abstract- Biometric systems are vulnerable to various types of attacks. In this paper, a software based multi biometric and multi attack protection method based on image quality assessment is used to identify the real and fake traits. The present system proposes 30 image quality measures which are extracted from one image to identify the fraudulent access attempts. These feature vectors of image quality are selected and classified by using Discriminant Analysis. The proposed method ensures the security of biometric system framework by adding liveness assessment and provides a very good performance and possesses a low degree of complexity. Attacks to various biometric modalities such as Iris, Fingerprint, Face Images, and Hand Palm Images are considered. In Hand Palm images a lot of translational and rotational variations are presented. Since assessment of quality in those image is a challenging task. From the result of discriminate analysis, the legitimate and fake user is identified by using the proposed method of Dempster-Shafer Theory. This Method combines decisions from multiple results of Discriminant Analysis and obtains the distinguishable decisions as legitimate and fake users.
Keywords: Image Quality Assessment, Liveness detection, Biometrics, Dempster -Shafer Theory
I. INTRODUCTION
Biometrics is the science of establishing the identity of an individual based on the physical or behavioral attributes of the person. By the use of biometrics it is possible to establish an identity based on who you are rather than by what you possess. Biometric systems security has led to the evaluation of different biometric vulnerabilities and the proposal
of new protection methods [2]. Fig. 1, shows different levels of attacks that can be launched against a biometric system (i) a fake biometric trait such as an artificial finger may be showed at the sensor, (ii) illegally intercepted data may be submitted to the system, (iii) the feature extractor may be altered by some other program,(iv) genuine feature sets may be replaced with synthetic feature sets, (v) the matcher may be replaced by a program that always outputs high scores thereby defying system security, (vi) stored templates may be altered or deleted, (vii) the data in the communication channel between various modules of the system may be modified, and (viii) the final decision by the biometric system may be overridden [14].
Among the various vulnerabilities considered above the trustworthiness of biometric verification systems is compromised by the emergence of direct or spoofing attacks. In this paper main attention is given to these types of attacks. Attacks to different biometric modalities such as face, iris, fingerprint, and hand palm images are considered here. In spoofing attacks the attacker tries to fake somebody else’s identity by presenting fake samples of that person’s traits to the acquisition device. In fingerprint spoofing the imposter may show gummy fingers made up of silicone or gelatin .The use of facial photographs of a valid user is the most common method for face spoofing attacks. For iris mode, [1] presenting printed image of an iris can help impersonating someone’s identity. By the use of appropriate printer and paper combination the quality of
iris image can mislead the recognition system. Attacks to Hand palm recognition systems include fake hands created using different materials or photographs of human hand. Nowadays biometric data is accessible to the imposters in various ways due to information globalization: user’s photos and videos are available through various sites on internet, Fingerprint molds can be easily constructed from the marks left on coffee cups or some other materials.
3. Override Feature Extractor 6. Modify
Template
7. Intercept the channel
2.Replay
8.Overide
1.Fake Biometric Old data 5. Override result
4. Synthesized Feature Extractor
Fig. 1 Vulnerabilities in Biometric System
Several countermeasures are proposed to overcome spoofing attacks. Among them special attention is given to liveness detection methods by the researchers due to various reasons. Liveness detection methods try to identify the attacks using
Sensor
Stored Template
Result
Feature
2 signs of life such as eye blinks, head movements, fingerprint perspiration etc
The main drawback of the existing anti-spoofing methods is their lack of universality. The performance of these methods varies drastically when the method of spoofing changes. For example the detection method that shows high performance in the identification of synthetic fingers made out of silicon may not be good at the identification of synthetic fingers made out of play-doh. i.e. performance of the anti-spoofing methods depends on the performance of evaluation database. Another drawback is reduced interoperability. Most of the existing protection methods use some specific properties of the trait to differentiate between real and fake samples such as ridges and valleys of fingers, pupil dilation of eye, skin texture of face etc. These methods are not efficient in the detection of fraudulent accesses in multi-biometric modalities.
The proposed method is software based multi-biometric multi-attack protection scheme. In proposed system, different types of fraudulent access attempts in multiple biometric systems are detected using Dempster-Shafer Method with explored image quality measures of features. In addition with existing 25 general image quality features extracted from one image, the proposed system includes improved 5 quality features such as Spectral Energy, Universal Image Quality Index, Visual Signal to Noise Ratio, NIST Fingerprint Image Quality and Edge Spread. In addition to Iris, Fingerprint, and Face Images, Hand Palm Images are used for image quality measurement. In hand palm images present a lot of translational and rotational variations are presented. The whole image without searching for any trait-specific properties, the proposed method does not require any preprocessing steps prior to the computation of the IQ features. Computational load can be minimized due to this characteristic. When the feature vector has been generated the sample is classified as real or fake, using some simple classifiers. Following this, the feature selection process is used to determine the set of 30 IQM, which intend that the final method complies to the highest possible extent with the desirable requirements set for liveness detection systems.
The four selection criteria to determine the 30 IQMs are performance, Complimentarily, Complexity and Speed [1]. Based on these result the classification is done by using Linear Discriminant Analysis. This classifies the set of samples to discriminate the legitimate and fake users. From these result the decision result is generated by using the Dempster-Shafer Method. Dempster-Shafer is a
promising method for of fraudulent access detection problems with multiple features, classifiers. Experimental result of proposed system provides better result when compare with the existing system.
II. IMAGE QUALITY ASSESSMENT
Quality assessment (QA) of an image measures its degradation during various stages of image processing such as acquisition, compression, transmission, processing, and reproduction. The quality of image is affected by environmental disasters such as noise, blur, and adverse illumination. A good IQM must be Accurate, Consistent and Monotonic in predicting quality.
Prediction Accuracy means the accurate prediction of
distortions. Prediction Consistency means the capability to provide consistently accurate predictions for all types of images and not to fail badly for a subset of images. Prediction Monotonicity means image quality measure’s scores
should be monotonic in their relationship to the performance scores.
There must exist a quality difference between real and fake samples which includes color and luminance levels, degree of sharpness, local artifacts, structural distortions or natural appearance. That is the fake sample will most likely lack some of the features found in natural image. Based on this fact the potential of image quality assessment as a protection method against different biometric attacks are explored in this paper.
III. THE PROTECTION METHOD
The 30 image quality measures proposed in this work are both Full Reference and No Reference Measures. According to the prior knowledge used in the assessment image quality metrics are categorized into Full Reference (FR) and No Reference (NR). FR requires the original undistorted image as a reference. That is they require input not only of the distorted image, but also a ‘clean’, reference image with respect to which the quality of the distorted image is assessed. The fake detection problem addressed in this work such a reference image is unknown, as the detection system only has access to the input sample .In order to overcome this limitation the same strategy already successfully used for image manipulation detection in [4] and for steganalysis in [5], is implemented here. NR requires no reference image for quality assessment. The 25 selected image quality features described by Galbally, Sebastian Marcel, and Julian Fierrez [1] are summarized in Table I
3 LIST OF IMAGE QUALITY FEATURES PRESENTED
IN [1]
additional features proposed in this paper are explained as follows:
A. Proposed Features
Spectral Energy: Spectral energy calculates
the block-wise energy using Fourier transform components. It indicates sudden changes in illumination and specular reflection. The image is fitted into several blocks that do not overlap, and the spectral energy is computed for each block as the magnitude of Fourier transform components in both horizontal and vertical directions that shows the amount of spectral energy per block [27].
Universal Image Quality Index: UIQ means
that the quality measurement approach does not depend on the images being tested, the viewing condition or the individual
observer. Let
x=
be the original and test images . The proposed quality index is [24]:
NIST Fingerprint Image Quality: The
quality of the fingerprint image measured by NFIQ comes under 5 classes where class 1 is excellent quality and class 5 is poor quality [28]. Class 2, 3, 4 represents Very good, good, fair respectively. NFIQ measure outputs an integer value between 1 and 5 which is the prediction of matcher performance.
Edge Spread: Edge spread [25, 26] estimate
the irregularities in an image based on edges and their adjacent regions. More precisely, it computes the effect of irregularity based on the analysis of the difference in image intensity with respect to the local maxima and minima of pixel intensity at every row of the image.
Visual Signal to Noise Ratio: VSNR can
only deal with gray-scale images and the luminance range is [0, 255]. So, for color images, before calling VSNR, need to convert it to [0, 255] gray-scale version [23].The VSNR, in decibels, is accordingly given by
# Type Acrony
m REF Description 1 FR MSE [6]
MSE(I,Î)=
2 FR PSNR [7] PSNR(I,Î)=10 3 FR SNR [8] SNR(I,Î)= 10 4 FR SC [9] SC (I,Î)= 5 FR MD [9] MD(I,Î)= max 6 FR AD [9]
AD(I,Î)=
7 FR NAE [9] NAE(I,Î) = 8 FR RAMD [6]
RAMD(I,Î,R) =
9 FR LMSE [9]
LMSE(I,Î) =
10 FR NXC [9] NXC(I,Î) = 11 FR MAS [6]
MAS(I,Î) =
1-12 FR MAMS [6]
MAMS(I,Î) =
13 FR TED [10]
TED(I,Î) =
14 FR TCD [10] TCD(I,Î) = 15 FR SME [11]
SME(I,Î) = 16 FR SPE [11]
SPE(I,Î) =
17 FR GME [12]
GME(I,Î) =
18 FR GPE [12]
GPE(I,Î) =
19 FR SSIM [13] See [13] and practical implementation available in [22] 20 FR VIF [16] See [16] and practical
implementation available in [22] 21 FR RRED [17] See [17] and practical
implementation available in [22] 22 NR JQI [18] See [18] and practical
implementation available in [22] 23 NR HLFI [19] implementation available in [22] See [19] and practical 24 NR BIQI [20] See [20] and practical
implementation available in [22] 25 NR NIQE [21] See [21] and practical
4
IV. PROPOSED WORK
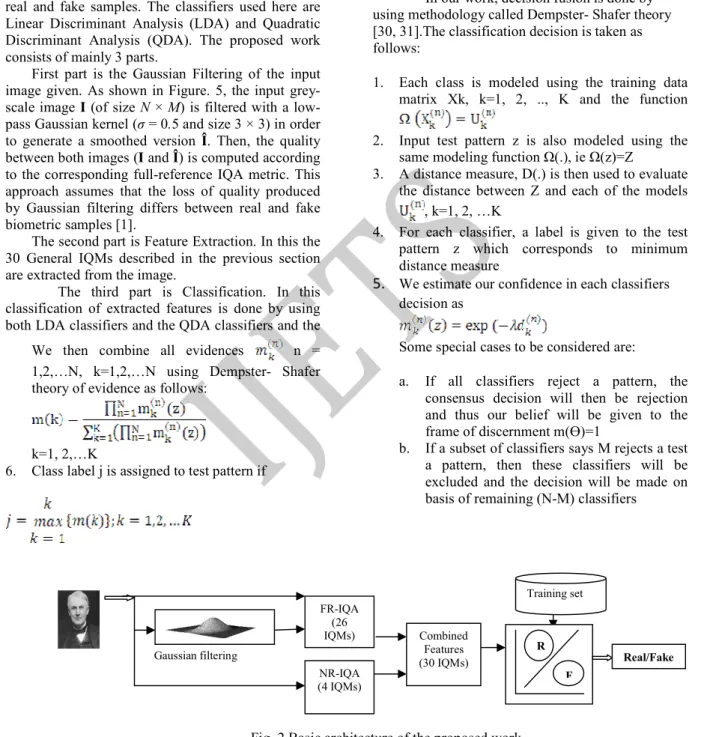
The architecture of the proposed method is explained in Fig. 2. Our aim is to distinguish between real and fake samples. The classifiers used here are Linear Discriminant Analysis (LDA) and Quadratic Discriminant Analysis (QDA). The proposed work consists of mainly 3 parts.
First part is the Gaussian Filtering of the input image given. As shown in Figure. 5, the input grey-scale image I (of size N × M) is filtered with a low-pass Gaussian kernel (σ = 0.5 and size 3 × 3) in order to generate a smoothed version Î. Then, the quality between both images (I and Î) is computed according to the corresponding full-reference IQA metric. This approach assumes that the loss of quality produced by Gaussian filtering differs between real and fake biometric samples [1].
The second part is Feature Extraction. In this the 30 General IQMs described in the previous section are extracted from the image.
The third part is Classification. In this classification of extracted features is done by using both LDA classifiers and the QDA classifiers and the
final decision of classification are made based on decision fusion methodology. The classifier used for the two scenarios is based on Quadratic Discriminant Analysis (QDA) [29] as it showed a slightly better performance than Linear Discriminant Analysis (LDA), which will be used in the face-related experiments.
In our work, decision fusion is done by using methodology called Dempster- Shafer theory [30, 31].The classification decision is taken as follows:
1. Each class is modeled using the training data matrix Xk, k=1, 2, .., K and the function
2. Input test pattern z is also modeled using the same modeling function Ω(.), ie Ω(z)=Z
3. A distance measure, D(.) is then used to evaluate the distance between Z and each of the models
, k=1, 2, …K
4. For each classifier, a label is given to the test pattern z which corresponds to minimum distance measure
5.
We estimate our confidence in each classifiers decision asWe then combine all evidences n = 1,2,…N, k=1,2,…N using Dempster- Shafer theory of evidence as follows:
k=1, 2,…K
6. Class label j is assigned to test pattern if
Some special cases to be considered are:
a. If all classifiers reject a pattern, the consensus decision will then be rejection and thus our belief will be given to the frame of discernment m(ϴ)=1
b. If a subset of classifiers says M rejects a test a pattern, then these classifiers will be excluded and the decision will be made on basis of remaining (N-M) classifiers
Gaussian filtering
Fig. 2 Basic architecture of the proposed work
V. EXPERIMENTAL RESULTS
Training set
Real/Fake R
Combined Features (30 IQMs) FR-IQA
(26 IQMs)
NR-IQA (4 IQMs)
5 The evaluation of the proposed work is designed with two aspects which is biometric and multi-attack. In first, the ability to achieve good performance under different biometric modalities is considered. For this different modalities such as Face, Iris, Fingerprint, and Handplam are considered. In second, other than spoofing attacks the attempts carried out using synthetic or reconstructed samples are considered. For each case a particular pair of real-fake databases is used. They are divided into Train set: used to train the classifier and Test set: used to evaluate the performance of protection method. The results are recorded in terms of False Positive Rate (FPR), proportion of negatives cases that were incorrectly classified as positive; and True Negative Rate (TNR), the proportion of negatives cases that were classified correctly. Performance of the experimental protocol is evaluated on 64 bit Windows XP- PC with 2.30 GHz Processor running in MATLAB 2013a.
A. Results: Fingerprint
For fingerprint QDA is used. The dataset consists of real and fake fingers of 500 samples. Gummy fingers generated using materials silicone and gelatin is considered here. Results are given in Table II.
B. Results: Face
The classifier used here is Linear Discriminant Analysis (LDA). The different type of attacks considered here are the attacks performed using photos taken in mobile, attacks carried out using printed copies of photographs, access attempts using face masks. The dataset consists of real and fake images of 800 samples. Results are given in Table III.
C. Results: Iris
For iris both spoofing attack and attack with synthetic samples is considered. The classifier used here is Quadratic Discriminant Analysis (QDA). The Dataset consists of real and fake iris images (print iris images) of 60 users. Synthetic irises are generated by the method described in [15]. Results are given in Table IV.
D. Results: Hand palm
The classifier used here is LDA. The attacks considered here are photographs of hand palm images. Dataset comprises of real and fake samples of 500 images. Results are given in Table V.
TABLE II
RESULTS (IN PERCENTAGE) OF FINGERPRINT OBTAINED
BY PROPOSED WORK
TABLE III
RESULTS (IN PERCENTAGE) OF FACE OBTAINED BY PROPOSED WORK
TABLE IV
RESULTS (IN PERCENTAGE) OF IRIS OBTAINED BY PROPOSED WORK
TABLE V
RESULTS (IN PERCENTAGE) OF HANDPALM OBTAINED
BY PROPOSED WORK
VI. CONCLUSION
Visual inspection of an image of a real biometric trait and a fake sample of the same trait
shows that the two images can be very similar and even the human eye may find it difficult to make a distinction between them after a short inspection. Yet, some differences between the real and fake
Results: Iris
FPR TNR Avg Exec(s)
Iris-spoof 0.21 3.9 0.212
Iris- Synthetic 0.6 2.8 0.142
Results: Fingerprint
FPR TNR Avg Exec(s)
Spoof 5.4 3.2 0.236
Synthetic 04.2 5.1 0.186
Results: Face
FPR TNR Avg Exec(s)
Print Attacks 4.5 8.7 0.121
Mobile Attacks 3.2 2.3 0.186
Face Mask 7.2 10.1 0.146
Results: Hand Palm
FPR TNR Avg Exec(s)
6 images may become clear once the images are translated into a proper feature space. This is because of the fact that biometric traits have their own optical qualities, which synthetically produced samples do not possess. In this context, it is reasonable to assume that the image quality properties of real accesses and fraudulent attacks will be different. Based on this “quality-difference”, in the present work we have explored the possibility of general image quality assessment as a protection tool against different biometric attacks.
The proposed five improved new image quality metrics are Spectral Energy, Universal Image
Quality Index, Visual Signal to Noise Ratio, NIST Fingerprint Image Quality and Edge Spread provides a better result than the existing works. The experimental results prove that our proposed work can produce a better result than the existing work. The present research also opens new possibilities for future work, including: i) inclusion of temporal information for those cases in which it is available e.g., systems working with face videos; ii) use of video quality measures for video attacks iii) analysis of the features individual relevance
REFERENCES
[1] Javier Galbally, Sébastien Marcel, and Julian Fierrez, “Image Quality Assessment for Fake Biometric Detection: Application to Iris, fingerprint, and Face Recognition”, IEEE transactions on Image Processing, vol.23, no.2, February 2014.
[4] S. Bayram, I. Avcibas, B. Sankur, and N. Memon, “Image manipulation detection,” J. Electron. Imag. vol. 15, no. 4, pp.041102-1–041102-17,2006.[2] N. Ratha, J. H. Connell, and R. M. Bolle, “An analysis of minutiae matching strength”.
[3] Priyanshu Gupta, Shipra Behera, Mayank Vasta and Richa Singh, “On Iris Spoofing using Print Attack”
[5] I. Avcibas, N. Memon, and B. Sankur, “Steganalysis using image quality metrics,” IEEE Trans. Image Process., vol. 12, no. 2, pp. 221–229, Feb. 2003.
7 Measures,” J. Electron. Imag., vol. 11, no. 2, pp. 206–223, 2002.
[7] Q. Huynh-Thu and M. Ghanbari, “Scope of validity of PSNR in image/video quality assessment,” Electron. Lett., vol. 44, no. 13, pp. 800–801, 2008.
[8] S. Yao, W. Lin, E. Ong, and Z. Lu, “Contrast signal-to-noise ratio for image quality assessment,” in Proc. IEEE
ICIP, Sep. 2005, pp. 397–400.
[9] A. M. Eskicioglu and P. S. Fisher, “Image quality measures and their performance,” IEEE Trans. Commun., vol. 43, no. 12, pp. 2959–2965, Dec. 1995.
[10] M. G. Martini, C. T. Hewage, and B. Villarini, “Image quality assessment based on edge preservation,” Signal
Process., Image Commun., vol. 27, no. 8, pp. 875–882,
2012.
[11] N. B. Nill and B. Bouzas, “Objective image quality measure derived from digital image power spectra,” Opt.
Eng., vol. 31, no. 4, pp. 813–825, 1992.
[12] A. Liu, W. Lin, and M. Narwaria, “Image quality assessment based on gradient similarity,” IEEE Trans.
Image Process., vol. 21, no. 4, pp. 1500–1511, Apr. 2012.
[13] Z. Wang, A. C. Bovik, H. R. Sheikh, and E. P. Simoncelli, “Image quality assessment: From error visibility to structural similarity,” IEEE Trans. Image Process., vol. 13, no. 4, pp. 600–612, Apr. 2004.
[14] Anil K. Jain, Karthik Nandakumar, and Abhishek Nagar,(2008), “Biometric Template Security”, Hindawi Publishing Corporation, EURASIP Journal on Advances in Signal Processing, Article ID 579416.
[15] S. Shah and A. Ross, “Generating synthetic irises by feature agglomeration,” in Proc. IEEE ICIP, Oct. 2006, pp. 317–320.
[16] H. R. Sheikh and A. C. Bovik, “Image information and visual quality,” IEEE Trans. Image Process., vol. 15, no. 2, pp. 430–444, Feb. 2006.
[17] R. Soundararajan and A. C. Bovik, “RRED indices: Reduced reference entropic differencing for image quality ssessment,” IEEE Trans. Image Process., vol. 21, no. 2, pp. 517–526, Feb. 2012.
[18] Z. Wang, H. R. Sheikh, and A. C. Bovik, “No-reference perceptual quality assessment of JPEG compressed images,” in Proc. IEEE ICIP, Sep. 2002, pp. 477–480. [19] X. Zhu and P. Milanfar, “A no-reference sharpness
metric sensitive to blur and noise,” in Proc. Int. Workshop
Qual. Multimedia Exper., 2009, pp. 64–69.
[20] A. K. Moorthy and A. C. Bovik, “A two-step framework for constructing blind image quality indices,” IEEE Signal
Process. Lett., vol. 17, no. 5, pp. 513–516, May 2010.
[21] A. Mittal, R. Soundararajan, and A. C. Bovik, “Making a ‘completely blind’ image quality analyzer,” IEEE Signal
Process. Lett., vol. 20, no. 3, pp. 209–212, Mar. 2013.
[22] (2012). LIVE [Online]. Available:
http://live.ece.utexas.edu/research/ Quality/index.htm. [23] Damon M. Chandler, Member, IEEE, and Sheila S.
Hemami, Senior Member, IEEE
“VSNR: A Wavelet-Based Visual Signal-to-Noise Ratio for Natural Images” IEEE Transactions on Image
Processing, vol. 16, no. 9, September 2007.
[24] Zhou Wang and Alan C. Bovik “A Universal Image Quality Index” IEEE Signal processing Letters, vol. 9, no. 3, pp. 81-84, March 2002.
[25] Samarth Bharadwaj, Himanshu Bhatt, Mayank Vatsa, Richa Singh, and Afzel Noore, “Quality Assessment based Denoising to Improve Face Recognition Performance”. [26] Pina Marziliano, Frederic Dufaux, Stefan Winkler,
Touradj Ebrahimi, “Perceptual blur and ringing metrics: application to JPEG2000” Signal Processing: Image Communication 19 (2004) 163–172.
[27] Himanshu S. Bhatt, Samarth Bharadwaj, Mayank Vatsa, Richa Singh ,IIIT Delhi, India, Arun Ross, Afzel Noore West Virginia University, USA; “A Framework for Quality-based Biometric Classifier Selection”.
[28] Johannes Merkle, Michael Schwaiger, Oliver Bausinger, Marco Breitenstein, Kristina Elwart, Markus Nuppeney; “Towards Improving the NIST Fingerprint Image Quality (NFIQ) Algorithm (Extended Version)”.
[29] T. Hastie, R. Tibshirani, and J. Friedman., The Elements of
Statistical Learning. New York, NY, USA:
Springer-Verlag, 2001.
[30] M. Fontani, T. Bianchi , A. De Rosa, A. Piva , M. Barni., “ A Dempster-Shafer Framework for Decision Fusion in Image Forensics”.
[31] Imran Naseem and Mohamed Deriche Electrical