Abstract—In an oven, the hot air flows by natural or forced convection while heat is distributed from the heating element by radiation. During baking process, heat is also transfer by conduction from the baking metal container to the baked product. Radiation is considered as the main process of heat transfer occurred in the oven. Use of network representation method provides a useful tool for visualizing radiation exchange. However, not many papers have been published in using this technique. Due to that, this paper presents the development of network representation method for calculating the radiation behavior and observing the temperature profiles in the oven during baking process. The network is built based on identifying nodes associated with radiosities of each surfaces in the oven. Two types of oven were used to identify the radiation effect. The results show high emissivity oven (black surface) gives more radiation energy compared to low emissivity oven (shiny surface).
Index Terms—Baking, network representation method, oven, radiation heat transfer.
I. INTRODUCTION
In baking oven, typically there is a heating element, a heat transfer medium such as a pan or tray and the food itself. The heat moves from the heating element through the medium to the food. Temperature and heat are often used interchangeably, but they are not the same thing. Temperature is the driving force for heat transfer. Like gravity moves masses, temperature moves heat. Heat moves from high temperature to the lower temperature. In other words, a temperature difference causes the heat to move. Heat transfer plays a significant role during baking process. It consists of conduction, convection and radiation modes. Thermal radiation is considered one of the main processes of heat transfer occurred in the oven during baking process.
According to Zheleva and Kambourva [1], the top surface of the product in the oven is heated mainly by radiation and only little part of the heat is transferred by convection which is less than 10%. To analyze the individual mode of heat transfer during baking process is very complicated. Several studies have used heat flux meters or h-monitors to measure the heat flux inside the oven [2], [3]. But, the disadvantage of using this tool is that it could not measure the individual mode of heat transfer.
Most of the researcher used radiation model such as discrete ordinate (DO) and surface-to-surface (S2S) in analyzing the radiation effect [4] to [6]. DO model takes into
Manuscript received June 5, 2012; revised June 30.
The authors are with faculty of Chemical Engineering, Universiti Teknologi MARA (UiTM), 40450 Shah Alam, Selangor, Malaysia (e-mail: [email protected]).
account media participation while S2S model does not account for the contribution of the gaseous media. Currently, many researchers have studied the bread baking process conditions such as temperature and time, oven design and bread dough formulations that can be found in the literature. However, the information regarding the effect of heat transfer especially radiation heat transfer inside the oven during baking process is scarce. Less paper was published on the technique used to analyze the radiation. Therefore, this article focuses on the development of network model and the understanding on radiation affects during baking process.
Network representation method seems to be useful to analyze radiation in an enclosure such as oven and furnace. It was first introduced by Oppenheim [7] in year 1956. A few study has been accomplished using this technique in this field of research [8], [9], but not many papers have been published on the radiation heat transfer especially for oven analysis. The objective of this paper is to apply the network method in the baking oven to calculate the net radiation heat transfer. The network is developed from radiation properties including view factors, reflectivites, emissivities and radiosities.
II. NETWORK REPRESENTATION MODEL DEVELOPMENT
A. Wall Surface Temperature Measurement
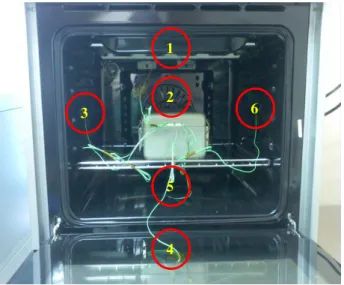
Heating process in the baking oven under natural convection mode was conducted at 180, 200, and 220°C. Six set of thermocouples are placed inside the oven chamber to measure the temperature. Data logger will be used to record all the data required with time interval of 1 minute at each surfaces inside the oven for total time approximately to 30 minutes tops. Fig. 1 shows the thermocouple placement inside the oven with top surface as surface 1, back surface as surface 2, left surface as surface 3, front surface as surface 4, right surface as surface 5 and bottom surface as surface 6. In order to attach the thermocouples probes to each inside surface of the oven, polyamide tape was used as it has the durability of high temperature conditions.
B. Radiation Heat Transfer analysis
Radiation heat transfer rate was calculated using network representation method. The analysis of radiation inside the oven was carried out by assuming the walls of the oven are modeled as diffuse, opaque and gray surfaces [10]. Each surface of the oven is assumed isothermal and uniform radiosity. The medium within the space inside the oven is taken to be non-participating. Conduction and convection effects during heating process are negligible and no heat loss from the oven is assumed. The net radiation heat transfer per
Application of Network Representation Model for
Radiation Analysis
unit surface area, qi, is determined from each surface.
Radiosity, J, is the radiation heat transfer energy that leaves a surface and irradiation, G, accounts for all of the radiation heat transfer energy received by a surface.
Fig. 1. Thermocouple placement inside the oven
The net rate at which radiation leaves surface i, qi, is equal
to the difference between the radiosity and irradiation of surface i:
i i
i
i
A
J
G
q
(1)For an opaque surface, the radiosity, written as:
i
i bii
i
E
G
J
1
(2)Substituting (2) into (1), it follows that:
i
i i i bi iA
J
E
q
/
1
(3)Using the reciprocity relation for view factors (AiFij = AjFji),
an alternative expression can be obtained for the net radiation heat flux from surface i:
N j j i iji
F
J
J
A
q
1
i (4)
where N is the total number of surfaces in the oven. Combining equations (3) and (4):
1
/
1
1
Nj i ij j i i i i i bi
F
A
J
J
A
J
E
(5)C. View factor
The view factors for each of the six surfaces must be computed. Equations that used to determine the view factors are:
1) Reciprocity relation
ji j ij
i
F
A
F
A
(6)2) Summation rule
1
1
N j ijF
(7)3) Aligned parallel rectangles
Y Y X X X Y X Y Y X Y X Y X Y X Y X F L Y L X X ij 1 1 2 1 2 1 2 1 2 2 1 2 1 2 1 2 2 1 2 2 2 2 tan tan 1 tan 1 1 tan 1 1 1 1 ln 2 / Y , / (8)4) Perpendicularrectangles
2 2 2 2 2 2 2 2 2 2 2 2 2 2 2 2 2 2 2 1 2 2 1 2 1 2 2 1 1 ij 1 1 1 1 1 1 1 ln 4 1 1 tan 1 tan 1 tan 1 Y/X W , / H W W H H W H H H W W H W W H W H W W H W H H H W W W F X Z H (9) To calculate radiation exchange of in an enclosure of Nsurfaces, a total of N2 view factors are needed [11]. Therefore, for six surfaces inside the oven, a total of 36 view factors need to be determined. All the view factors are arranged in the matrix form as shown below:
66 65 64 63 62 61 56 55 54 53 52 51 46 45 44 43 42 41 36 35 34 33 32 31 26 25 24 23 22 21 16 15 14 13 12 11 F F F F F F F F F F F F F F F F F F F F F F F F F F F F F F F F F F F F
Fig. 2. shows the configuration layout of view factors between surface 1 with other surfaces inside the oven.
D. Network Representation Method Procedure
The radiative energy balances can be represented in a network. Compared with an electric network, Ebi and Ji are
analogous to the potential; qi and qij are analogous to the
current and resistances, respectively. The network analogy provides a useful way for visualizing radiation exchange in an enclosure and is a convenient tool for calculating the radiative exchange in an enclosure consisting of two or more surfaces.
Fig. 3. Configuration layout for surface 1 with other surfaces inside the oven
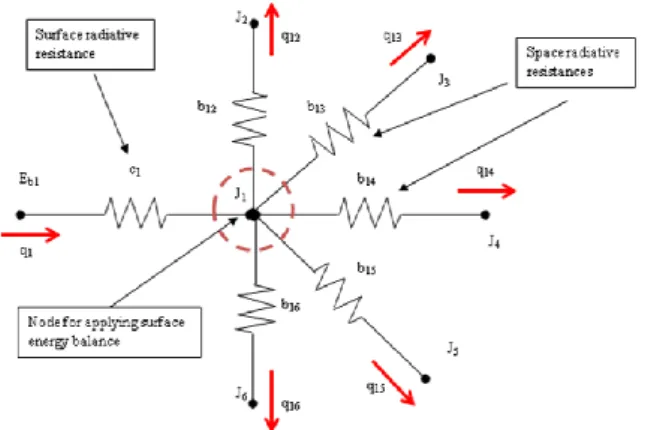
The radiation network is constructed by first identifying nodes associated with the radiosities of each surface. Then each radiosity node is connected to each of the other radiosity nodes through the appropriate resistances. The final step is to connect the blackbody emissive powers associated with the temperature of each surface to the radiosity nodes, using the appropriate form of the surface resistance.
The network representation model for one surface is as shown in Fig. 3. The complete network involving six surfaces of the baking oven is shown in Fig. 4.
Defining the following variables to simplify the notation:
Fig. 4. Network representation for surface 1 with other surfaces in the oven
For surface radiative resistances:
1) Resistance connects to emissive power:
i i i i
A
c
1
(10)2) Resistance connects to radiosity:
ij i
ij
A
F
b
(11)εi = emissivity of each surface inside the oven. The inside
oven wall is coated with black enamel powder coating which has an emissivity of 0.80 and the front glass door of the oven has an emissivity of 0.92.
Ai= Area of each surface inside the oven
Note that AiFij = AjFji. Therefore,
ij i
ij
A
F
b
(12)Substituting (10) and (11) into (5), the following equation will be obtained:
N j ij j i i i bi b J J c J E 1 (13)Expanding (13) for surface 1 gives:
0 16 6 1 15 5 1 14 4 1 13 3 1 12 2 1 1 1 1 b J J b J J b J J b J J b J J c J Eb (14)The radiosity equations (J1 to J6) were solved
simultaneously using Gauss-Seidel iteration method.
E. Gauss-Siedel Iterations
Application of the Gauss-Siedel method to the system of equations represented by equation (14) is facilitated by the following procedure:
1) The equations should be reordered to provide diagonal elements whose magnitudes are larger than those of other elements in the same row. Rearranging (14) will get the following equation:
1 16 15 14 13 12 6 16 5 15 4 14 3 13 2 12 1 1 1 1c b b b b b J b J b J b J b J b c E J b
(15)
2) After reordering, each of the equations should be written in explicit form for the radiosity associated with its diagonal element. Each radiosity in the solution vector would then be of the form:
1 1 16 15 14 13 12 1 6 16 1 5 15 1 4 14 1 3 13 1 2 12 1 1 1 c b b b b b J b J b J b J b J b c E J n n n n n b
n (16)
3) At initial (n = 0) value is assumed for each radiosity, Ji.
Subsequent computations may be reduced by selecting values based on rational estimates of the actual solution. Setting n = 1 in (16), values of Ji(n) are then calculated
by substituting assumed (second summation, n-1 = 0) or new (first summation, n = 1) values of Jj into the right
hand side. This step is the first (n = 1) iteration. The iteration procedure is continued by calculating new values of Ji(n) from the Jj(n) values of the current
iteration. The iteration is terminated when a prescribed convergence criterion is satisfied. The criterion may be expressed as:
J
J
in1e
n
i
where e represents an error in the temperature which is considered to be acceptable (e≤ 0.1).
Once radiosity value is obtained, the radiation heat transfer at surface i (q1 to q6) can be calculated using equation (4). Net
radiation heat transfer rate, qi was computed by adding the
radiation rates for each surface, qij. For example, to calculate
net radiation rate for top surface (surface 1), equation (4) is used to determine the radiation rates between surface 1 and other surfaces inside the oven.
Fig. 4. Network representation for six surfaces inside the oven
Table I represents the values of view factor, radiosity and radiation rate between surface 1 and other surfaces.
TABLE I: RADIATION RATE VALUES
Surfaces, ij View factor,
Fij Radiosity, Ji (W)
Radiation rate, qij
(W)
11 0 J1 = 4210.36 0
12 0.192 J2 = 3568.25 24.36
13 0.179 J3 = 3410.21 28.30
14 0.192 J4 = 2397.62 68.78
15 0.179 J5 = 3317.90 31.57
16 0.259 J6 = 3943.48 12.68
Net radiation rate, q1 165.7
III. TEMPERATURE PROFILES
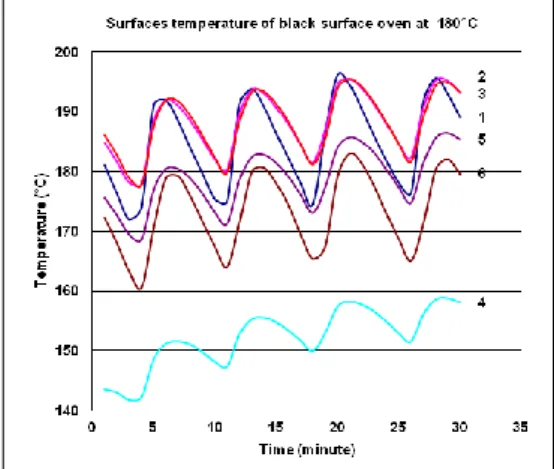
During the experiment, two types of oven were used to identify the radiation effect, black surface oven and shiny surface oven. Oven temperatures were set up at 180°C, 200°C and 220°C to generate different surface temperature profiles. Surface temperature of the oven including top, back, left, front, right and bottom temperature were measured for 30 minutes of heating time. The temperature profiles of each surface are shown in Fig. 5 to 10. It was observed that the front side surface was always lower than other sides of the oven. This is because of the physical material since the front side of the oven is made from the glass and the glass is a good thermal insulator. All surface temperatures in the black surface oven seem fluctuate with same trend for 30 minutes of heating. The temperature decrease and increase repeatedly at 5 minutes intervals in duration of 30 minutes. This situation occurs due to irregular circulation of hot air during heating process. Nevertheless, surface temperature at shiny surface oven is more stable than black surface oven by showing the
temperature fluctuation is repeated at every 15 minutes. Shiny surface resulting the reflection of heat from each surface and produce a more stable temperature circulation with slightly fluctuation during the heating process. Based on these findings, it is found surface of the oven used will affect the stability of the temperature in the oven. This was confirmed by the theory of heat transfer; thermal radiation plays an important role as a black surface cause more heat to be absorbed and a shiny surface causing more heat to be reflected.
Fig. 5. Surface temperature profile in the black surface oven at 180°C (1-top, 2-back, 3-left, 4-front, 5-right and 6-bottom)
Fig. 6. Surface temperature profile in the black surface oven at 200°C (1-top, 2-back, 3-left, 4-front, 5-right and 6-bottom)
Fig. 8. Surface temperature profile in the shiny surface oven at 180°C (1-top, 2-back, 3-left, 4-front, 5-right and 6-bottom)
Fig. 9. Surface temperature profile in the shiny surface oven at 200°C (1-top, 2-back, 3-left, 4-front, 5-right and 6-bottom)
Fig. 10. Surface temperature profile in the shiny surface oven at 220°C (1-top, 2-back, 3-left, 4-front, 5-right and 6-bottom)
Fig. 11. Radiation heat transfer profile in the black surface oven at 180°C
Fig. 12. Radiation heat transfer profile in the black surface oven at 200°C
Fig. 13. Radiation heat transfer profile in the black surface oven at 220°C
IV. RADIATION PROFILES
All surface of matter constantly radiates energy in the form of electromagnetic waves. The amount of energy emitted depends strongly on the temperature of the surface matter. Since all surface that radiate heat will also absorb heat, it follows that all surfaces that can see each other are exchanging heat between them. The radiation exchange in the oven is very complicated. Radiation heat is transferred from one surface to another. Some of the energy is absorbed and some is reflected. Network representation method is used to analyze the radiation. The analysis inside the oven was carried out by assuming the walls of the oven are modeled as diffuse, opaque and gray surfaces. Real surfaces are extremely difficult to work with it, so modeled as gray surface allows a better approximation to the modeling of real surfaces. Each surface of the oven is assumed isothermal and uniform radiosity. The medium within the space inside the oven is taken to be nonparticipating. Conduction and convection effects during heating process are negligible and no heat loss from the oven is assumed.
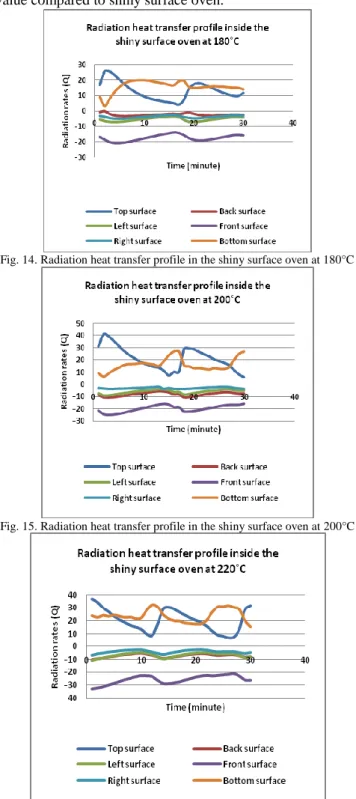
The data found changed significantly but repeated with the same trend for every five minutes intervals. In contrast, radiation distribution at shiny surface oven present almost consistent by showing slight fluctuation during heating process. The black surface oven shows high radiation rates value compared to shiny surface oven.
Fig. 14. Radiation heat transfer profile in the shiny surface oven at 180°C
Fig. 15. Radiation heat transfer profile in the shiny surface oven at 200°C
Fig. 16. Radiation heat transfer profile in the shiny surface oven at 220°C
V. CONCLUSION
In this study, the analysis on the effect of radiation heat transfer inside the oven under natural convection mode was performed using the network representative method. Radiation is considered as the main process of heat transfer occurred in the oven. Application of network representation method provide useful for analyzing radiation heat transfer in the baking oven.
The network representative method is the method that uses electrical network analogy that shows net radiation exchange in an enclosure. Net electrical network can be derived base from the heating element within the oven chamber to the surrounding air inside the chamber itself. Most practical problems in radiation heat transfer through a medium which is both absorbing and transmitting and usually involving gases as example of medium. Considering in a simple case, two non-transmitting surfaces which facing each other. The spaces between these surfaces are let occupied by a transmitting and absorbing medium.
From the surfaces involves, the electrical network were derived based on surfaces to surfaces that absorbs and transmits radiation. The exchange process between surfaces is represented by electrical network. And for the radiation exchange that occurred inside the oven chamber is considered as real body surfaces.
From the experiment, the signification of radiation behavior during baking was observed due to the inconsistently profiles. Selection of oven surface type is important due to radiation effect. Black surface gives more radiation heat energy compared to shiny surface. Therefore, high emissivity oven (black surface) could enhance the heat transfer during baking process and so will cause the bakery product is cooked evenly.
ACKNOWLEDGMENT
The authors would like to appreciate for the financial and encouragement provided by Ministry of High Education, Malaysia and special thanks to those who give fully support towards this project.
REFERENCES
[1] I. Zheleva and V. Kambourova, “Identification of Heat and Mass Transfer Processes in Bread during Baking,” Thermal Science, vol. 2, 73-86, 2005.
[2] M. R. Zareifard, V. Boissonneault, and M. Marcotte, “Bakery Product Characteristics as Influenced by Convection Heat Flux,” Food
Research International, vol. 42, pp. 856-864, 2006.
[3] O. D. Baik, S. Grabowski, M. Trigui, M. Marcotte, and F. Castaigne, “Heat transfer coefficients on cakes baked in a tunnel type industrial oven,” Journal of Food Science, vol. 64, no. 4, pp. 688-694, 1999. [4] H. Mistry, Ganapathi-subbu, S. Dey, P. Bishno and J. L. Castillo,
“Modeling of transient natural convection heat transfer in electric ovens,” Applied Thermal Engineering, vol. 26, pp. 2448-2456, 2006. [5] H. Mistry, G. Subbu, S. Dey, P. Bishno, and J. L. Castillo, “A methodology to model flow-thermals inside a domestic oven gas oven,” Applied Thermal Engineering, vol. 31, pp. 103-111, 2011. [6] Z. Rek, M. Rudolf, and I. Zun, “Application of CFD simulation in the
development of a new generation heating oven,” Journal of
Mechanical Engineering, vol. 58, no. 2, pp. 134-144, 2012.
[7] K. Oppenheim. “Radiation Analysis by the Network Method,”
Transactions of the ASME, vol. 54, pp.725-735, 1956.
[8] S. Saedodin, M. Torabi, J. M. Kandelousi and N. Maghsodloo. Application of Net Radiation Transfer Method for Optimization and Calculation of Reduction Heat Transfer, Using Spherical Radiation Shields. World Applied Sciences Journal. 2010, 11 (4): 457-461. [9] J. Zueco, P. Eguía, E. Granada, J. L. Míguez and O. A. Bég. “An
electrical network for the numerical solution of transient mhd couette flow of a dusty fluid: Effects of variable properties and hall current,”
International Communications in Heat and Mass Transfer, vol. 37, pp.
1432–1439, 2010.
[10] F. P. Incropera, D. P. DeWitt, T. L. Bergmann, and A. S. Lavine,
Fundamentals of Heat and Mass Transfer, John Wiley and Sons, 2007.