LOCAL STUDY OF DEFECTS DURING SINTERING OF UO
2:
IMAGE PROCESSING AND QUANTITATIVE ANALYSIS TOOLS
E
RICG
IRARD1,2, J
EAN-M
ARCC
HAIX1, F
RANÇOISV
ALDIVIESO2, P
ATRICEG
OEURIOT2 ANDJ
ACQUESL
ECHELLE31
SIMAP –INPGrenoble-CNRS-UJF B.P.75, F-38402 Saint Martin d'Hères Cedex,France; 2Ecole Nationale Supérieure des Mines de Saint-Etienne, Centre SMS, CNRS UMR 5146 PECM, 158 Cours Fauriel, F-42023 Saint-Etienne cedex 02, France; 3Centre d'Etudes de Cadarache, CEA, F-13108 Saint Paul lez Durance cedex, France
e-mail: [email protected]; [email protected]; [email protected]; [email protected]
(Accepted. May 6, 2008)
ABSTRACT
This paper describes the image analysis tools developed and used to quantify the local effects, of heterogeneities during sintering of ceramic materials applied in nuclear fuels. Specific materials, containing a controlled dispersion of well defined heterogeneities (dense or porous aggregates) in the ceramics matrix have been prepared and sintered. In order to characterize the materials in the vicinity of these likely isolated heterogeneities, large SEM images are first acquired around heterogeneities. Image processing tools are used to segment the relevant elements of the microstructure: ceramic grains and porosity (intra- and inter-granular). An analysis procedure is then developed to analyse the evolution of the main microstructure features (pore volume fraction, pore size, grain size) during sintering, with the distance to the matrix-heterogeneity interface as reference parameter. An evaluation of the anisotropy of repartition of pores and grains around the heterogeneities is also proposed. Some illustrative results are presented, which evidence a rather short range of mean interactions, and a significant rather long range of the anisotropy effect related to the matrix-heterogeneities interactions during the undidirectional compaction.
Keywords: ceramics, image analysis, materials science, metallography, microstructure, sintering, sintering heterogeneities.
INTRODUCTION
Heterogeneities are always present in green compacts and evolve during sintering (Lange, 1984; Ciftcioglu et al., 1987; Lim et al. 2000). These heterogeneities (or “defects”), such as aggregates or large pores, are the source of microstructural defects which have a serious and detrimental influence on mechanical and thermo-mechanical properties of the material. The effects of these heterogeneities have been observed and in some cases interpreted (Evans, 1982; Uematsu et al., 1995; Shinohara et al., 2000), but most of the quantifications are macroscopic: although quantitative image analysis has been used by many authors in the field of sintering (Chaix, 2000) experimental quantitative analysis of local microstructures evolution during sintering with
MATERIALS AND METHODS
EXPERIMENTS
The ceramic matrix was an UO2 powder, and the
defects were made from the same powder, to avoid uncontrolled chemical effects of the heterogeneities.
(a) (b)
(c) (d)
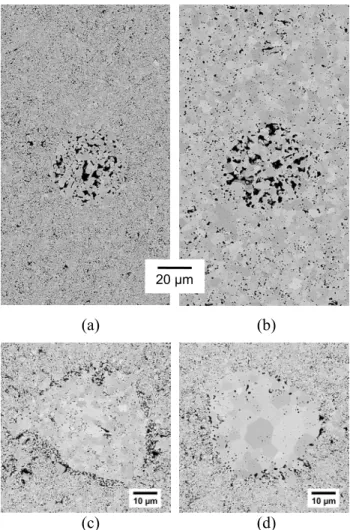
Fig. 1. Local microstructure for different defects and sintering conditions: (a) porous aggregate, 1500 °C, 1minute. (b) porous aggregate, 1700 °C, 1 h. (c) dense aggregate, 1500°C, 1minute. (d) dense aggregate, 1700 °C, 1 h.
Two types of defects have been used (Fig.1): porous aggregates obtained from the natural aggregates of the powder, and dense aggregates obtained from powders compressed at 200MPa and broken by ball milling. Both kinds of aggregates were calibrated in the range 40-60 µm by sieving, then sintered in different conditions to get different levels of consolidation. Green compacts containing 3 vol% of each specific kind of aggregates were prepared and sintered at different temperatures: 1500°C, 1600°C, 1700 °C, 1700 °C 20 min or 1700 °C 60 min. This small volume
fraction of defects dispersed in the matrix was chosen in order to have mostly independant defects, far enough from one another while keeping a high enough probability to observe them on cross sections.
The cross sections of the samples were systema-tically realized in plans containing the comp action axis, and the images orientation carefully chosen so that the “y axis” corresponds to the compaction direction.
Thermally etched polished sections of the samples were investigated in the vicinity of likely isolated heterogeneities. Only 40-50 µm defect sections were selected, to ensure that the analysed defects were cut in the vicinity of their diametral plane, so that the bias on the evaluation of the distance to the boundary was limited. A fine mapping of each heterogeneity and its surrounding matrix was needed. The examples on Fig.1 illustrate the constraints on the image size and resolution: elementary objects (pores and grains) range from typically 0.1 to 10 µm, and the effects of interactions must a priori be characterized at distances up to several defect diameters. A compromise was adopted to get images with sufficient resolution and large enough fields. This first needed the careful acquisition of several elementary images (typically 7 × 9 images with 10% overlapping) for each defect, to cover the whole field of interest. These high resolution SEM images (Jeol JSM 6500 FEG-SEM, 15 kV acceleration voltage) were first processed to reduce the noise (Overton and Weymouth, 1979), limit the initial resolution, and homogenize the grey levels between the different elementary images. They were in a second step assembled in a single image using the “MIAC” (Multiple Image Alignment) module of the Analysis software (Soft Imaging System). The assembled images were typically 3500 × 3500 pixels, with effective pixel size of 45 nm, covering about 150 × 150 µm2.
SEGMENTATION OF IMAGES: PORES
AND GRAIN BOUNDARIES.
An essential point for image analysis measurements is to have reliable segmented images in which the objects of interest, i.e., grains and pores, are clearly identified. In the present case, there is a strong dispersion in the characteristics of images (quantities and sizes): grain boundaries are differently revealed by the thermal etching (varying grey level and apparent width); grain sizes strongly differ from one sintering process to another; in some cases small and large grains are present in the same areas; contrast and luminosity differ from one image to another...
5 µm
(a) (b)
(c) (d)
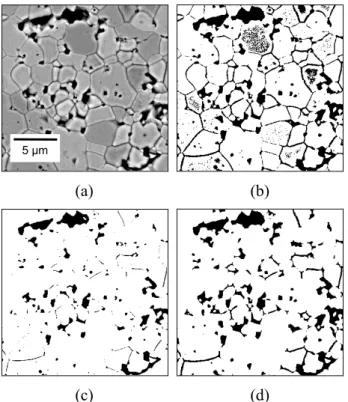
Fig. 2. Segmentation of pores. (a) grey level image. (b) entropy threshold. (c) maximum contrast threshold, (d) geodesic dilation of (c) inside (b).
This classic practical problem, i.e., that each microstructure has almost to be treated with its own specificities (Wojnar, 1999) has lead here to develop up to 5 adapted procedures, corresponding to the 5 sintering cycles. However, the methodology is based on similar processes, corresponding to similar basic image characteristics, with only some variations in the nature, size, and order of use of the filtering operations.
The segmentation of pores (Fig.2) is based on
the combination of two automatic thresholding methods. Entropy thresholding (Kapur et al., 1985) leads to correct pores boundaries, but also detects dark objects which are not porosity (parts of grain boundaries and of dark grains). Maximum contrast thresholding (Kohler, 1981) does not lead to these undesired objects, but underestimates the pores. A correct reconstruction of pores is then obtained by performing geodesic dilation, based on classic mathematical morphology (Serra, 1982; Coster and Chermant, 1989), of the second image inside the first one. In some cases some enlarged grain boundaries are at this step considered as pores. This parasitic porosity is due to the excess of thermal etching which leads to a local enlargement of some grain boundaries; it is eliminated if necessary by morphologic tools.
(a) (b)
(c) (d)
Fig. 3. Segmentation of grain boundaries and final extraction of information from the grey level initial image of Fig. 2a. (a) rough determination of grain boundaries. (b) grain boundaries + pores. (c) individual identification of grains. (d) separation of intra (green) and inter(red)-granular pores.
The segmentation of grains (Fig.3) involves 3
main steps:
i. prefiltering of grey level image: classic noise reduction filters have been performed when necessary. To facilitate the final checking of segmentation, contrast enhancement has also been used: JASC PaintShop Pro 6 and Adobe Photoshop softwares proved to be suitable for this “eye-oriented” purpose.
ii. extraction of a rough image of grain boundaries by over-thresholding: the obtained image (Fig.3a) shows enlarged boundaries and undesired objects, but the grain boundaries are detected as an almost continuous network.
for some types of images (Fig. 4). The obtained one pixel wide network is then added to the previous pore image (Fig. 2d) to get the image of separated grains (Fig. 3b). ADCIS Aphelion Software was used here.
Fig. 4. Chain closure procedure: for a given chain endpoint, a search area is defined from direction of the last two points (black line) and an angular parameter (here ±π / 4), and a maximum distance. The closest point obeing this constraints if any is used to close the chain.
Finally, grains are individually identified (Fig.3c). Combining the grains image (Fig. 3b) and the pores one (Fig. 2d), the pore population can be separated into intra- and inter- granular pores, located inside grains and at grain boundaries respectively (Fig. 3d).
QUALITY CONTROL
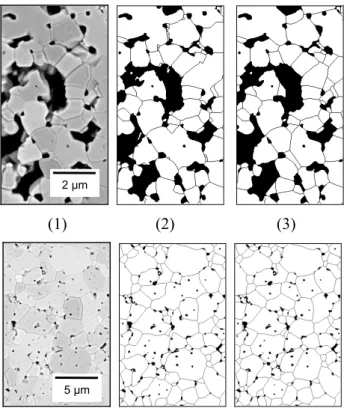
The efficiency of these procedures is of course not full, so that some excess or lacking grain boundaries always exist (Fig. 5). It is of great importance to evaluate the consequences of these defaults on the measurements.
In the present work, some series of images have been manually corrected, and the measurements on uncorrected and corrected images have been compared. Some parameters are almost insensitive to these corrections (e.g., the total pore volume fraction or the pore sizes, as far as most corrections are concerned with grain boundaries), some are more sensitive (the intra-granular porosity for instance, for which less than 1% error in absolute value represents up to 20%, in relative value). In most cases, the relative difference remains acceptable for important parameters, such as in the case of grain size (Fig. 6).
2 µm 2 µm
(1) (2) (3)
5 µm 5 µm
Fig. 5. Examples of manual corrections on images in a porous aggregate (top) and in a dense aggregate (bottom). (1) grey level image – (2) automatic segmentation – (3) hand corrected image.
0 0.5 1 1.5 2 2.5 3 3.5 4
Sintering Cycle
Mean gr
ai
n di
am
et
er
(µ
m
)
as processed corrected 1500°
1700°C
1700°C
1600°
1700°C 20'
Fig. 6. Comparison of average grain size measurements in porous aggregates (presintered 120 min at 1700 °C) for as-processed and manually corrected images.
MICROSTRUCTURE
PARAMETERS
– the pore volume fraction VVP (“porosity”), measured
from the 2D area fraction on images, for total, inter- and intra-granular pores;
– the grain diameter DG, measured from the (2D)
area of each grain section: diameter of the disk with the same area (equivalent disk diameter); – the pore diameter DP (idem).
20 µm 20 µm
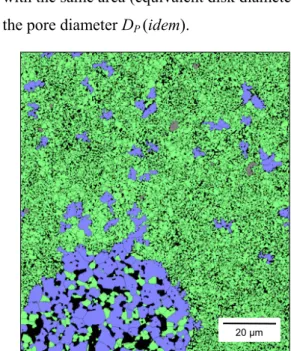
Fig. 7. Chart of grains sizes in and around a porous aggregate, with a two-color coding of grain sizes (large blue, small green).
Area weighed mean values of size parameters have been used. This was very useful in local analysis: to calculate a mean grain or pore size in a given sub-region of an image, careless of the fact that the sub-region cuts or not the grains, because each grain (resp. pore) contributes for its part to the considered region. In practice, charts can be defined for each parameter, by affecting to each pixel the parameter value of the object it belongs to (grain size in grains, pore size in pores…), and mean values can be calculated directly from the pixels. These charts are also a very efficient viewing tool to evaluate qualitatively the characteristics of the microstructure (Fig. 7).
RESULTS AND DISCUSSION
LOCAL MEASUREMENTS BY
ISODISTANCE REGIONS
Systematic measurements were performed, in order to get the local microstructure characteristics as functions of distance to the defect-matrix boundary. An accurate manual drawing of this boundary is first performed, which defines the defect region. Isodistance
regions are then simply calculated by usual dilations (outside the defect) or erosions (inside), using octagons with an adapted size as structuring elements, as a classic distance map (Fig. 8). These regions, referred with the corresponding distance r, are therefore used as masks to get the mean values of microstructure parameters as above explained.
Fig. 8. Isodistance regions from the defect boundary obtained using octagonal dilations for outside distances (r > 0); erosions are used for inside distances (r < 0).
The results have first been analysed (Girard et al, 2004) on the basis of the evolution of profiles to get informations on the local evolution during sintering. For instance, in the case of dense aggregates (1600 °C) (Fig. 9), the influence of distance r from the defect edge is limited to a relatively short range, smaller than the defect radius, while a strong influence (“constrained sintering”) is observed inside the defect.
0 1 2 3 4 5 6 7 8 9
-15 -10 -5 0 5 10 15 20 25 30 35 40
distance r to interface (µm)
me
an
di
ame
ter
(µm)
1500°C 1600°C 1700°C 1700°C 20' 1700°C 1h00
ANISOTROPY
Angular measurements were also realized in order to analyse the effects of compaction. For that purpose, directional measurements in y (compaction axis) and x (perpendicular axis) directions, by measuring angular sectors of aperture α in both directions (Fig. 10). In practice, α = π/3 was used, corresponding to 3 equivalent angular directions : x, y, and intermediate.
Fig. 10. Principle of anisotropy measurements. The parameters are measured at each distance r from the defect boundary in a given angular sector α in the considered direction.
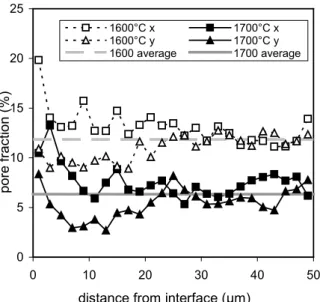
An example of results in the case of porous aggregates is presented on Fig. 11. The compaction induced anisotropy in the pore repartition is clearly evidenced, with a rather long typical range of action of about 30 µm, i.e., the order of the defect radius. Similar results are obtained for dense aggregates.
0 5 10 15 20 25
0 10 20 30 40 50
distance from interface (µm)
por
e fr
ac
tio
n (
%
)
1600°C x 1700°C x 1600°C y 1700°C y 1600 average 1700 average
Fig. 11. Anisotropic repartition of porosity (VVP) for
porous aggregates at two temperatures (α = π/3). The lines indicate large distance average values in all directions.
An index of anisotropy for any parameter p was defined:
(
)
∫
∫
=
p −pdrp dr py x
I
, (1)where px, py are the values in the x and y directions
respectively, and p the value averaged on all directions. In practice, the integration is limited to a maximum value of 40 µm, above which the differences are only irrelevant noise errors.
The evolution of the anisotropy index for porosity in the case of porous aggregates (Fig. 12) shows that anisotropy first increases during the sintering process, then tends to be reduced.
0.0 0.1 0.2 0.3 0.4 0.5 0.6
1500°C 1600°C 1700°C 1700°C 20'
1700°C 1h Sintering Cycle
P
or
os
ity
ani
sotr
opy
index
ag1 ag2 ag3
Fig. 12. Evolution of the anisotropy of pore volume fraction along the sintering cycle for porous aggregates. Anisotropy is almost constant for ag1 samples, which correspond to aggregates with small cohesion (presintered at 1600 °C); it is initially smaller but increases during the sintering in the case of defects with increasing strength ag2 and ag3, presintered at 1700 °C for 15 and 120 min respectively.
CONCLUSION
form a database of microstructure evolution. A first attempt of statistical analysis of this database has been realized (Girard et al., 2005)
REFERENCES
Chaix JM (2000). Image analysis, microstructure evolution and sintering mechanisms. In: Wojnar L, Rozniatowski K, eds. STERMAT 2000. Proceedings of the 6th International Conference on Stereology and Image Analysis in Materials Science. 2000 Sep 20-23; Krakow, Poland, 69-78.
Ciftcioglu M, Akinc M, Burkhart L (1987). Effect of agglomerate strength on sintered density for Yttria powders containing agglomerates of monosize spheres. J Am Ceram Soc 70:C329-34.
Coster M, Chermant JL (1989). Précis d'analyse d'images. Paris: Editions du CNRS.
De Hoff RT, Rhines FN (1968). Quantitative microscopy. New York: McGraw Hill.
Evans AG (1982). Considerations of inhomogeneity effects in sintering. J Am Ceram Soc 65:497-501.
Girard E (2004). Frittage du dioxyde d’uranium en présence d’hétérogeneites - caractérisation de l’évolution micro-structurale. PhD Thesis, ENSMSE, Saint Etienne, France. Girard E, Chaix JM, Carry C, Valdivieso F, Goeuriot P, Léchelle J (2005). Microstructure evolution of ceramics during sintering: an analysis based on local image analysis measurements in the vicinity of controlled defects. In: 4th Int. Conf. on Science, Technology and Applications of Sintering, 2005 sep 1-5; Grenoble, France, 436-9.
Girard E, Valdivieso F, Goeuriot P, Chaix JM, Léchelle J, Chiarelli G (2004). Sintering with Heterogeneities Characterization and Modelling of the Microstructural Evolution. Key Engineering Materials 264-268:197-200. Kapur JN, Sahoo PK, Wong AKC (1985). A new method
for grey level picture thresholding using the entropy of the histogram. Comput Vision Graphics and Image Proc 29:273-85.
Kohler R (1981). A segmentation system based on thresholding. Comput Vision Graphics and Image Proc 15:319-38.
Lange FF (1984). Sinterability of agglomerated powders. J Am Ceram Soc 67(2):83-9.
Lim LC, Wong P.M, Jan M (2000). Microstructural evolution during sintering of near-monosized agglomerate-free submicron Alumina powder compacts. Acta Materialia 48:2263-75.
Overton KJ, Weymouth TE (1979). A noise reducing preprocessing algorithm. In: Proc. IEEE Computer Society Conf. on Pattern Recognition and Image Processing; Chicago, Illinois, 498-507.
Serra J (1982). Image analysis and mathematical morphology. New-York: Academic Press.
Shinohara N, Okumiya M, Hotta T, Nakahira K, Naito M, Uematsu K (2000). Morphological changes in process-related large pores of granular compacted and sintered Alumina. J Am Ceram Soc 83:1633-40.
Uematsu K, Zhang Y, Uchida N (1995). Characteristics and formation mechanisms of defects in Alumina powder compacts. Ceram Trans 51:263-70.