Achieving Enterprise
Software Success
2009
1. Executive Summary Page 1
2. Behind The Research Page 2
3. An Increasingly Complex Environment Page 3 4. An Elusive Definition Of Success Page 5 5. A Blurred Picture Of Responsibility
And Accountability Page 9
6. The Drivers Of Success
For Software Investments Page 13
Insight
from software buyers and sellers on the
drivers,
expectations
and
responsibilities
for
success
1. Executive Summary
“Achieving Enterprise Software Success,” a research initiative of Neochange, SandHill.com and the TSIA, pulls back the curtain on the drivers, expectations and responsibilities surrounding the concept of software “success.” The 2009 survey of 353 software buyers and sellers yielded new insight into today’s IT environment.
•Complexity hinders software success. Two-thirds of survey respondents say the
enterprise IT environment is more complex than it was five years ago. The proliferation of technology combined with intricate organizational dynamics has raised the level of business IT complexity to the point of holding back software success.
• Success is in the eye of the beholder. Software sellers are far more likely than buyers to
cite “business benefits realization” as the number one definition of enterprise software success. Buyers are slightly more pragmatic, viewing user adoption and benefits realization as equal measures of success. While IT continues to stress the importance of the user-technology connection and providers point to IT leadership, both agree “people issues” rather than “technology issues” are the greatest barriers to success.
• IT is left holding the bag when success is elusive. More than three-fourths of
respondents say the buyer organization – not the software vendor – is responsible for ensuring successful software solutions. On top of that, 59 percent say the CEO will hold the IT group responsible for a lack of success. If top management holds IT accountable for software’s business impact – either directly or indirectly through their role as vendor managers – are line-of-business managers absolved of their responsibility?
• Installed software really matters. Increasing usage levels and leveraging upgradability
were rated the top two drivers of success for existing software deployments. With the software market maturing and IT spending being increasingly scrutinized, software providers and IT organizations need to work together on practical upgrades and user adoption strategies that can maximize the ROI on currently installed solutions.
• Financial upside is being left on the table. A total of 53 percent of respondents estimate
that typically, fewer than half of users are effectively using installed software in the enterprise. That means most companies are leaving benefits such as reduced costs, increased revenues and improved competitive differentiation on the table – benefits that were cited as the rationale behind the software investment in the first place.
• Effective usage drives business value. While enterprise software buyers remain wary of
vendor promises, 87 percent say they are interested in working with a partner to improve effective usage levels and drive business impact beyond technical implementation. These buyers will also reward proactive software companies that deliver solutions which enable effective usage that leads to measureable business value.
2. Behind the Research
Today’s challenging economy is driving software buyers to demand new levels of
productivity and value from their enterprise software solutions. At the same time, software vendors are working to meet the needs of their clients while navigating an increasingly complex world of technologies and business models.
“Achieving Enterprise Software Success – 2009” set out to uncover the specific factors that lead to the success of business applications. The study updates the findings of a similar survey released in 2008 and explains how the industry has changed over the past two years.
Achieving Enterprise Software Success is a joint partnership of SandHill.com, Neochange and the TSIA. As the online destination for software business strategy, SandHill.
com provided the expertise needed to best represent the software vendor perspective. Neochange’s in-depth knowledge of the software adoption experience at companies worldwide enabled the study to best capture the current sentiments of enterprise software adoption complexity. As a thought leader in the technology services arena, the TSIA contributed to the study for the purposes of advancing the revenue goals of its influential technology company members.
The survey was conducted during the summer of 2009. Respondents were invited to participate in an online survey in electronic newsletters from SandHill.com and CIO Insight. A total of 353 individuals completed the survey: 53 percent were I.T. buyers and 47 percent were software executives. The quotes displayed in the report are the comments of respondents provided during the survey.
3. An Increasingly Complex Environment
The software being installed into today’s enterprises becomes part of a complex business system. Global connectivity, multiple computing models, and disparate user groups, business-IT relationships – all of these factors conspire to make even a straightforward software application a challenge to deploy.
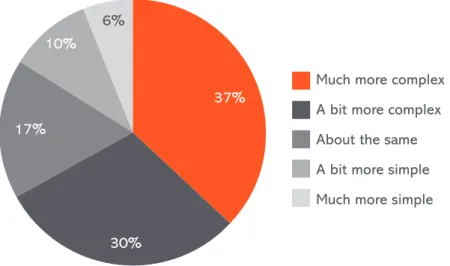
At the same time, the number of software platforms and delivery models has proliferated. It comes as no surprise, then, that two-thirds of respondents say enterprise IT environment are more complex than five years ago – with fully 37 percent saying it is “much more complex” (see Figure 1.)
Fig. 1: EntErprisE ComplExity – today vs. FivE yEars ago
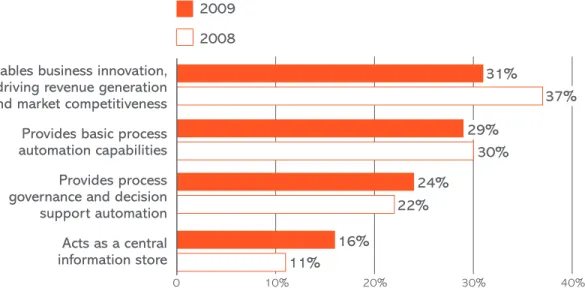
To add further complexity, the perception of the contribution of enterprise software varies tremendously. Clearly, enterprise software’s evolution to empower core business disciplines remains in transition. Less than one-third of respondents say software enables business innovation and a competitive advantage (see Figure 2). In fact, IT buyers are more likely to say that software is still really most focused on process automation.
This finding is a reversal from prior years where the concept of business innovation/ market competitiveness was rated higher (37 percent in 2008 vs. 31 percent in 2009). The drop could be explained by the currently challenging economic environment.
However, this change in perception combined with the increasingly complex environment may mean that enterprise software’s impact will continue to fall short of expectations moving forward.
Much more complex A bit more complex About the same A bit more simple Much more simple 6%
10%
17%
37%
Fig. 2: CorE BusinEss disCiplinE supportEd By EntErprisE soFtwarE – trEnd
“The major factor is IT engagement with business
management. If a productive dialogue prevails,
then any software system deployment has a good
chance of considerable success by all measures.
If not, a major software project will achieve
moderate benefits at best.”
IMPLICATIONS: The growing complexity of business is holding back the full promise of enterprise software. As more advanced software capabilities have been made available, the expectations of potential business impact have grown, and the promise of IT simplicity and higher business value has become more elusive. Regardless of how success if defined, companies need to break-through the organizational barriers that prevent software from delivering meaningful business impact.
Enables business innovation, driving revenue generation and market competitiveness Provides basic process automation capabilities Provides process governance and decision support automation Acts as a central information store 0 10% 20% 30% 40% 2009 2008 31% 37% 29% 30% 24% 22% 16% 11%
4. An Elusive Definition of Success
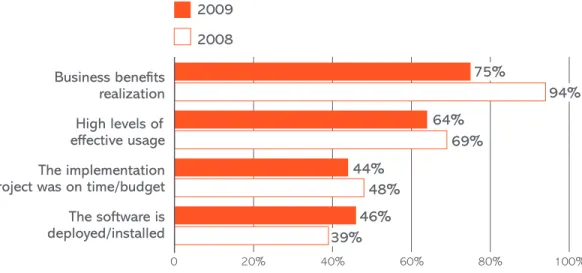
Clearly, both buyers and sellers are looking for software to help enterprises realize their business goals. Fully 75 percent of respondents define enterprise software “success” as the realization of business benefits, however this is down from 94 percent in 2008 (see Figure 3.)
The second most popular definition of enterprise software success was high levels of effective usage, cited by nearly two-thirds of respondents. Interestingly, the portion of respondents who cited simple installation as a definition of success grew from 39 percent in 2008 to 46 percent in 2009.
Fig. 3: dEFinition oF EntErprisE soFtwarE suCCEss - trEnd
“Companies need to have the patience to deploy
the complete solutions.”
Vendors are far more likely than buyers to see business benefits as the definition of success (85 percent vs. 68 percent, respectively, see Figure 4), not surprising considering the increasing pressure from buyers to evidence value that justifies maintenance fees. Buyers are more likely than vendors to cite high usage levels as an indicator of success (67 percent vs. 59 percent, respectively), which suggests this definition is a close proxy for business benefits.
“ROI equals success.”
Business benefits realization High levels of effective usage The implementation project was on time/budget The software is deployed/installed 0 20% 40% 60% 80% 100% 2009 2008 64% 75% 69% 94% 39% 46% 44% 48%
Fig. 4: dEFinition oF EntErprisE soFtwarE suCCEss – BuyEr vs. vEndor pErspECtivE
In terms of realizing value from enterprise applications, user adoption was by far the most cited driver by 72 percent of buyers and sellers (see Figure 5.) Functionality was a distant second-place driver with 16 percent of responses.
“Success depends on having easily deployable and
functional software with appropriate training and
policy support. New software is not readily accepted
by 80 percent of users, because they don’t see the
benefits, just the problems –a result of poor design
and functionality or over-complexity with features
and functions no one ever uses. Software designers
should look at the 90 to 95% of users who will be
using the software every day from a functionality
standpoint. And consider management’s needs
for process command and control, but keep it
manageable, but scalable. Too much information
is worse than no information. Too much
information becomes white noise.”
Business benefits realization High levels of effective usage Software is deployed/installed Implementation project was on time/budget 0 20% 40% 60% 80% 100% BUYERS VENDORS 47% 67% 68% 43% 59% 85% 48% 42%
Fig. 5: most important FaCtor For rEalizing valuE - trEnd
Looking at how things have changed in the past year, the importance of user adoption remained high. However, the importance of simple functionality has overtaken both “organizational change” and “process alignment” as the second most important driver.
“Time and time again, the effectiveness and
overall success of an enterprise-class piece of software
does not lie within the technology itself but in the
processes and procedures around them. Many a
software deployment delivers 100% on
the business requirements only to fail in the
final phase of user adoption.”
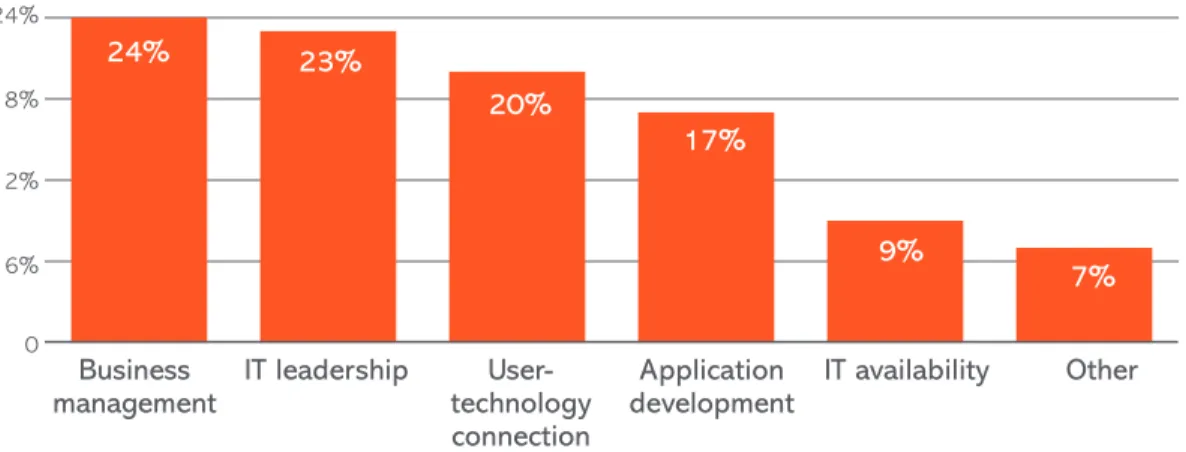
When analyzing the meaning of enterprise software “success,” it is equally important to understand causes of failure. “People” factors were the most common factors cited as undermining the success of software deployments. Nearly one-fourth of respondents said business managers were most often the dominant cause of failures, while 23 percent said IT leadership was the dominant problem (see Figure 6).
Fig. 6: organizational FaCtor whiCh most undErminEs thE suCCEss oF EntErprisE soFtwarE
Business
management IT leadership technology User-connection
Application
development IT availability Other
0 6% 12% 18% 24% 24% 23% 20% 17% 9% 7% Effective user adoption
Organizational change Process alignment Software functionality 0 20% 40% 60% 80% 16% 7% 13% 16% 6% 1% 70% 72% 2009 2008
“Success is always dependent on the engagement
of process owners and IT to align expectations and
workflows to gain the best advantage of any chosen
software solution. Process owners define the ‘what’,
IT defines the ‘how.’”
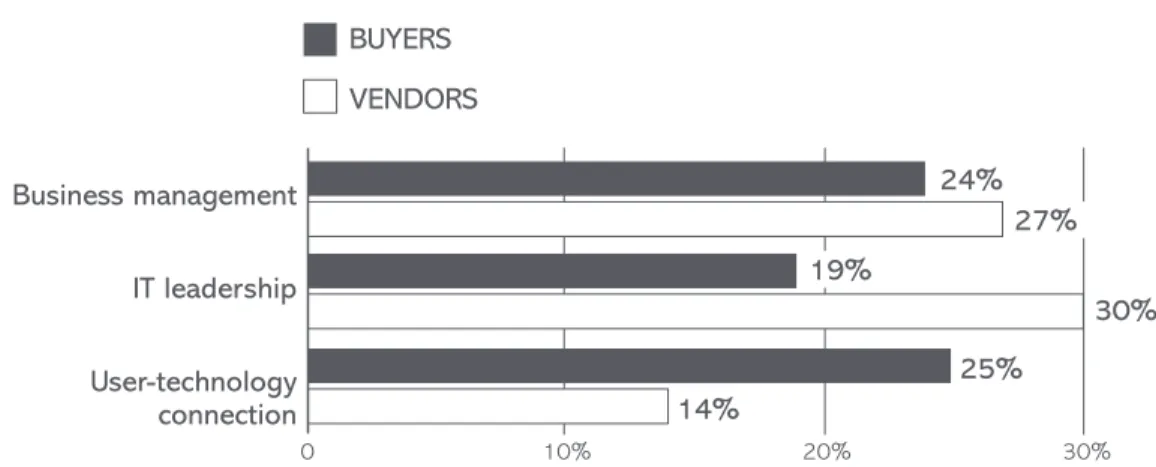
While there is continued convergence on effective user adoption having the most impact on success, the attributed sources of failure show much more divergence and point to an ongoing disconnect between buyers and sellers. Only 14 percent of vendors feel that technology usability and user capability was to blame, while 25 percent of buyers felt this was a dominant barrier to success in their organization (see Figure 7).
Vendors were also far more likely to point to IT leadership as the weak link (30 percent) than their IT executive counterparts (19 percent). Interestingly, both parties felt IT availability was the least problematic area for holding back IT-driven value.
Fig. 7: grEatEst FaCtor undErmining suCCEss – BuyEr vs. vEndor pErspECtivE
“With enterprise software, most IT buyers typically
encounter situations where the business does
not exhibit flexibility to adopt out-of-the-box
processes/features/best practices. They show a
high resistance to change.”
IMPLICATIONS: The distribution of potential barriers to software success reveals the texture of why IT-driven value remains so elusive. Compounding this challenge, the lack of alignment between providers and buyers on the dominant barrier accentuates the need for advancing end-user and business process monitoring capabilities. Transparency into actual root-causes is a necessity to break-through the organizational dynamics. Further, as it is agreed by both parties that business user management plays a significant role, this grounded transparency is critical to repositioning a lack of software success as less of a technical issue and more an issue of the human element.
BUYERS VENDORS Business management IT leadership User-technology connection 0 10% 20% 30% 14% 25% 19% 30% 27% 24%
5. A Blurred Picture of Responsibility and Accountability
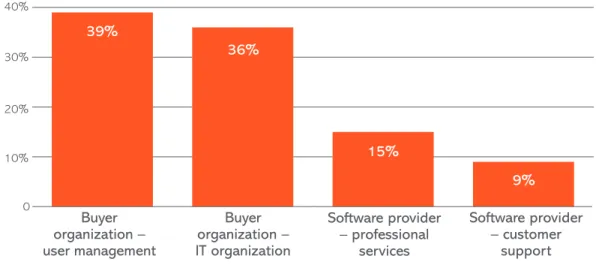
The varied perspectives on enterprise software success and failure beg an obvious question: Who is responsible for ensuring software success? Overall, 39 percent of respondents cited business user management as the most responsible group (see Figure 8), with 36 percent citing the IT organization as the most responsible party.
A total of 15 percent of respondents said the software vendor’s professional services group was most responsible, while only 9 percent cited the vendor’s support group, reflecting vendors limited involvement in the total customer adoption lifecycle.
Fig. 8: group most rEsponsiBlE For Ensuring suCCEssFul dEploymEnts
“The notion of enterprise software success is so
elusive. Success means different things to the buyer,
depending on his/her level in the organization.
Most buyers measure success at the project
level only. In my experience, an enlightened
minority concern themselves with deeper and more
impactful measures of success.”
A closer look at the difference between buyer and seller responses is revealing: each group is more likely to hold themselves responsible for success (see Figure 9). Buyers are far more likely to place responsibility with the IT group, and vendors are more likely to say the professional services organization. These responses are to be expected as the IT organization remains the dominant driver of enterprise software decisions and provider professional services are the dominant party conducting software deployments on behalf of the provider. Buyer organization – user management Buyer organization – IT organization Software provider – professional services Software provider – customer support 0 10% 20% 30% 40% 39% 36% 15% 9%
Fig. 9: group most rEsponsiBlE For Ensuring suCCEssFul dEploymEnts - vEndor vs. BuyEr pErspECtivE
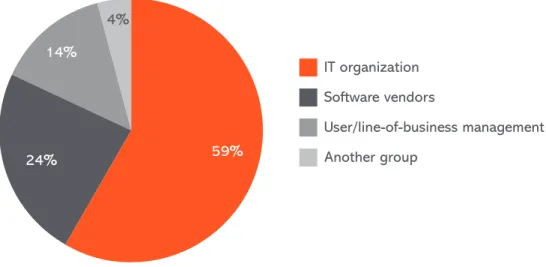
Regardless of who buyers and sellers think is responsible for software success, the CEO will have the final say about who’s to blame. When asked, 59 percent of respondents felt the IT department is the group the CEO would hold accountable for the success or failure of a software platform, while 24 percent said the CEO would look to blame the software vendor (see Figure 10). Interestingly, the CEOs are perceived to give users and business management less responsibility for failure than IT and software providers assign the group in the prior chart (see Figure 9).
Fig. 10: group hEld rEsponsiBlE By CEo For EntErprisE soFtwarE suCCEss/FailurE
Buyer expectations of their providers are constantly shifting. Today, only 11 percent of respondents say buyers are looking to software vendors for product expertise only. More than half of respondents say buyers want vendors to help with process alignment, and 39 percent want help with value enablement (see Figure 11).
“Enterprise software companies are too
internally/product focused.”
Buyer organization – user management Buyer organization – IT organization Software provider– professional services Software provider – customer support
Vendors Buyers 0 25% 50% 75% 100% 44% 28% 22% 7% 38% 39% 12% 11% IT organization Software vendors User/line-of-business management Another group 59% 24% 14% 4%
Fig. 11: BuyEr ExpECtation oF soFtwarE providEr
“Understanding the users’ business and
day-to-day activities will help deliver more business to
the provider and build trust with the buyer. This
partnership will increase the chances of a successful
implementation - a win-win situation for all.”
Directionally speaking, buyers and sellers have similar perspectives with regard to expectations (see Figure 12). Vendors are slightly more likely to think buyers want help with business value enablement and buyers are slightly more likely to look to vendors for product expertise, but overall, expectations are similar.
Fig. 12: BuyEr ExpECtation oF soFtwarE providEr – BuyEr vs. vEndor pErspECtivE
“The model of delivering enterprise software on
a CD is completely broken... Companies want solutions
to hard problems but they are stuck trying to get IT
to understand their business needs - let alone
deliver the right solution.”
Software/process
alignment Value enablement expertise onlyProduct 11% 0 25% 50% 51% 39% BUYERS VENDORS Software/process alignment Value enablement Product expertise only 0 25% 50% 49% 53% 35% 42% 12% 9%
IMPLICATIONS: The findings around responsibility point to a shift in the type of relationship buyers are looking to have with their vendors. Where some IT organizations have had bad experiences with software vendors, they are realizing that at the end of the day, the IT group is held responsible internally for the success and/or failure of software projects and any credible support is a blessing. As such, the majority of IT leaders are looking for more than just product expertise from their vendors.
It is important for software providers to recognize that they need to take an active role in enabling the IT organization to be successful in the eyes of their executive management team, because in reality, IT is still the dominant “internal VAR” for most enterprise software products.
6. The Drivers of Success for Existing Software Investments
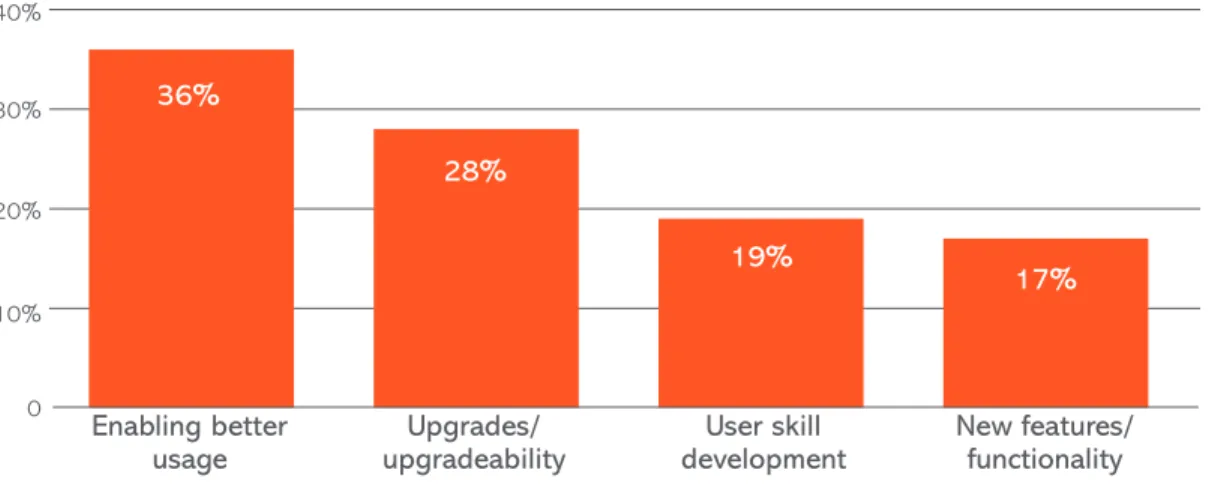
For existing deployments, both buyers and sellers want the software solutions to be successful. A total of 36 percent of respondents say enabling better usage of the software will be the most important driver of post-deployment success (see Figure 13).
“Upgradability” is another important aspect of post-deployment success, cited by 28 percent of respondents. Indeed, the challenging economy is pushing enterprises to rely on upgrades rather than new versions of software, so upgradability is increasingly important to many buyers. New features and functionality was only cited as the most important factor by 17 percent of respondents.
“Most deployments have far more capability
than is currently being used. Low levels of
competence in the user and IT communities leave
capability on the table. The vendors are not incented
to understand the user business and provide insight.
Similarly, vendors do little to communicate what
‘best practice’ use actually looks like. Once the sale is
made they are typically on to the next deal, leaving
the users to get ad hoc ‘break/fix’ help.”
Fig. 13: most important FaCtor For Existing soFtwarE dEploymEnts
“Software developers promise much more functionality
than can be delivered in practice.”
As companies push for broad adoption and effective usage of applications as a way to improve the software’s business impact, it is useful to look at the current, typical levels of effective usage in the enterprise.
While effective usage levels have improved somewhat from last year, there is still plenty of business upside being left on the table. A total of 47 percent of respondents say their
Enabling better
usage upgradeabilityUpgrades/ developmentUser skill New features/functionality 36% 28% 19% 17% 0 10% 20% 30% 40%
organization is achieving at least half of their potential software-driven business value through effective usage (see Figure 14). That means more than half of organizations are realizing 50 percent-or less of the planned business benefits of the software solution – the goals that were used to justify the software investment in the first place.
Fig. 14: typiCal lEvEl oF EFFECtivE usagE in BuyEr organizations – trEnd
“The cost of software and support is ridiculously out of
proportion to the value of services provided. Software
providers expect the user to pay for development
and debugging costs on their software by supplying
unfinished software to the market and expecting users
to pay extravagantly for the ‘support’ provided.”
Given the importance of effective usage levels, respondents provided their perspective on the potential impact of taking effective software usage to the next level. Approximately two-thirds of respondents say improving usage will result in reduced costs, a competitive advantage and a better customer experience (see Figure 15).
Fig. 15: impaCt oF improvEd EFFECtivE usagE - trEnd
50% or more 15–49% Less than 15% 0 20% 50% 2009 2008 8% 13% 46% 45% 41% 47% Reduced costs Competitive advantage Improved customer experience Revenue growth Other 0 20% 40% 60% 80% 22% 2009 2008 16% 68% 65% 77% 68% 47% 65% 65% 53%
“Effective usage and integration into business processes
is key to delivering measurable results in revenue
or cost improvement. Leadership mandates and
frontline adoption/ease of use both play a role
in ensuring success.”
Despite tight IT budgets, software buyers are interested in getting expert help to improve usage levels. A total of 87 percent of respondents are interested in paying for extra services to grow usage levels, with nearly one-fifth calling such services a “must have” for success (see Figure 16).
Fig. 16: BuyEr intErEst in paying For additional sErviCEs to improvE EFFECtivE usagE
IMPLICATIONS: As usage remains the greatest driver of post-deployment success, companies are presented with a lucrative opportunity to improve the impact of their enterprise applications. The reward for improving effective usage will be reduced costs and an improved competitive advantage- both valuable economic propositions as companies move forward and upward to economic recovery. Vendors can also enhance their relationships with IT leadership by bringing to bear services that reduce complexity and help IT navigate the business complexities with their own customers: End-users and their management. Somewhat interested - it depends on the scope/complexity Very interested - a “must-have” for success Not interested - we can manage our own effective usage 68%
13%
For more information about this study, please contact:
Chris Dowse
Founder & Chief Adoption Architect
M.R. Rangaswami
Publisher of SandHill.com
J.B. Wood
President and CEO of the TSIA
Leaders in Effective IT Adoption www.neochange.com
Business Strategy for Software Executives www.sandhill.com
The Technology Services Industry’s Largest and Most Vibrant Association www.tsia.com
Copyright 2009 Neochange, SandHill.com and the TSIA
The information contained herein has been obtained from sources believed to be reliable. Neochange, SandHill.com and the TSIA disclaim all warranties as to the accuracy, completeness or adequacy of such information. Neochange, SandHill.com and the TSIA shall have no liability for errors, omissions or inadequacies in the information contained herein or for interpretations thereof. The reader assumes sole responsibility for the selection of these materials to achieve its intended results. The opinions expressed herein are subject to change without notice.