University of Vermont
University of Vermont
ScholarWorks @ UVM
ScholarWorks @ UVM
Rubenstein School of Environment and Natural
Resources Faculty Publications
Rubenstein School of Environment and Natural
Resources
1-1-2014
Environmental footprints show China and Europe's evolving
Environmental footprints show China and Europe's evolving
resource appropriation for soybean production in Mato Grosso,
resource appropriation for soybean production in Mato Grosso,
Brazil
Brazil
Michael J. Lathuillière
The University of British Columbia
Mark S. Johnson
The University of British Columbia
Gillian L. Galford
University of Vermont
Eduardo G. Couto
Universidade Federal de Mato Grosso
Follow this and additional works at: https://scholarworks.uvm.edu/rsfac
Part of the Oil, Gas, and Energy Commons
Recommended Citation
Recommended Citation
Lathuillière, M. J., Johnson, M. S., Galford, G. L., & Couto, E. G. (2014). Environmental footprints show China and Europe’s evolving resource appropriation for soybean production in Mato Grosso, Brazil. Environmental Research Letters, 9(7), 074001.
This Article is brought to you for free and open access by the Rubenstein School of Environment and Natural Resources at ScholarWorks @ UVM. It has been accepted for inclusion in Rubenstein School of Environment and Natural Resources Faculty Publications by an authorized administrator of ScholarWorks @ UVM. For more information, please contact donna.omalley@uvm.edu.
Environmental Research Letters
PAPER • OPEN ACCESS
Environmental footprints show China and Europe’s
evolving resource appropriation for soybean
production in Mato Grosso, Brazil
To cite this article: Michael J Lathuillière et al 2014 Environ. Res. Lett. 9 074001
View the article online for updates and enhancements.
Related content
Environmental impacts of food trade via resource use and greenhouse gas emissions
Carole Dalin and Ignacio Rodríguez-Iturbe
-Water use by terrestrial ecosystems: temporal variability in rainforest and agricultural contributions to
evapotranspiration in Mato Grosso, Brazil
Michael J Lathuillière, Mark S Johnson and Simon D Donner
-Producer and consumer responsibility for greenhouse gas emissions from agriculturalproduction—a perspective from the Brazilian Amazon
D P M Zaks, C C Barford, N Ramankutty et al.
-Recent citations
Spatially-explicit footprints of agricultural commodities: Mapping carbon emissions embodied in Brazil's soy exports
Neus Escobar et al
-Water productivity and footprint of major Brazilian rainfed crops – A spatially explicit analysis of crop management scenarios
Rafaela Flach et al
-Rural-urban connectivity and agricultural land management across the Global South
Fanny Boudet et al
-Environmental footprints show China and
Europe
’
s evolving resource appropriation
for soybean production in Mato Grosso,
Brazil
Michael J Lathuillière
1,5, Mark S Johnson
1,2, Gillian L Galford
3and
Eduardo G Couto
41
Institute for Resources, Environment and Sustainability, University of British Columbia, 2202 Main Mall, Vancouver, BC, V6T 1Z4, Canada
2
Department of Earth, Ocean and Atmospheric Sciences, University of British Columbia, 2207 Main Mall, Vancouver, BC, V6T 1Z4, Canada
3
Gund Institute for Ecological Economics, University of Vermont, Burlington, VT 05405, USA
4
Departamento de Solos e Engenharia Rural, Universidade Federal de Mato Grosso, Av. Fernando Correa da Costa, numero 2367, 78060-900 Cuiaba, MT, Brazil
E-mail:mlathuilliere@alumni.ubc.ca
Received 1 November 2013, revised 22 May 2014 Accepted for publication 6 June 2014
Published 30 June 2014
Abstract
Mato Grosso has become the center of Brazil’s soybean industry, with production located across an agricultural frontier expanding into savanna and rainforest biomes. We present environmental
footprints of soybean production in Mato Grosso and resourceflows accompanying exports to
China and Europe for the 2000s usingfive indicators: deforestation, land footprint (LF), carbon footprint (CF), water footprint (WF), and nutrient footprints. Soybean production was associated with 65% of the state’s deforestation, and 14–17% of total Brazilian land use change carbon emissions. The decade showed two distinct production systems illustrated by resources used in thefirst and second half of the decade. Deforestation and carbon footprint declined 70% while land, water, and nutrient footprints increased almost 30% between the two periods. These differences coincided with a shift in Mato Grosso’s export destination. Between 2006 and 2010,
China surpassed Europe in soybean imports when production was associated with 97 m2
deforestation yr−1ton−1of soybean, a LF of 0.34 ha yr−1ton−1, a carbon footprint of 4.6 ton CO2 -eq yr−1ton−1, a WF of 1908 m3yr−1ton−1, and virtual phosphorous and potassium of
5.0 kg P yr−1ton−1and 0.0042 g K yr−1ton−1. Mato Grosso constructs soil fertility via
phosphorous and potassium fertilizer sourced from third party countries and imported into the region. Through the soybean produced, Mato Grosso then exports both water derived from its abundant, seasonal precipitation and nutrients obtained from fertilizer. In 2010, virtual water
flows were 10.3 km3yr−1to China and 4.1 km3yr−1to Europe. The total embedded nutrient
flows to China were 2.12 Mtons yr−1and 2.85 Mtons yr−1to Europe. As soybean production
Environmental Research Letters Environ. Res. Lett.9(2014) 074001 (12pp) doi:10.1088/1748-9326/9/7/074001
5
Work carried out at the Faculdade de Agronomia e Medecina Vetenaria e Zootecnia, Universidade Federal de Mato Grosso, Av. Fernando Correa da Costa, numero 2367, 78060-900 Cuiaba, MT, Brazil
Content from this work may be used under the terms of the
Creative Commons Attribution 3.0 licence. Any further distribution of this work must maintain attribution to the author(s) and the title of the work, journal citation and DOI.
grows with global demand, the role of Mato Grosso’s resource use and production vulnerabilities highlight the challenges with meeting future international food security needs.
S Online supplementary data available fromstacks.iop.org/ERL/9/074001/mmedia
Keywords: soybean, land footprint, water footprint, carbon footprint, deforestation, nutrients, Mato Grosso
1. Introduction
Environmental footprints are indicators of resource use and emissions across boundaries of consumption and production. Recently, the ecological footprint, water footprint (WF) and carbon footprint (CF) were combined into a‘footprint family’ to collectively understand human appropriation of land, air,
and water (Steen-Olsen et al 2012, Galli et al 2011). The
ecological footprint, in global hectares (ha), expresses the human appropriated biocapacity related to a given level of
consumption (Wackernagel and Rees1996). The CF
quanti-fies the amount of greenhouse gas emissions (g CO2
equivalents) related to an activity or product (Hertwitch and
Peters2009), while the WF estimates water consumptive use
of a production or consumption activity (m3 per activity or product; Hoekstraet al 2011).
Global estimates have shown that aggregate human activity and demand for resources and services approach 1.5
planets (Borucke et al2013), with a global CF of 35 Gtons
CO2-eq in 2001 (Hertwich and Peters 2009), and a global
1996–2005 average WF of 9087 Gm3yr−1 (Hoekstra and
Mekonnen2012). Such estimates bring to light not only our
overconsumption of the planet’s renewable resources as
illustrated by the ecological footprint, but the potential
impacts on climate change (CF) and inefficiencies in water
resource use (WF). Alongside these footprints are related resourceflows that indicate the exchange of natural resource use and emissions across boundaries of production and
con-sumption. Suchflows have been employed to quantify water
and nutrients involved in the production of traded goods
(Hoekstra and Mekonnen 2012, Galloway et al 2007).
Resource flows do not represent the physically traded
resources, but rather provide relative metrics to evaluate resource use and pollution at the site of production and allow for the assessment of resource use efficiency of internationally traded products.
When applied to agricultural products, environmental footprints estimate the natural resources utilized by both producing and consuming countries, thus bringing to light externalities related to diets (Foleyet al2011). Between 1975 and 1995, the Ecological Footprint for land use increased from 10.3 to 12.6 Gha due to increases in consumption (Van
Vuuren and Bouwman2005); in 2008 it reached 5.4 Gha for
cropland and grazing land alone (World Wildlife Fund 2012). In 2001, 20% of the world’s CF was attributed to food
pro-duction at close to 7 Gtons CO2-eq (Hertwich and
Peters 2009), while virtual water flows averaged
2320 Gm3yr−1 from the trade of agricultural and industrial
products for the 1996–2005 period (Hoekstra and
Mekon-nen2012). Resulting externalities have been studied using a
life cycle approach (UNEP/SETAC Life Cycle Initia-tive 2005) to permit consideration of the natural resources
used for agricultural products from ‘field to fork’ (Zaks
et al 2009). Studies include the Ecological Footprint assess-ment of agricultural production in the Canadian Prairies (Kissinger and Rees2009), the estimate of carbon emissions of tropical deforestation for soybean and pasture expansions (Karstensenet al2013, Zakset al2009), and the WF of meat products (Hoekstra2012, Gallowayet al2007). Other studies have also included nutrient flows in accounting for soil fer-tility and pollution from fertilizer application (Schipanski and Bennett2012, Galloway et al2007).
Brazilian soybean production is particularly of interest given the country’s increasingly important role in the inter-national trade of agricultural products in recent decades. Global soybean production rose from 143 to 227 Mtons between 2000 and 2010 among major producers (Argentina,
Brazil, China and the US; FAOSTAT2013). By 2010, Brazil
had become the second largest producer of soybean in the
world with 68.5 Mtons produced (FAOSTAT 2013), and is
anticipated to be the world’s leading soybean producer in
2014 (USDA-FAS 2014). Between 2000 and 2010, Brazil’s
soybean exports increased by 125%, with the share exported to China increasing from 16% in 2000 to 66% of total exports in 2010, and the share going to Europe dropping from 64% to
20% (FAOSTAT2013, Aliceweb2013) (figure1).
Land use change in Brazil is strongly related to the expansion of soybean and pasture in the Cerrado and Amazon
regions (Barona et al 2010). Deforestation and land-use
intensifications make the Brazilian Amazon one of the largest sources of greenhouse gas emissions related to land cover and
land use change (Galford et al 2013). The subsequent
pro-duction and transport of export crops has made Brazil an important center for greenhouse gas emissions for exported goods (177.0 Gt CO2-eq; Hertwich and Peters2009), but also
for flows of virtual water (112 Gm3yr−1; Hoekstra and
Mekonnen 2012). In addition, Brazil is also an important
exporter of nutrients for livestock feed used in live animal production systems when considering nitrogen (total of
2.1 Mtons of embedded N exported over 2000–02; Galloway
et al 2007) and phosphorous consumed for crops, feed and livestock production (0.8 Mtons of P in 2007; Schipanski and Bennett2012).
From 1990 to 2010, the contribution of Mato Grosso
(figure 2) to Brazilian production increased from
3.1 Mtons yr−1(15% of Brazilian soybean) to 18.8 Mtons yr−1
(27% of Brazilian production) IBGE 2013a). While the
pro-portion of Mato Grosso soybeans shipped to Europe ranged from 11% to 29% of Brazilian soybean exports between 1997
substantially from 0% to 31% (for 2009, 29% in 2010)
(figure 1). Increased soybean production occurred through
both agricultural extensification (conversion of natural
environment into agricultural land), and intensification
(increased production on existing agricultural lands) (Galford et al2010). Agriculture has been expanding in Mato Grosso through conversion of rainforest and Cerrado/Cerradao savanna ecosystems since the 1990s (Baronaet al2010), with several changes in policies and increased dependencies on
international markets also influencing land use change
(Macedoet al2012, Richardset al2012). Local resource use for cropland expansion creates environmental externalities such as losses in biodiversity, ecosystem services or eutro-phication, whose costs are often internalized by producers, thus causing a distortion in the real price of commodities (Galloway et al 2007). It is therefore important to quantify resource use and emissions across the supply chain to manage potential environmental impacts from supply and demand perspectives.
This study presents environmental footprints associated with the production of soybean in Mato Grosso, namely land, carbon, water and nutrients, and describes resourceflows to China and Europe between 2000 and 2010 related to exports
of the whole beans. Macedo et al (2012) reported a sharp
reduction in deforestation in 2005–10, despite a continuous increase in soybean production, suggesting a possible change
in the production system between thefirst and second half of the 2000s. This change also coincided with China’s rise as a major soybean importer for the region, surpassing Europe. We therefore use environmental footprints and associated
resource flows from soybean exports to further understand
relationships between the producer and consumers in a decade of apparent change in soybean production system. Natural
resources used in Mato Grosso’s soybean production have
previously been studied with respect to land use change
(Macedo et al2012) and associated carbon emissions
(Gal-ford et al 2010, 2011), carbon emissions allocation into
soybean production and consumption (Karstensenet al2013,
Zakset al2009), as well as water consumptive use from rain-fed agriculture (Lathuilliere et al2012). To our knowledge, no research has yet integrated these footprints of production over a common time period for the purpose of understanding resource use related to soybean exports. This work provides context for Mato Grosso’s role in the global food system in which importing nations are increasingly concerned with quantifying externalities related to agriculture (Ruvario et al2011), particularly Europe (Steen-Olsenet al 2012).
2. Materials and methods
This study presentsfindings of resource use and emissions to land, air, water, and nutrient flows related to the production and export of soybean (Glycine max) in Mato Grosso for the
2000–10 decade translated into environmental footprints.
Mato Grosso is located in Brazil’s Central Western region and is home to three major biomes (figure2): Amazon rainforest in the north, with a transitional Cerrado/Cerradao (savanna) extending to the Pantanal wetland in the south. We focus exclusively on soybean production and export in this study and do not consider the production of soybean oil and soy meal, which occur in Brazil as well as China and Europe, and would require additional resources (e.g. water, energy). These additional resources for products further down the supply chain would have to be considered in the country of production in order to derive a soy meal or soybean oil pro-duct environmental footprint. Also, indirect resources or emissions accounted in labor or off farm in the production of equipment and buildings are not included here. The agricultural production step ahead of such processing is considered the most resource intense stage of the entire life cycle of both products in Brazil (Milazzo et al 2013). Esti-mates show that an average of 40% of Brazilian soybean was
exported as whole beans in 2000–10 (FAOSTAT 2013).
Soybean that wasn’t exported was processed into either oil for local consumption (18%) or soybean cake (>50%)
(FAO-STAT2013). We consider footprints and resourceflows from
exports to China and the European Union (hencefourth as Europe). LF, CF, WF and nutrient footprints are included, and described in more detail below. We also track deforested area as an additional indicator to be included with the land resources.
Virtual and embedded resources are differentiated as
follows: virtual flows describe resources used which do not
Figure 1.Brazilian exports of soybean to China, Europe and other countries (other) (top panel) with Mato Grosso’s soybean exports between 1997 and 2010 (bottom panel) (Aliceweb2013, FAO-STAT2013, IBGE2013a).
3
comprise a physical part of the product, but were used or consumed as a component of soybean production (e.g. land
use conversion, water consumptive use, CO2 equivalents
emitted during deforestation); embedded flows refer to
resources which are an integral part of the product. This distinction is apparent in the case of nutrients (Galloway et al 2007) since elemental nitrogen (N), phosphorous (P)
and potassium (K) are applied to the field as fertilizer
(typically in an N-P2O5-K2O formulation) and are taken up as part of the soybean plant. Moreover, 80% of the N
assimilated by soybean is biologically fixed from
atmo-spheric N via rhizobium associated with soybean roots
(Smaling et al 2008). Thus embedded N refers to N
con-tained in harvested soybeans, while virtual N refers to N utilized in soy production that doesn’t become part of the harvested crop (e.g. N contents of crop residues, and N remaining in soil or leaching from soil). While water is
also an integral part of the soybean, the plants’ stored
water content is small compared to the plant’s consumptive
use (Galloway et al 2007). We interpret the difference
between virtual and embedded in terms of the production-consumption boundary where embedded resources physi-cally cross this boundary. Embedded nutrients require assimilation by individual regions importing the raw
material, while virtual resources represent Mato Grosso’s
consumption (for water) or load (fertilizer, CO2 emissions, land) burdened by the region but which we indirectly allocated to importers.
Methodologies from previous studies were used and
extended to include the 2000–10 decade (table 1) and
described in more detail below. Analyses requiring informa-tion from the Brazilian Institute of Geography and Statistics
(IBGE 2013a), such as data needed to calculate land, water
and nutrient footprints, were carried out at the municipal scale using political units delimited in Lathuilliere et al (2012) because municipalities in Mato Grosso changed in size and number through the 2000s. As such, municipalities were aggregated into 104 municipal units whose number and size were constant within the study time period (Lathuilliere
et al 2012). Resource flows were allocated as a percent of total resources used relative to the fraction of soybean exported to each country or region based on annual trade data
available from Aliceweb (2013). We assigned full
inter-nalization of the footprints to importing countries as in Kar-stensenet al(2013).
2.1. Deforestation and land footprint
Two components of land use were considered in the present study. First, deforested land area (ha) associated with soybean cultivation was assessed after Karstensen et al (2013) for 1990–2010. Karstensenet al(2013) related deforestation area to soybean production based on Landsat satellite imagery from the Brazilian National Institute of Space Research (INPE
2013), in conjunction with the land use transition model from Rammankutty et al (2007). Initial land use following forest conversion was assumed to be 65% cropland and 35% pasture
for Mato Grosso (Karstensen et al 2013). Second, we
con-sider the LF without a carbon uptake from the land term as in Steen-Olsenet al(2012), since carbon uptake is accounted for in the CF (discussed below). While Steen-Olsen et al(2012) focus on consumption, we focus on the production side of the soybean supply chain and therefore consider area planted in
soybean (IBGE2013a) as the gross LF.
2.2. Carbon footprint
Deforestation and management practices were taken into account as the two main sources of greenhouse gas emissions in soybean production. Greenhouse gas emissions related to
deforestation were obtained from Karstensen et al (2013).
Biomass clearing through deforestation was assumed to be
70% burnt and 20% slash (Karstensenet al 2013) following
agricultural practices and carbon stocks described by Galford et al (2010). The remaining biomass is typically separated into timber product (8%) and elemental C (2%) (Karstensen et al 2013). Carbon emissions are then allocated to soybean using a carbon cycle model when a biosphere-atmosphere
flux is registered (Karstensen et al 2013). Such accounting Figure 2.Map of Mato Grosso with its three main biomes: Amazon forest, Cerrado/Cerradao and the Pantanal wetland (Instituto Brasileiro de Geografia e Estatisticas (IBGE)2013b).
does not include indirect land use change described by Bar-ona et al (2010). Second, we consider emissions from machinery used in soybean production: sowing, fertilizer application, pesticide application and combine harvesting, noting that soybean is directly seeded into the stubble of the previous crop with no tillage employed in the study region.
We used the average emissions of 33.4 kg CO2-eq ton−
1 soybean estimated by Prudencio da Silvaet al(2010) for the Brazilian Central Western region using the Ecoinvent®
database (Ecoinvent 2013). We then determined the annual
emissions of machinery as a function of this emission rate and
production numbers from IBGE (2013a).
2.3. Water footprint
The total WF was calculated as the sum of green WF and gray WF. The green WF represents soil moisture regenerated by precipitation and utilized for plant growth, while the gray WF is the water volume required to assimilate a pollutant load to ambient water quality standards (Hoekstraet al2011). In this study, we do not consider the blue WF (e.g. the consumptive
water use supplied via irrigation), as Mato Grosso’s
soybean production is almost exclusively rain-fed at present (Lathuilliereet al2012).
Green water was calculated from actual evapotranspira-tion following equaevapotranspira-tion (1) (Allen et al1998),
= K
ETC CET ,0 (1)
where ETC(mm day−1) is the crop evapotranspiration,KC is
the crop coefficient for soybean which depends on the crop
development cycle, and ET0 (mm day−1) is the reference
evapotranspiration determined through meteorological
para-meters for the 2000 to 2010 period (INMET2013, see online
supplemental material equation S1 available atstacks.iop.org/ ERL/9/074001/mmedia). Daily ETC was calculated with variations in crop coefficient for the initial growing stage (KC= 0.56), mid-season (KC= 1.50) and harvest (KC= 0.50) for a total development cycle of 126 days (Lathuilliere et al 2012). Final ETC values were obtained from ten day averages of ET0(Allenet al1998) before being compared to effective precipitation to derive soybean green water: if effective precipitation was less than ETC, then green water was equal to precipitation; if effective precipitation was greater than ETC, then green water was equal to ETCas per Lathuilliereet al (2012). Finally, the sum of modeled green water for soybean harvests between 2000 and 2010 were related to harvested area and total soybean produced to derive an average green WF (m3ton−1yr−1) for the decade (see Table 1.Environmental footprints assessed in this study with associated methodology, assumptions, data sources, and references. Results from previous studies that did not cover the full 2000–2010 decade were extended.
Environmental
footprint Unit Method Assumptions Data sources References
Deforestation ha Remote sensing and land use change model based on Rammankutty et al(2007)
Initial share of Mato Grosso pasture to crop-land is 35% and 65%
Landsat satellite imagery from INPE (2013)
Karstensen et al(2013)
Land ha Mato Grosso’s soy-bean planted area
Expert surveys truly reflects agricultural production in non-cen-sus years
IBGE2013a This study
Method following Rammankutty et al(2007)
70% deforestation is burnt, 20% is slash
Deforested area (see above) and updated stocks from Zakset al (2009) and Galfordet al(2010) Karstensenet al (2013) Zaks et al(2009) Carbon g CO2 -eq Emissions estimate based on Jungbluth et al(2007) and Nemecek and Kagi (2007)
All machinery is used the same way in the state. Machines used accord-ing to Swiss agricultural practices Ecoinvent® database (Ecoinvent2013) Prudencio da Silva et al(2010)
Water m3 Crop modeling fol-lowing guidelines from Allen et al(1998)
Soybean planted on October 1st or Novem-ber 1st of each year. 10% leaching from N, 0.3% from P applica-tion for gray water calculation
Meteorological data (INMET
2013), fertilizer application information (see below)
Lathuilliereet al (2012) for green water and this study for gray water
Nutrients tons See equation (3) Application rates are identical every year throughout Mato Grosso. Two formula-tions used: 2-20-18 (60%), 0-20-20 (40%)
ANDA (2010) and information from 13 farms in Mato Grosso. Embedded NPK based on Cunhaet al(2010)
This study
5
supplemental material). A sensitivity analysis was carried out
according to planting assumptions defined below
(section2.5).
Gray WF was obtained following equation (2) (Hoekstra
et al2011), = − L c c gray WF , (2) max nat
where gray WF is calculated in m3yr−1as a volume, and also per ton of soybean for each harvest year (m3ton−1yr−1), L is the pollutant load (g ton−1yr−1), cmax is the ambient water quality standard (g m−3) andcnatis the natural concentration of the pollutant in the water body of interest (g m−3). L was determined as a fraction of N and P application rates according to Hoekstraet al(2011). Pollution sources affecting the gray WF were determined from N and P fertilizer appli-cation; other agricultural inputs such as pesticides were not considered. We used 10% as the fraction of applied N ferti-lizer and 0.3% of applied P fertiferti-lizer allocated to ground and surface water as non-point source contamination (Hoekstra et al2011, Riskinet al2013a). Fertilizer application rates are described in the following section.
Gray water was then estimated as the volume of water needed to dilute the larger pollution load (N or P) considering the range of fertilizer application rates (Section2.4). There-fore, the pollutant with the smallest volume is considered co-assimilated along with the contaminant with the largest pol-lutant load. The values ofcmax(10 mg NO3-N L−1and 0.1 mg
total P L−1) were selected from water quality standards
established under the Brazilian National Environmental
Council (CONAMA) which specifies limits for class 2 water
for human consumption, environmental conservation,
recreation, irrigation and aquaculture (SEMA 2010a,
2010b, 2010c). The value for cnatwas assumed to be zero, which is known to underestimate the gray WF (Hoekstra et al 2011) and is preferred in order to allow gray WF esti-mates to be conservative.
Virtual water flows from total green and gray water
consumed by soybean production then described the amount of local water resources appropriated for cultivation and assimilation of pollutant loads from fertilizer application. As described above, embedded water is small compared to virtual water (Gallowayet al2007) and therefore only virtualflows, representing indirect water use for the commodity, are dis-cussed in this study.
2.4. Nutrient footprints
Virtual NPK and embedded NPK were determined as per Schipanski and Bennett (2012) and Gallowayet al(2007) in equation (3):
= − ⩾
Fv Fa Fe with Fv 0, (3)
whereFvis the virtual fertilizer (N, P or K) remaining on the
field (kg),Fais the applied N, P or K fertilizer (kg) based on planted area and application rate (see below), and Fe is the embedded N, P or K (kg) based on production and elemental concentrations in Mato Grosso soybean (see below).
Embedded NPK represents the nutrients physically traveling with the soybean which requires full assimilation by impor-ters. Virtual NPK are the resources needed to grow the crop but that do not become embedded in the soybean. Just as in the virtual water case, the virtual NPK is related to local
resources or the amount of NPK remaining in Mato Grosso’s
soil after soybean harvest but allocated to importers indir-ectly. This differentiation prevents double counting of NPK remaining in the soil and the amount physically crossing the
production–consumption boundary through export. This
separation also allows for an interpretation of potential environmental impacts experienced by the producing region (via virtual NPK) and consuming regions (via embedded NPK). We constrain virtual nutrients to be greater than or equal to zero, assuming that the plant has assimilated all applied fertilizer not lost to pollution. Eighty percent of N assimilated by the soybean occurs through biological N
fixation (Smalinget al2008) in which case a negative virtual N would imply a spurious impoverishment of the soil N (a detailed N soil balance is available in Smaling et al2008). Similarly, lower K application rates (see below) could result in negative virtual K values. All fertilizer applied to soybean
fields was assumed to be industrially derived as per Smaling et al (2008). Values obtained for P2O5and K2O application rates were divided by 2.3 and 1.2, respectively to determine elemental P and K application rates.
Total applied NPK was determined by top-down and bottom-up approaches following similar steps by Riskinet al (2013b). The top-down estimate focused on information from
ANDA (2010) that reports combined fertilizer sales
aggre-gated for all crops. Mato Grosso’s share of total fertilizer consumption in Brazil’s Central Western Region (as the states of Mato Grosso, Mato Grosso do Sul, Goias, and Federal
District) was constant over 2000–10 at 56% (±1.5%)
(ANDA 2010). We assumed that fertilizer sold to Mato
Grosso had the same elemental NPK composition as that sold in the Central Western region for all years, except 2008 and 2010 for which Mato Grosso fertilizer sales were specifically
reported by ANDA (2010). We then assumed a constant ratio
of fertilizer used for soybean to total NPK consumed for 2010
(ANDA 2010), considering that 60% of fertilizer used for
soybean was of the 2-20-18 formulation (N-P2O5-K2O), and
40% was the 0-20-20 formulation (ANDA 2010). In the
bottom-up estimate, average NPK application rates were obtained for the 2000–10 decade following Brazilian fertilizer
consumption data (Cunha et al 2010, Heffer 2009,
Fertistat2007, FAO2004) and information obtained from 13 farms combined with agricultural production information IBGE 2013a). These two approaches, when combined to
planted soybean area from IBGE (2013a) gave a range of
applications rates of 0–5 kg N ha−1, 28–34 kg P ha−1 and 39–62 kg K ha−1. These ranges of fertilizer application rates were used in our analyses for all municipalities of Mato Grosso and were assumed to be constant within the study period.
Embedded NPK data (i.e. elemental concentrations in
soybean) were obtained from Cunha et al (2010), where
5.5 g P kg−1and 18.8 g K kg−1 of soybean leaving the field. The elemental concentrations were assumed to be constant within the decade for all soybean cultivated in Mato Grosso.
2.5. Sensitivity analysis
We performed a sensitivity analysis to provide uncertainty estimates for results when reporting environmental footprints
and resource flows with the exception of LF obtained from
IBGE (2013a). For the deforestation CF, we consider legacy
emissions as described in Karstensen et al (2013). Most
greenhouse gases emitted from deforestation would have occurred from biomass burning following forest clearing, with releases occurring in the year of deforestation. Legacy emissions include the biomass decay from slash, which is allocated to subsequent years following land clearing
(Kar-stensen et al 2013). We used two planting dates for our
annual green WF estimate (October 1st and November 1st) to account for differences in agricultural practices as per Lathuilliereet al(2012). We also included both extremes of the range of application rates derived from the top-down and bottom-up estimates to assess the differences in gray WF and
virtual nutrient flows to China and Europe. Discussion of
assumptions and comparisons to literature values can be found in the supplemental material.
3. Results and discussion
3.1. Deforestation and carbon emissions allocated to soybean production
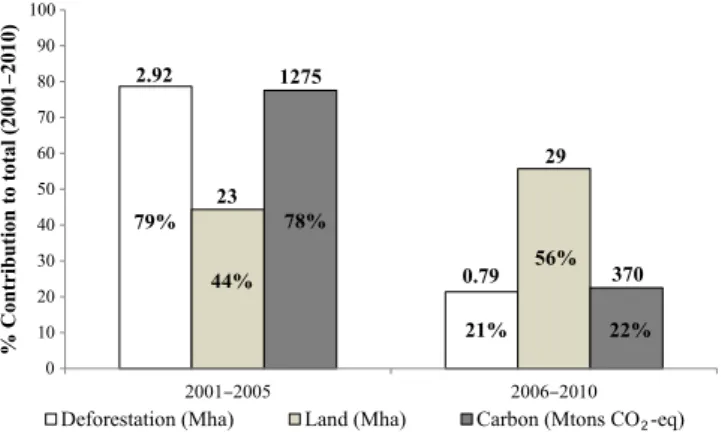
Deforestation and carbon emissions related to soybean
pro-duction decreased more than 70% between the 2001–05 and
2006–10 periods (figure 3, table 2), representing soybean production systems linked to agricultural extensification and
intensification, respectively. Areas of new deforestation
allocated to soybean occurring within the 2001–05 period
totaled 2.92 Mha, but only 0.79 Mha in 2006–10. Carbon
emissions from land use conversion declined from
1277 Mtons CO2-eq to 373 Mtons CO2-eq between time
periods, and fell 80–90% between the years 2000 and 2010.
Machinery emissions increased with the planted area between 2000 and 2010 (2.9 Mha yr−1to 6.2 Mha yr−1) but remained <1% of total carbon emissions in the decade. The 2000–10 decade was marked by deforestation policy initiatives and enforcement, as well as a‘soybean moratorium’in 2006 that excluded producers who clear rainforest for soybean
pro-duction from the supply chain (Brandoet al 2013, Macedo
et al2012). Currency exchange in early 2000s also favoured soybean expansion with a subsequent devaluation of the
Brazilian Real slowing down deforestation (Richards
et al2012). Despite these factors, deforestation as quantified
by INPE (2013) that is attributable to soybean production
(0.41 Mha in 2000, 0.057 Mha in 2010) continued to repre-sent 65% of total Mato Grosso deforestation at the end of the decade.
Deforestation associated with soybean cultivation
showed impacts on climate change as illustrated by the CF, but also suggest potential impacts on biodiversity and eco-system services. Brazil’s total carbon emissions from land use/land cover change were roughly equal in 2000 and 2005 at 1250 Mtons yr−1(IBGE2012) meaning that Mato Grosso’s deforestation for soybean production contributed about 14% and 17% of total Brazilian land use change emissions in 2000 and 2005, respectively. Carbon emissions from land use change remain the largest contributor to Brazil’s total
emis-sions (IBGE 2012). In 2005, the number of extinct or
endangered fauna and flora species reached 150 in the
Amazon rainforest, >225 in the Cerrado, and >50 in the
Pantanal wetland (IBGE2012).
Ecosystem services related to climate and water cycling may also be impacted as a result of a loss of forest cover in
the region (Lathuilliere et al 2012, Nepstad et al 2008),
which may in turn impact the productivity of soybean agriculture. Simulations show that climate feedbacks from expanding agriculture further into the Amazon may reduce
soybean productivity by 16–26% in 2041–50 (Oliveira
et al 2013) such that the benefits of agricultural production are far outweighed by the costs to biodiversity and eco-system services. While there are noted differences in
deforestation and carbon footprint between 2001–05 and
2006–10, the above mentioned impacts on biodiversity and
ecosystem services which would have been greater from
soybean production based on extensification (2001–05)
would likely carry over into the second half of the decade and into the future.
3.2. Resource use for Mato Grosso’s soybean production 3.2.1. Water and nutrient resource use and potential sources of contamination. Water and nutrient resource use related to soybean production increased almost 30% between the
2001–05 and 2006–10 periods (table 2) along with
Figure 3.Contributions of deforestation, land and carbon emissions allocated to Mato Grosso’s soybean production for the 2001–2005 and 2006–2010 periods expressed as a percent of total 2001–2010 results. Values above the histograms represent the 2001–2005 and 2006–2010 sums of deforestation (Mha), land (Mha) and carbon emissions (Mtons CO2-eq) allocated to soybean in the respective
periods.
7
intensification of the soybean production system. Water use, as total of green and gray water, increased 28% from 127 km3
for 2001–05 compared with 162 km3 for 2006–10. Total
water resources consumed were dominated by green water (106 km3 for 2001–05 versus 135 km3 for 2006–10), while gray water represented approximately 17% of total water
consumptive use (averaging 21.2 km3 to 26.7 km3 for
2001–05 and 2006–10, respectively). Virtual P increased
24%, from 0.34 Mtons to 0.42 Mtons and virtual K by 16%, from 0.081 Mtons to 0.094 Mtons between the early and later
five-year periods. In 2001–05 and 2006–10, embedded N
increased from 3.9 Mtons to 5.0 Mtons with no associated virtual N. Virtual P (0.34 Mtons to 0.42 Mtons per 5 year period) was similar to embedded P (0.36 Mtons to 0.47 tons per 5 year period) while embedded K (1.25 Mtons to 1.60 Mtons per 5 year period) was over ten times larger than virtual K (0.081 Mtons to 0.094 Mtons per 5 year period).
The increasing virtual P illustrates the increasing amount of nutrients remaining in the state of Mato Grosso with possible impacts to water bodies. Loss of applied P is known to cause eutrophication of water bodies over time in areas where P is not strongly bound to the soil. Local soil conditions in the study area, however, have a very high P
fixing capacity thus largely preventing it from reaching
aquatic environments (Riskinet al2013a,2013b, Schipanski
and Bennett 2012). Monthly water quality campaigns were
performed in 2007–09 in the Amazon River, Paraguay River
and Tocantins-Araguaia River basins (74 sites in total)
(SEMA 2010b). Total P measurements exceeded the
CON-AMA limit of 0.1 mg total P L−1on 40 out of 705 occasions, averaging 0.30 mg P L−1(n= 40; sd = 0.25). Finally, there is evidence of ongoing accumulation of P in soils (Riskin et al2013b, Schipanski and Bennett2012), which eventually could lead to saturation of P in the long term with consequential eutrophication, although results to date have not shown increases in P loading from on farm experiments (Brandoet al2013).
3.2.2. Non-renewable fertilizer inputs. In addition to concerns over contamination of water bodies, the argument that agricultural trade results in exports of soil fertility has been
made (Galloway et al 2007). However, this claim may not
apply to Mato Grosso’s Cerrado soils since its fertility is mostly derived from fertilizer inputs. Placing soybean production within the context of the fertilizer supply chain therefore provides additional insight into resource use for soybean exports, especially since Brazil is the fourth largest buyer of fertilizer in the world, with 10.1 Mtons of NPK
fertilizer purchased in 2010 (ANDA 2010). Devaluation of
the Brazilian Real through the early 2000s led to an increase in the costs of production, especially fertilizer, which
increased in price from US$ 55.3 ha−1 in 2000–01 to US$
180 ha−1 in 2009–10 (adjusted for inflation) for typical
macronutrients (Agroserra 2001, IMEA 2010). Brazil’s
demand for fertilizer raw materials between 2000 and 2010 increased 6.6% per year, with 60–80% of materials imported for domestic fertilizer production (Amaral and Peduto2010). In 2008, Brazil imported 4% of the world’s N fertilizer, 7% of
P and 14% of K (Amaral and Peduto 2010). For 2005–10, P
fertilizer was mainly sourced from Israel (35%), Tunisia
(19%), the E.U. (17%) Morocco (10%), and other
international partners (19%) (UN Comtrade 2012). K
fertilizer during this period was mainly sourced from Canada (27%), Belarus (22%), the E.U. (20%), Russian Federation (15%), Israel (12%), and other countries (4%) (UN
Comtrade 2012). Brazil’s dependence on K imports is
particularly critical, with only 8% of K fertilizer use
supplied by national production (IBGE 2012).
Mato Grosso fertilizer use ranks among the highest in Brazil for P and K fertilizer sales. In 2010, fertilizer sales in Mato Grosso were equivalent to application rates of
58.9–82.3 kg P ha−1 of cultivated area, and
72.9–94.3 kg K ha−1 (IBGE 2012). High P application rates and high K use efficiency (defined as the ratio of embedded to applied K fertilizer, see Section 3.3.2. below) suggest that
Mato Grosso’s soybean production works as a node for
nutrient transfer from soil to soybean. Most applied K is Table 2.Total resources used for the production of soybean in Mato Grosso for the 2001–2005 and 2006–2010 periods with amounts exported to China and Europe: deforestation, land, carbon (nonleg—without legacy emissions; leg—including legacy emissions), water (average of planting assumptions and fertilizer application); average virtual phosphorous (Pv), potassium (Kv); embedded nitrogen (Ne),
phosphorous (Pe) and potassium (Ke).
Deforestation (Mha)
Land (Mha)
C emissions (Mton CO2-eq) nonleg—leg
Water (km3) Pv (Mtons) Kv (Mtons) Ne (Mtons) Pe (Mtons) Ke (Mtons) Total production 2001–05 2.92 22.8 1269–1285 127 0.34 0.081 3.940 0.366 1.25 2006–10 0.79 28.6 370–376 162 0.42 0.094 5.020 0.467 1.60 Exportsato China 2001–05 0.212 1.8b 92.6–93.6 10.4 0.028 0.0067 0.321 0.0298 0.102 2006–10 0.163 6.6 77.4–78.7 37.7 0.096 0.019 1.17 0.109 0.372 Exports to Europe 2001–05 0.702 5.4 305–309 30.2 0.080 0.018 0.937 0.0871 0.298 2006–10 0.195 6.2 90.9–92.4 35.0 0.091 0.019 1.086 0.101 0.345 a
Exports to China and Europe are for soybean as whole bean only, not soybean meal or oil.
exported out of Mato Grosso through the commodity trade since embedded K was larger than virtual K. Within this context of international trade, soybean production in Mato Grosso and exports remain strongly tied to non-renewable resource extraction in other countries, noting that global reserves of phosphate rock for P and potash for K are believed to be declining due to long regeneration time scale (Obersteineret al 2013, Schipanski and Bennett2012). This strong dependency also creates an important node for spikes in regional soybean price and costs of production due to fertilizer pricefluctuations that strongly depend on oil supply and local fertilizer production capabilities (Amaral and Peduto2010).
3.3. Mato Grosso soybean exports to China and Europe 3.3.1. China and Europe’s land use appropriation through soybean imports. Of the major producers of soybean, Argentina and Brazil are the only countries that have
expanded production in recent years, with Brazil’s
agriculture representing 30.9% of Brazil’s land base in 2000
and 32.3% in 2010 (FAOSTAT 2013). Since much of
production is bound for the export market, the LF related to exported soybean is attributable to China and Europe as the importers seeking to meet their soybean raw material demands. The dynamic for increasing LF of soybean
production (0.34 ha ton−1 in the decade, table 3) has
changed between 2000 and 2010 (table 2) as the soybean
production system evolved from a system based on extensification (2001–05) versus intensification (2006–10). Deforestation allocated to soybean declined between the
2001–05 and 2006–10 periods as Chinese soybean imports
slowly surpassed European imports (figure 1). The area
of forest impacted by soybean exports decreased from 0.212 Mha to 0.163 Mha per period for China, and from 0.720 Mha to 0.195 Mha per period for Europe due to declining deforestation post-2004. Reduced deforestation resulted in a 10% decrease in carbon emissions for China
(93.1 Mtons to 78.1 Mtons CO2-eq per 5 year period) and
70% decrease for Europe (307 Mtons to 91.7 Mtons CO2-eq
per 5 year period). Virtual resourceflows related to soybean exports increased for China and remained roughly steady for Europe, as did the quantities of soybean imported by Europe
(figure 1, bottom panel). By 2010, China had surpassed
Europe in resource appropriation with twice the amount of
resourcesflowing from Mato Grosso to China as compared to
Europe. Embedded nutrients increased over time with increases in imports by China and steady values for Europe.
China’s increase in soybean imports from Mato Grosso
post-2005 coincided with a sharp drop in deforestation and CF (table3) as soybean production intensified. Deforestation per ton of soybean harvested was 455 m2ton−1for 2001–05
and 97 m2ton−1 for 2006–10. At the same time, the CF
decreased from 19.9 tons CO2-eq ton−1(on average resulting from biomass burning and subsequent emissions from decaying slash) to 4.6 tons CO2-eq ton−1between the two 5 year periods. In other words, Chinese soybean importers indirectly had smaller externalities on global climate change, Mato Grosso biodiversity and ecosystem services compared to European importers earlier in the decade when the soybean production system was more focused on agricultural exten-sification. The rise in China’s imports of soybeans coincided with more effective deforestation policies and enforcement, yet China’s virtual resources imports, on the basis of planted area in Mato Grosso and exported volumes, remained larger than Europe’s in 2010.
3.3.2. Efficiency in resource use through soybean trade. The average green WF during the study period was 1590 m3ton−1,
which is lower than the world soybean average
(2037 m3ton−1) and soybean produced in China
(2428 m3ton−1), but within the range of some European
countries (Italy: 1177 m3ton−1; Germany: 1948 m3ton−1)
(Mekonnen and Hoekstra 2011). Nutrient exports embedded
in soybean exports were found to increase over the 2000–10
period with the largest NPK values in 2010 (table 2). We
assessed the phosphorous use efficiency for phosphate in
fertilizer (PUE) and potassium use efficiency (KUE), defined as the ratio of embedded nutrients to applied P and K fertilizer. Averages over the study period were 0.48–0.58 for
PUE and 0.90–1.43 for KUE based on fertilizer application
rates. Average soybean PUE values in this study were similar to values previously reported for Brazil in 2002 (0.57) (Schipanski and Bennett2012), but larger than the PUE for a
farm in Northern Mato Grosso (0.39) (Riskin et al 2013a).
The average KUE >1 suggests that essentially all of the applied K is taken up by the plant and exported. Additional K
sources not quantified here may come from decomposing
crop biomass left on the field during no-till agricultural
practices (Bertolet al2007).
There is little or no averted water contamination through soybean trade due to the high P fixing capacity of soils, as
discussed by Schipanski and Bennett (2012). However,
Table 3.Average environmental footprint per ton of soybean produced in Mato Grosso for the 2001–2005 and 2006–10 periods: deforestation, land, carbon (as average of legacy and non-legacy emissions), water (average of planting assumptions and fertilizer application range), virtual phosphorous (Pv) and potassium (Kv) (considering fertilizer application range). Standard deviations are shown in brackets.
Periods Deforestation (m2yr−1ton−1) Land (ha yr−1ton−1) C emissions (ton CO2-eq yr−1ton−1) Water
(m3yr−1ton−1) Pv(kg yr−1ton−1) Kv(g yr−1ton−1)
2001–2005 455 (115) 0.34 (0.02) 19.9 (4.8)
1908 (15) 4.0 (0.45)–6.0 (0.55) 0.0042 (0.12)–1.1 (0.49) 2006–2010 97 (63) 0.34 (0.02) 4.6 (2.8)
9
embedded nutrient exports may represent a management issue for countries importing soybean or derived products. Soybean produced in Mato Grosso is exported as whole bean or meal (not considered in detail in our study) with implications for waste management and contamination issues from human consumption or animal production in China and Europe. The
argument of resource use efficiency through international
trade has been made in the case of water resources and nutrients. For instance, China’s virtual water imports via soybean from Mato Grosso illustrate water resource use efficiency through international trade, also depicted in the
Global Virtual Water Trade Network where 101 km3yr−1of
virtual water was traded between South America and Asia,
and 77 km3yr−1 to Europe in 2007 (Dalin et al 2012).
Similarly, Schipanski and Bennett 2012 note that low crop
PUE countries can import crops from countries with greater PUE. The policy of virtual water imports however remains
contested (Liu and Savenije 2008). Domestic soybean
production in China was relatively constant within the study period at 15.4 Mtons of soybean in 2000 and 15.1 Mtons in
2010 (FAOSTAT2013). China and Europe remain the largest
importers of soybean (FAOSTAT 2013), much of which is
used for the production of animal feed within importing countries (Nepstadet al2008). The use of water and nutrients abroad for Chinese soybean production remains an important question in the country’s agricultural policy as depicted in the
supply side of soybean production in the context of Mato Grosso’s land use dynamics described here.
Rather than exporting native soil fertility, Mato Grosso is virtually exporting its water resources, photosynthetic capacity and the N fixing capabilities of soybean to China and Europe through the product. As soybean production in Mato Grosso is currently rain-fed (e.g. production relies almost exclusively on soil moisture derived directly from local precipitation without supplemental irrigation), the interannual variation in rainfall can affect yields. We calculated the average green WF for soybean as 1450 m3ton−1for a planting date of November 1st, versus 1750 m3ton−1for soybean with a planting date October 1st. This difference in green WF reflects the possible water stress that the plant may undergo which could greatly impact yields, especially during the development andflowering stages. Macedoet al(2012) identified that 22% of increased soybean production in the state was due to yield increases related to land and water management practices. Moreover, simulations on climate feedbacks of deforestation show a potential connection with precipitation such that soybean yield may become affected (Oliveiraet al2013).
4. Conclusions
This study presented a synthesis of environmental footprints for the production of soybean in Mato Grosso, Brazil, an Figure 4.Resource use summary for Mato Grosso soybean production using 2004 as a reference year, with differences in pressures post-2004 (+ increases;−declines) (FAOSTAT2013, ANDA2010). Ne, Pe, Ke are embedded nitrogen, phosphorous and potassium respectively; Pv,
important global food security node upstream of the animal protein supply chain (figure4). The estimate of resource use and relatedflows is a key step in assessing externalities which are often not included in commodity prices, but whose related impacts must be considered within the ‘planetary safe
oper-ating space’ (sensu Rockstrom et al 2009). Soybean
pro-duction represented 65% of deforestation in Mato Grosso during the 2000–10 study period, and 14–16% of total Bra-zilian land use related carbon emissions despite a close to 70% decline between the 2001–05 and 2006–10 periods. The decline in deforestation suggested a shift in soybean
pro-duction system from one based on extensification
(agri-cultural expansion into natural ecosystems) to one based on intensification (increase in yield on available land) with dif-ferences in resource use and allocation to trade partners with China replacing Europe as the main soybean importer.
Over the study decade, soybean production required ever larger amounts of water and fertilizer inputs related to increases in planted areas and average yields, both of which are key to ensuring adequate total crop production. On the one hand, current practices of soybean production in Mato Grosso depend on rainfall, a free resource whose magnitude and timing can affect yields. On the other hand, soybean production requires inputs that strongly depend on interna-tional suppliers to construct soil fertility in Mato Grosso before exporting nutrients abroad. Our estimated environ-mental footprints suggest potential regional impacts on cli-mate, biodiversity, ecosystem services, and a possible incremental soil P saturation that could increase the risk of eutrophication in the long term.
Supply side footprint assessment and resourceflows can
help reconcile policy actions that seem to have opposing goals, such as the inclusion of the environment in agricultural policy but its exclusion in trade policy (Wurtenbergeret al2006), or actions led by countries supporting deforestation reduction initiatives and their dampening effects from increased demand
of soybean and meat products (Karstensen et al 2013). Such
pressures will only increase with affluence, which has shown to contribute to further land displacement (Weinzettelet al2013) as illustrated here by China’s continuing growth in demand for Mato Grosso’s soybean. Options for future soybean production will have to consider the trade-offs between agricultural extensification and intensification illustrated by the combined footprint analysis and an associated impact assessment to address costs and benefits of future food production strategies.
Acknowledgements
We acknowledge the Brazilian Conselho Nacional de
Desenvolvimento Cientifico e Tecnologico (CNPq, Bolsa
DTI-2 382983/2012-2 to MJL) and the National Sciences and Engineering Research Council (NSERC, Discovery grant to MSJ) for theirfinancial support. Special thanks are owed to Jonas Karstensen and Shelby Riskin for input on data use and results. We also thank Jennifer Blesh, James Richardson, Mario Zortea, Eduardo Miranda, and the UBC LCA Alliance for their helpful suggestions and comments on the project.
References
Agroserra 2001Agrianual 2002: Anuario da Agricultura Brasileira (Sao Paulo: FNP Consultorio & Comércio)
Aliceweb 2013http://aliceweb2.mdic.gov.br/accessed June 2013 Allen R, Pereira L and Raes D S M 1998Crop Evapotranspiration:
Guidelines for Computing Crop Water Requirements(Rome: Food and Agriculture Organization of the United Nations) Amaral W A N D and Peduto A 2010Food Security: The Brazilian
Case Series on Trade and Food Security—Policy Report (Winnipeg: Trade Knowledge Network)www.iisd.org/tkn/pdf/ food_security_brazil.pdf
ANDA 2010Setor de Fertilizantes: Anuario Estatistico 2010(Sao Paulo: ANDA)
Barona E, Ramankutty N, Hyman G and Coomes O T 2010 The role of pasture and soybean in deforestation of the Brazilian AmazonEnviron. Res. Lett.5024002
Bertol I, Engel F L, Mafra A L, Bertol O J and Ritter S R 2007 Phosphorous, potassium and organic carbon concentrations in runoff water and sediments under different soil tillage systems during soybean growthSoil Tillage Res.94142–50
Borucke M, Moore D, Cranston G, Gracey K, Iha K, Larson J, Lazarus E, Morales J C, Wackernagel M and Galli A 2013 Accounting for demand and supply of the biosphere’s regenerative capacity: the national footprint accounts’ underlying methodology and methodEcol. Indic.24518–33
Brando P M, Coe M T, DeFries R and Azevedo A A 2013 Ecology, economy and management of an agroindustrial frontier landscape in the southeast AmazonPhil. Trans. R. Soc.B368
20120152
Cunha J F, Casarin V and Prochnow L I 2010 Balanço de nutrientes na agricultura brasileiraInformacoes agronomicas130 (Piracicaba, SP, Brasil: International Plant Nutrition Institute)
www.ipni.net/publication/ia-brasil.nsf/0/
CB94A790AA6AB82683257A90000C0822/$FILE/Page1-11-130.pdf
Dalin C, Konar M, Hanasaki N, Rinaldo A and Rodriguez-Iturbe I 2012 Evolution of the virtual water trade networkProc. Natl. Acad. Sci. USA1095989–94
Ecoinvent 2013http://ecoinvent.ch/
FAO 2004Fertilizer Use by Crop in Brazil(Rome: Food and Agriculture Organization of the United Nations)www.fao.org/ docrep/007/y5376e/y5376e00.htm
FAOSTAT 2013http://faostat.fao.orgJune 2013
Fertistat 2007 Fertilizer use statistics (Brazil)www.fao.org/ag/agp/ fertistat/index_en.htmaccessed 30 November 2011
Foley J A 2011 Solutions for a cultivated planetNature478337–42
Galford G L, Soares-Filho B and Cerri C E P 2013 Prospects for land-use sustainability on the agricultural frontier of the Brazilian AmazonPhil. Trans. R. Soc.B368
20120171
Galford G L, Melillo J, Mustard J F, Cerri C E P and Cerri C C 2011 Historical carbon emissions and uptake from the agricultural frontier of the Brazilian AmazonEcol. Appl.2
750–63
Galford G L, Melillo J, Mustard J F, Cerri C E P and Cerri C C 2010 The Amazon frontier of land-use change: croplands and consequences for greenhouse gas emissionsEarth Interact.14
1–24
Galli A, Wiedmann T, Ercin E, Knoblauch D, Ewing B and Giljum S 2011Integrating Ecological, Carbon and Water Footprint: Defining the‘Footprint Family' and its Application in Tracking Human Pressure on the Planet(Godalming, UK: Open Planet Economy Network)www.oneplaneteconomynetwork.org/ resources/programme-documents/
WP8_Integrating_Ecological_Carbon_Water_Footprint.pdf
Galloway J Net al2007 International trade in meat: the tip of the pork chopAmbio36622–9
11
Heffer P 2009Assessment of Fertilizer Use by Crop at the Global Level 2006/2007–2007/2008(Ames, IA: International Fertilizer Industry Association)http://ageconsearch.umn.edu/ bitstream/140952/2/12-WP_535.pdf
Hertwich E and Peters G P 2009 Carbon footprint of nations: a global trade linked analysisEnviron. Sci. Technol.436414–20
Hoekstra A Y, Chapagain A K, Aldaya M M and Mekonnen M 2011 The Water Footprint Assessment Manual: Setting the Global Standard(London: Earthscan)
Hoekstra A Y 2012 The hidden water resource use behind meat and dairyAnimal Frontiers23–8
Hoekstra A Y and Mekonnen M M 2012 The water footprint of humanityProc. Natl. Acad. Sci. USA1093232–7
IBGE 2012Indicadores de Desenvolvimento Sustentavel: Brasil 2012(Rio de Janeiro: IBGE)
IBGE 2013a Banco de dados agregadoshttp://sidra.ibge.gov.br/
June 2013
IBGE 2013bwww.ibge.gov.br
IMEA 2010 Custo de produção efetivo da soja—safra 09/10www. imea.com.br/upload/publicacoes/arquivos/
10_02_Custo_Efetivo_da_Soja_(2).pdf
INMET 2013 Banco de dados meteorologicos para ensino e pesquisa
www.inmet.gov.br/portal/index.php?r=bdmep/bdmep
INPE 2013 Projeto PRODES: Monitoramento dafloresta Amazonica brasileira por satelitewww.obt.inpe.br/prodes/index.php
Jungbluth Net al2007Life Cycle Inventories of Bioenergy Ecoinvent report No. 17 (Dubendorf, CH: Swiss Center for Life Cycle Inventories)
Karstensen J, Peters G P and Andrew R M 2013 Attribution of CO2
emissions from Brazilian deforestation to consumers between 1990 and 2010Environ. Res. Lett.8024005
Kissinger M and Rees W E 2009 Footprints on the prairies: degradation and sustainability of Canadian agricultural land in a globalizing worldEcol. Econ.682309–15
Lathuilliere M J, Johnson M S and Donner S 2012 Water use by terrestrial ecosystems: temporal variability in rainforest and agricultural contributions to evapotranspiration in Mato Grosso, BrazilEnviron. Res. Lett.7024024
Liu J and Savenije H H G 2008 Time to break the silence around virtual water importsNature453587
Macedo M N, DeFries R S, Morton D C, Stickler C M, Galford G L and Shimabukuro Y E 2012 Decoupling of deforestation and soybean production in the southern Amazon in the late 2000Proc. Natl. Acad. Sci. USA109
1341–6
Mekonnen M M and Hoekstra A Y 2011 The green, grey and blue water footprint of crops and derived crop productsHydrol. Earth Syst. Sci.151577–600
Milazzo M F, Spina F, Primerano P and Bart J C J 2013 Soy biodiesel pathways: global prospectsRenew. Sust. Energ. Rev. 26579–624
Nemecek T and Kagi T 2007Life Cycle Inventories of Swiss and European Agricultural Production Systems(Final Report Ecoinvent 2.0 No. 15a)(Zurich and Dübendorf, CH: Agroscope Reckenholz-Taenikon Research Station ART, Swiss Center for Life Cycle Inventories)
Nepstad D C, Stickler C M, Soares-Filho B and Merry F 2008 Interactions among Amazon land use, forests and climate: prospects for a near-term forest tipping pointPhil. Trans. R Soc. Lond. B Biol. Sci.3631737–46
Obersteiner M, Penuelas J, Ciais P, van der Velde M and Janssens I A 2013 The phosphorous trilemmaNat. Geosci.6
897–8
Oliveira L J C, Costa M H, Soares-Filho B S and Coe M T 2013 Large-scale expansion of agriculture in Amazonia may be a no-win scenarioEnviron. Res. Lett.8024021
Prudencio da Silva V P, Werf H M G, Spies A and Soares S R 2010 Variability in environmental impacts of Brazilian soybean
according to crop production and transport scenarios J. Environ. Manag.911831–9
Rammankutty N, Gibbs H K, Achard F, Defries R, Foley J A and Houghton R A 2007 Challenges to estimating carbon emissions from tropical deforestationGlob. Change Biol.13
51–66
Richards P D, Myers R J, Swinton S M and Walker R T 2012 Exchange rates, soybean supply response, and deforestation in South AmericaGlob. Environ. Change22454–62
Riskin S, Porder S, Neill C, Figueira A M S, Tubbesing C and Mahowald N 2013a The fate of phosphorous fertilizer in Amazon soya beanfieldsPhil. Trans. R. Soc.B36820120154
Riskin S, Porder S, Schipanski M, Benett E and Neill C 2013b Regional differences in phosphorous budgets in intensive soybean agricultureBioscience6349
Rockstrom Jet al2009 A safe operating space for humanityNature 461472–5
Ruvario C F, Gianezini M, Brandao F S, Winck C A and Dewes H 2011 Life cycle assessment in Brazilian agriculture facing worldwide trendsJ. Cleaner Prod.289–24
Schipanski M E and Bennett E M 2012 The influence in agricultural trade and livestock production on the global phosphorous cycle Ecosystems15256–68
SEMA 2010aRelatorio de Monitoramento da Qualidade da Agua da Regiao Hidrografica Amazonica–2007–2009(Cuiaba, MT: SEMA, SMIA)
SEMA 2010bRelatorio de Monitoramento da Qualidade da Agua da Regiao Hidrografica do Paraguai–2007–2009(Cuiaba, MT: SEMA, SMIA)
SEMA 2010cRelatorio de Monitoramento da Qualidade da Agua da Regiao Hidrografica Tocantins Araguaia–2007–2009
www.sema.mt.gov.br
Smaling E M A, Roscoe R, Lesschen J P, Bouwman A F and Comunuello E 2008 From forest to waste: assessment of the Brazilian soybean chain, using nitrogen as a markerAgric. Ecosystems Environ.128185–97
Steen-Olsen K, Weinzettel J, Cranston G, Ertug Ercin A and Ertwich E G 2012 Carbon, land and water footprint accounts for the European union: consumption, production and displacements through international tradeEnviron. Sci. Technol.4610883–91
UN Comtrade 2012 Department of Economic and Social Affairs/ Statistics Divisionhttp://comtrade.un.org/db/
UNEP/SETAC Life Cycle Initiative 2005Life Cycle Approaches: The Road From Analysis to Practice(Paris: United Nations Environmental Program) USDA-FAS 2014 World agricultural productionwww.fas.usda.gov/psdonline/circulars/
production.pdf
Van Vuuren D P and Bouwman L F 2005 Exploring past and future changes in the ecological footprint for world regionsEcol. Econ.5243–62
Wackernagel M and Rees W E 1996Our Ecological Footprint: Reducing Human Impact on Earth(Gabriola Island, BC: New Society Publishers)
Weinzettel J, Hertwich E G, Peters G P, Steen-Olsen K and Galli A 2013 Affluence drives the global displacement of land use Glob. Environ. Change23433–8
Wurtenberger L, Koellner T and Binder C R 2006 Virtual land use and agricultural trade: estimating environmental and socio-economic impactsEcol. Econ.57679–97
World Wildlife Fund 2012 Living planet report 2012: biodiversity, biocapacity and better choices
http://awsassets.panda.org/downloads/
1_lpr_2012_online_full_size_single_pages_final_120516.pdf
Zaks D P M, Barford C C, Ramankutty N and Foley J A 2009 Producer and consumer responsibility for greenhouse gas emissions from agricultural production—a perspective from the Brazilian AmazonEnviron. Res. Lett.4044010