U.S. DEPARTMENT OF COMMERCE Technology Administration
National Institute of Standards and Technology
Impacts of Design/Information Technology
on Building and Industrial Projects
Stephen R. Thomas Candace L. Macken Sang-Hoon Lee
NIST GCR 01-828
Office of Applied Economics
Building and Fire Research Laboratory Gaithersburg, MD 20899
Impacts of Design/Information Technology
on Building and Industrial Projects
Stephen R. Thomas, Candace L. Macken, and Sang-Hoon Lee Construction Industry Institute
3925 West Braker Lane Austin, TX 78759-5316
Prepared For:
Robert E. Chapman
Office of Applied Economics
Building and Fire Research Laboratory
National Institute of Standards and Technology Gaithersburg, MD 20899-8603
Under Contract 43NANB010937
October 2001
U.S. DEPARTMENT OF COMMERCE
Donald L. Evans, Secretary
NATIONAL INSTITUTE OF STANDARDS AND TECHNOLOGY
Karen H. Brown, Acting Director
NIST GCR 01-828
U.S. Department of Commerce Technology Administration
National Institute of Standards and Technology
Office of Applied Economics
Building and Fire Research Laboratory Gaithersburg, MD 20899
Foreword
The National Institute of Standards and Technology (NIST) is improving its resource allocation process by doing “microstudies” of its research impacts on society. This report, prepared for NIST by the Construction Industry Institute (CII), is a source document for one of a series of microstudies prepared by NIST’s Building and Fire Research Laboratory (BFRL). Specifically, this report provides empirical data and findings useful in estimating the economic impacts of BFRL’s CONSIAT (construction systems integration and automation technologies) program.
Information and automation technologies are core components of the strategic plans of the U.S. construction industry. The U.S. chemical industry identifies information systems as a key technical discipline in its Technology Vision 2020 and predicts
achieving the smooth flow of information—from concept through design to construction and into plant maintenance and operation—will promote the use of automation and improve economic competitiveness. CII’s 1999 Strategic Plan identifies six major industry trends that will shape the construction industry in the next century. CII identified fully-integrated and automated project processes (FIAPPs) as the most significant trend and predicts it will revolutionize the construction industry. Characteristics of FIAPP products and services include one-time data entry;
interoperability with rules-based design, construction, and operation processes; and user friendly input/output techniques.
The CONSIAT program is an interdisciplinary research effort within BFRL—in collaboration with CII, the private sector, other federal agencies, and other laboratories within NIST—to develop key enabling technologies, standard communication protocols, and advanced measurement technologies needed to deliver FIAPP products and services to the construction industry. The goal of BFRL’s CONSIAT program is to produce products and services that will result in significant reductions in both the delivery time of constructed facilities and the life-cycle costs of those facilities. These products and services are being developed for use by building owners and operators, construction contractors, architects, engineers, and other providers of professional services. The research described in this report focuses on four key design/information
technologies. These technologies are: (1) bar coding; (2) integrated databases; (3) 3D CAD (computer-aided design) systems; and (4) EDI (electronic data interchange). These technologies were selected for evaluation for two reasons. First, they are core
components of the FIAPP products and services currently under development. Consequently, understanding how the use of these technologies affects key project outcomes (i.e., cost, schedule, safety, changes, and field rework) provides a set of lower-bound estimates of the benefits and cost savings that can be expected from the use of FIAPP products and services once they become available commercially. Second, these technologies are covered as part of CII’s annual survey of its membership. The results of the annual survey are compiled by CII and tabulated in its Benchmarking and Metrics
database. By using the Benchmarking and Metrics database, CII was able to measure empirically the economic value of using established, as well as new and innovative design/information technologies within commercial/institutional buildings and industrial facilities.
The research effort described in this report includes (1) a statistical analysis of a broad cross-section of projects from the CII Benchmarking and Metrics database and (2) a synthesis of findings. This two-pronged approach is designed to provide the reader with an understanding of both the current use of design/information technologies and how their use affects project outcomes.
Robert E. Chapman
Office of Applied Economics
Building and Fire Research Laboratory
National Institute of Standards and Technology Gaithersburg, MD 20899-8603
Abstract
This study, sponsored by the National Institute of Standards and Technology (NIST), represents a collaborative effort by industry, government, and academia to evaluate the use of design/information technology (D/IT) and to relate the degree of D/IT use to project performance.
The study consisted of two tasks. The first was a detailed statistical analysis of 566 projects in the Construction Industry Institute (CII) benchmarking database. This analysis produced baseline measures of performance and D/IT use, and then established the correlation between these measures to assess the economic value of using the
technologies. This report, which summarizes the findings of the statistical analyses, was the product of the second study task.
The analytic data set included all U.S. domestic and international projects submitted by owners and contractors between 1997 and 1999 using versions 2.0, 3.0, or 4.0 of the CII Benchmarking database. In order to analyze project data that were comparable in scope for owners and contractors, only those projects for which contractors performed both design and construction tasks were included. The resulting data set was again refined to include two industry groups, industrial and buildings. The results were presented in tables under one of four groupings: Owners, Buildings; Owners, Industrial; Contractors, Buildings; Contractors, Industrial.
The results of this study establish that projects benefit from D/IT use. Both owners and contractors can expect overall project cost savings of approximately 2.1 and 1.8 percent, respectively. For owners, there was evidence of construction cost savings of nearly 4 percent by increasing the use of D/IT, as well. For both, there was evidence of construction schedule compression.
Keywords
Design/information technologies; practice use; performance norms; cost benefits; schedule compression; economic value; project outcomes; technology implementation; bar coding; 3D CAD; EDI; integrated database
Table of Contents
Foreword... iii
Abstract... v
List of Tables ... viii
List of Figures... ix
1. Introduction... 1
1.1 Background... 1
1.2 Purpose... 1
1.3 Scope and Approach ... 1
2. Summary of Task 1 - Statistical Analysis... 3
2.1 Description of Data Set... 3
2.2 Performance Outcomes – All Owners ... 5
2.3 Performance Outcomes – Contractors ... 8
2.4 Degree of Design/Information Technology (D/IT) Practice Use – Owners ... 10
2.5 Degree of Design/Information Technology (D/IT) Practice Use – Contractors.... 10
2.6 Correlation of D/IT Practice Use with Performance Outcomes ... 11
3. Discussion of Task 1 Findings... 21
3.1 Performance Outcomes... 21
3.2 Implementation of D/IT ... 21
3.3 Relationship Between D/IT Use and Outcomes ... 23
Conclusions and Recommendations ... 25
Appendix A – Statistical Notes... 27
Appendix B – Metric Definitions ... 29
Appendix C – Project Phase Definitions ... 33
Appendix D – Calculation of D/IT Use Index... 35
List of Tables
Table 2-1. Summary of Mean Performance Outcomes – Owners ... 7
Table 2-2. Summary of Mean Performance Outcomes – Contractors... 9
Table 2-3. Summary of D/IT Practice Use Scores – Owners ... 10
Table 2-4. Summary of D/IT Practice Use Scores – Contractors ... 11
Table 2-5. Correlation of D/IT Practice Use with Performance Outcomes – All Owners ... 13
Table 2-5a. Correlation of D/IT Practice Use with Performance Outcomes – Owners, Buildings ... 15
Table 2-5b. Correlation of D/IT Practice Use with Performance Outcomes – Owners, Industrial... 16
Table 2-6. Correlation of D/IT Practice Use with Performance Outcomes – All Contractors ... 17
Table 2-6a. Correlation of D/IT Practice Use with Performance Outcomes – Contractors, Industrial ... 19
List of Figures
Figure 2-1. Database by Respondent Type and Location ... 3
Figure 2-2. Database by Industry Group... 4
Figure 2-3. Database by Cost of Project ... 4
Figure 2-4. Database by Project Nature... 5
Figure 2-5. Example D/IT Practice Use versus Performance Outcomes – Owners ... 14
Figure 2-6. Example D/IT Practice Use versus Performance Outcomes – Contractors .. 18
1. Introduction
1.1 Background
Although the evolution and deployment of design/information technologies will undoubtedly play an important role in the future of the construction industry, many stakeholders are still unsure of the economic value of using these technologies. A detailed, authoritative, and readily accessible body of information is needed to enable construction industry stakeholders to make cost-effective investment decisions among established, new, and/or innovative design/information technologies. The Construction Industry Institute (CII) Benchmarking and Metrics (BM&M) database, which is
composed exclusively of actual project execution experiences, provides a valuable basis for the development of this body of information.
CII is a unique consortium of owners, designers, builders, and universities formed to improve the capital project delivery process. Its research agenda and activities are the result of a collaborative effort between industry and academic researchers. Through this ongoing collaboration, CII has established a database that supports the benchmarking of construction industry performance and practice use metrics. The data in the database have been systematically collected since 1996 to support the benchmarking effort. The database includes over 1,000 projects from 69 member companies and organizations.
1.2 Purpose
The purpose of this research, sponsored by the National Institute of Standards and Technology (NIST), was to measure and evaluate the economic value of using
established, as well as new and innovative, design/information technologies (D/IT) within the construction industry. Specifically, this investigation identified and documented the benefits of using design/information technologies from actual project experiences.
1.3 Scope and Approach
This research effort consisted of two tasks specified by NIST. The first was a detailed statistical analysis of a cross-section of projects from the CII Benchmarking and Metrics database. This analysis produced baseline measures of performance and indicators of economic value. Industry norms were identified on five key performance outcome categories: Cost, Schedule, Safety, Changes, and Field Rework. Norms were also established for the use of design/information technology practices. Second, the
correlation of design/information technology degree of use with the use of other “best” practices and with each of the five key performance outcomes was determined and documented.
The analytic data set was created using owner- and contractor-reported data from U.S. domestic and international projects submitted to the larger CII database between 1997 and 1999. Only data from versions 2.0, 3.0, and 4.0 of the CII benchmarking survey instrument were included in this analysis because the version 1.0 questionnaire did not address design/information technology use. In order to analyze project data that were comparable in scope for owners and contractors, only those projects for which
contractors performed both design and construction tasks were included. The data set was further refined to include projects classified under one of two industry groups, industrial and buildings. This resulted in an analytic data set consisting of 566 projects, 346 of which were submitted by owners and 220 by contractors. Analyses and chart types, consistent with the standard chart types produced by the CII BM&M Committee, were specified by NIST. Tables include descriptive and statistical summaries also specified by NIST.
The final task of this research was the development of this report, which summarizes the findings of Task 1. Baseline measures of performance are discussed and key measures of economic value identified.
3
2. Summary of Task 1 - Statistical Analysis
This section provides a summary of the statistical analyses for the 566 projects meeting the criteria specified by NIST. Descriptive statistics are presented followed by tables summarizing average outcomes, degree of D/IT use, and the correlation between D/IT use and performance outcomes.
2.1 Description of Data Set
The study included all U.S. domestic and international projects for which data on D/IT use were collected. Owner and contractor data were segregated for analyses, and contractor data were included only if the contractor performed both design and
construction tasks. Data were further categorized by Industry Group, Cost, and Project Nature. Two industry groups were analyzed, buildings and industrial. Three cost
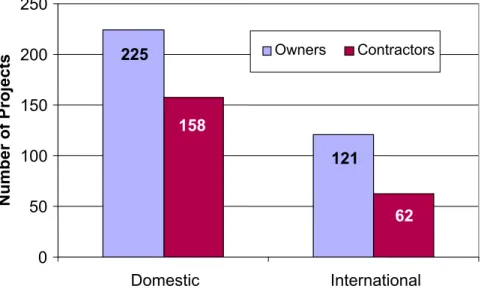
categories were used, less than $15 million, $15-50 million, and greater than $50 million. Each project was also classified by nature as add-on, grass roots, or modernization. Bar charts showing the number of owner and contractor projects for each category follow.
Figure 2-1. Database by Respondent Type and Location
121 225 62 158 0 50 100 150 200 250 Domestic International Location Number of Projects Owners Contractors
Figure 2-2. Database by Industry Group
Figure 2-3. Database by Cost of Project
260 86 213 7 0 50 100 150 200 250 300 Building Industrial Industry Group Number of Projects Owners Contractors 73 182 91 65 84 71 0 50 100 150 200 <$15MM $15MM-$50MM >$50MM Cost Category ($ MM) Num b er of Projects Owners Contractors
5
Figure 2-4. Database by Project Nature
Subject to the selection criteria discussed above, all projects in the CII database were eligible for inclusion in this analysis. In some cases, however, item responses were excluded from the detailed analyses that follow because they were deemed to be
statistical outliers based on the decision rule described in Appendix A. Also, the number of projects represented in the tables was reduced by item nonresponse and confidentiality rules. Thus, while the data in Figures 2-1 through 2-4 above represent all the projects included in the analytic data set, the data included in Tables 2-1 through 2-6a represent only those data values that are more typical values throughout the entire distribution of projects.
All data were presented as aggregates to ensure that no individual project could be identified in any of the charts or tables. When the risk of identifying any project in any subcategory was increased due to the small number of projects in any subcategory, the data for that subcategory were suppressed to ensure confidentiality. This was particularly true for analyses of contractor projects classified in the Buildings Industry Group. See Appendix A for an explanation of the CII confidentiality policy and its application.
2.2 Performance Outcomes – All Owners
Table 2-1 summarizes owner project performance for each analysis category. In this summary only mean values are shown. The table reveals a number of important
characteristics of these projects. First, the average cost, schedule, and safety performance among all owner projects was relatively good. Overall, the projects experienced cost growth of -3.2 percent and schedule growth of 4.5 percent. The recordable incident rate
111 95 140 90 84 46 0 50 100 150
Add on Grass Roots Modernization Project Nature
Number of Projects
(RIR) of 3.132 and lost workday case rate (LWCIR) of 0.671 were well below industry averages for similar projects1. Forty-two percent of the projects reported no recordable incidents at all, and slightly more than 73 percent reported no lost workday cases. By Industry Group, industrial projects generally experienced better cost, schedule, and change performance than building projects as indicated by table cell shading. Building projects claimed the best overall safety performance.
Results by Cost Category were mixed. It was the larger projects, those costing over $50 million, that reported somewhat better performance in the Cost, Changes, and Rework categories, and in the Safety-related LWCIR. Smaller projects, those costing less than $15 million, reported better rates of zero recordables and lost workdays. Midsize projects, with costs ranging between $15 and $50 million, reported better schedule performance, but the small difference is not likely to be significant.
By Project Nature, add-ons and modernization projects exhibited stronger overall performance than did grass roots. Both add-ons and modernization projects performed better in the Cost performance category. Add-ons exhibited better performance in project schedule growth and construction schedule growth. Modernization projects experienced better Safety performance.
7
Table 2-1. Summary of Mean Performance Outcomes – Owners
1 Metric definitions are provided in Appendix B. Shading indicates best performance within category. 2 Phase definitions are provided in Appendix C. *= Statistical warning indicator. See Appendix A.
3 n=76 C.T.= Data withheld per CII Confidentiality Policy. See Appendix A. 4 n=240
By Industry Group By Cost Category (millions) By Project Nature Performance Metric1 All
Owners Buildings3 Industrial4 <$15 $15-$50 >$50 Add Grass Modern
COST
Project Cost Growth -0.032 -0.004 -0.042 -0.034 -0.028 -0.034 -0.035 -0.026 -0.035 Construction Cost Growth2 -0.012 0.036 -0.027 -0.012 -0.018 -0.003 -0.015 -0.005 -0.015
Startup Cost Growth2 -0.086 -0.030* -0.092 -0.140 -0.039 -0.066 -0.144 -0.034 -0.091
Construction Phase Cost
Factor2 0.579 0.846 0.495 0.621 0.534 0.532 0.535 0.638 0.562
Startup Phase Cost Factor2 0.040 0.052* 0.039 0.039 0.040 0.044 0.036 0.046 0.040
SCHEDULE
Project Schedule Growth 0.045 0.087 0.032 0.069 -0.001 0.038 0.027 0.052 0.051
Construction Schedule Growth2 0.073 0.109 0.063 0.070 0.067 0.086 0.054 0.085 0.076
Startup Schedule Growth2 -0.050 -0.018 -0.055 -0.035 -0.060 -0.062 -0.068 -0.140 0.027
Actual Overall Project Duration 133 154 126 116 133 180 117 161 123
Actual Total Project Duration 100 128 91 87 100 133 90 122 89
Construction Phase Duration2 60 79 54 49 62 87 54 75 52
Startup Phase Duration2 9.15 11.55 8.79 8.00 8.52 12.50 9.41 11.40 7.53
Const. Phase Duration Factor2 0.468 0.541 0.443 0.431 0.489 0.538 0.484 0.500 0.433
Startup Phase Duration Factor2 0.098 0.113 0.096 0.086 0.084 0.136 0.102 0.116 0.085
SAFETY
R.I.R. 3.132 2.617 3.223 3.166 2.685 3.586 3.042 3.353 3.036
L.W.C.I.R. 0.671 0.779 0.652 0.566 1.060 0.443 0.809 1.070 0.299
Zero Recordables 42.0% 59.4% 38.9% 62.6% 29.8% 10.4% 37.9% 27.0% 54.9%
Zero Lost Workdays 73.1% 75.8% 72.6% 88.6% 68.3% 48.1% 68.3% 60.6% 84.9%
CHANGES
Change Cost Factor 0.054 0.060 0.051 0.058 0.053 0.044 0.055 0.047 0.058
Change Schedule Factor 0.044 0.062 0.036 0.042 0.062 0.029 0.034 0.056 0.042
REWORK
Field Rework Cost Factor 0.051 0.049 0.052 0.051 0.059 0.033* 0.045 0.037 0.064
2.3 Performance Outcomes – Contractors
Table 2-2 contains the outcome summary for contractor projects. Again, only mean performance values are shown, and the best performances under Cost and Project Nature are shaded. Due to the small number of cases included under the Buildings Industry Group, data were suppressed for confidentiality reasons.
Overall, contractors reported better schedule performance than owners, especially in the areas of project and construction schedule growth. Cost performance for contractors was generally worse than that of owners, but contractors led owners in safety performance with a somewhat lower RIR (2.107 v. 3.132) and a much lower LWCIR (0.134 v. 0.671). By Cost Category, smaller projects performed better than midsize or larger projects in cost performance. Smaller projects were also the best performers in the Safety
performance category, with the rates of zero recordables at 57.6% and zero lost workdays at 96.9% far surpassing the rates of midsize or larger projects. The best schedule
performance was achieved by midsize projects. Large projects performed best in the Changes category.
By Project Nature, patterns similar to owners were observed with modernization projects generally achieving the best performance. Unlike the pattern observed for owners, grass roots projects appeared to perform better than add-ons.
9
Table 2-2. Summary of Mean Performance Outcomes – Contractors
By Industry Group By Cost Category (millions) By Project Nature Performance Metric1 All
Contractors Buildings3 Industrial4 <$15 $15-$50 >$50 Add Grass Modern
COST
Project Budget Factor 0.956 C.T. 0.956 0.952 0.957 0.961 0.969 0.958 0.931
Project Cost Growth 0.044 C.T. 0.043 0.042 0.047 0.044 0.048 0.049 0.029
Construction Cost Growth2 0.070 C.T. 0.070 0.038 0.095 0.075 0.089 0.056 0.067
SCHEDULE
Project Schedule Growth 0.022 C.T. 0.021 0.029 .0009 0.028 0.024 0.024 0.014
Construction Schedule
Growth2 0.037 C.T. 0.035 0.055 0.029 0.030 0.045 0.038 0.023
Project Schedule Factor 0.979 C.T. 0.980 0.966 0.972 1.001 0.983 0.978 0.973
Construction Phase Duration2 61 C.T. 61 42 54 86 61 67 48
SAFETY
R.I.R. 2.107 C.T. 2.045 2.051 2.561 1.738 2.176 1.722 2.996
L.W.C.I.R. 0.134 C.T. 0.138 0.015 0.169 0.176 0.107 0.153 0.130
Zero Recordables 25.9% C.T. 25.0% 57.6% 18.8% 13.0% 20.0% 29.0% 30.4%
Zero Lost Workdays 60.5% C.T. 59.2% 96.9% 65.9% 34.0% 72.1% 48.5% 75.0%
CHANGES
Change Cost Factor 0.077 C.T. 0.075 0.102 0.072 0.055 0.080 0.073 0.080
Change Schedule Factor 0.034 C.T. 0.034 0.038 0.037 0.026 0.035 0.037 0.028
REWORK
Field Rework Cost Factor 0.028 C.T. 0.022 0.031* 0.025 0.028 0.033 0.027 0.019*
Field Rework Schedule Factor 0.013 C.T. 0.011 C.T. 0.014* 0.007* C.T. 0.014 C.T.
1 Metric definitions are provided in Appendix B. Shading indicates best performance within category. 2 Phase definitions are provided in Appendix C. * = Statistical warning indicator. See Appendix A.
3 n=6 C.T. = Data withheld per CII Confidentiality Policy. See Appendix A. 4 n=185
2.4 Degree of Design/Information Technology (D/IT) Practice Use – Owners
Owner D/IT practice use statistics are summarized in Table 2-3. D/IT practice use was scored as an index that measured the degree of use of four technologies: integrated databases, electronic data interchange (EDI), 3D CAD modeling, and bar coding. The index was scored on a 0 to 10 scale with 0 indicating no use and 10 indicating extensive use. Since only one metric was depicted in the table, the number of observations for each category was conveniently provided in the last row.
The positive correlation between project size and practice use typically observed
throughout the CII database was apparent here as well2. Industrial projects are generally larger projects compared to buildings, and as expected, reported higher use of D/IT. Shaded cells indicate highest use within the category. An interesting observation was the large number of projects reporting no use of the technologies. Among all owners, the bottom quartile reported no use, although among industrial projects some D/IT use was reported. Since all projects would have been expected to use some D/IT practices, the low scores are more likely to be due to interpretation and survey issues. These issues will be discussed later in this report.
Table 2-3. Summary of D/IT Practice Use Scores – Owners
Note: Appendix D describes how D/IT Index is calculated. Shading indicates best performance within category.
2.5 Degree of Design/Information Technology (D/IT) Practice Use – Contractors
The data in Table 2-4 show that on average, contractor use of D/IT exceeds that of
owners. The mean score for all contractors was 2.19 compared to all owners at 1.45. For confidentiality purposes, data are only shown for industrial projects in the Industry Group section of the table. In general, larger contractor projects as categorized by cost made greater use of D/IT practices, although it is interesting to note that the highest use score
By Industry Group By Cost Category (millions) By Project Nature
Percentile Ranking
All
Owners Buildings Industrial <$15 $15-$50 >$50 Add Grass Modern
100% 9.38 6.97 9.38 6.97 7.88 9.38 7.88 9.38 5.56 90% 4.00 2.78 4.63 2.82 4.73 5.56 3.64 5.50 2.86 75% 2.15 1.25 2.44 1.60 2.38 3.97 2.43 2.92 1.79 50% 0.86 0.24 1.09 0.71 1.01 1.14 1.08 0.69 0.81 25% 0.00 0.00 0.19 0.00 0.00 0.00 0.24 0.00 0.00 10% 0.00 0.00 0.00 0.00 0.00 0.00 0.00 0.00 0.00 0% 0.00 0.00 0.00 0.00 0.00 0.00 0.00 0.00 0.00 Mean 1.45 0.80 1.65 1.10 1.54 2.15 1.47 1.76 1.18 s.d. 1.76 1.29 1.84 1.28 1.83 2.37 1.60 2.26 1.31 n 316 75 241 161 87 68 86 104 126
11
higher scores in all but one percentile ranking of the distribution, and they had the highest mean use of D/IT.
Table 2-4. Summary of D/IT Practice Use Scores – Contractors
Note: Appendix D describes how D/IT Index is calculated.
C.T. = Data withheld per CII Confidentiality Policy. See Appendix A. Shading indicates best performance within category.
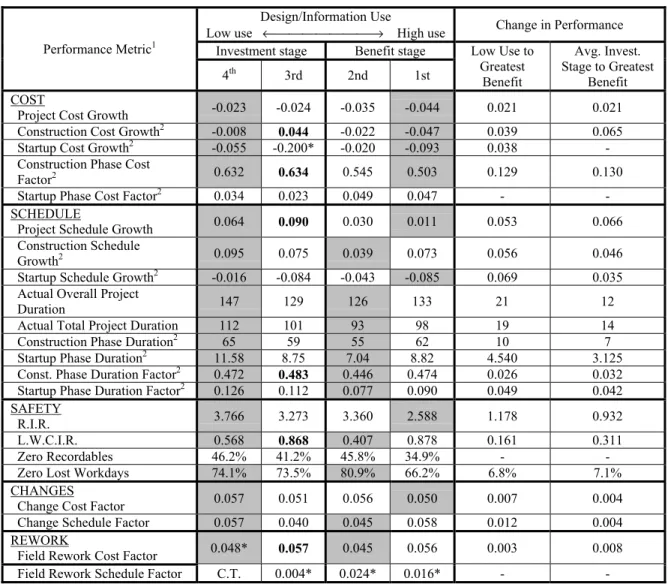
2.6 Correlation of D/IT Practice Use with Performance Outcomes
The correlation summary for D/IT practice use and performance outcomes for all owner projects is presented in Table 2-5 below. The first column lists the performance metric. Definitions for the performance metrics and project phases are provided in Appendices B and C. The second through fifth columns of the table show the mean value for each performance metric for projects falling within each quartile of the D/IT practice use continuum. The sixth and seventh columns show the potential change in performance as a result of increasing D/IT use.
As D/IT use advances from the 4th quartile (indicating low D/IT use) to the 1st quartile (indicating high D/IT use), the outcome values would be expected to decrease, reflecting improved performance with increased practice use. In Table 2-5, the 3rd and 4th quartiles
of D/IT use have been characterized as the investment stage of D/IT use, in which owners and contractors have begun to use the practices but have not necessarily experienced measurable benefit from them in terms of improved performance. The 1st and 2nd
quartiles of D/IT use have been characterized as the benefit stage, in which the benefits of increased D/IT use have accrued, as seen in improved performance. Shading is generally used to indicate the worst performance, usually in the 4th quartile, and the best
performance for that performance metric, as well.
As a general rule, performance improved with increased practice use. Note, for example, that project cost growth performance improved from its baseline of –0.023 in the 4th
quartile of use to –0.044 in the 1st quartile of use. In some instances, however,
continuous improvements in performance were not always observed with increases in practice use. As highlighted by bold text, in some cases a decrease in performance can
By Industry Group By Cost Category (millions) By Project Nature
Percentile Ranking ContractorsAll
Buildings Industrial <$15 $15-$50 >$50 Add Grass Modern
100% 9.85 C.T. 9.85 9.85 7.62 8.23 7.99 9.85 5.94 90% 5.06 C.T. 5.12 3.43 5.19 6.30 4.56 6.35 3.88 75% 3.43 C.T. 3.44 2.00 3.85 4.57 2.85 4.30 2.15 50% 1.63 C.T. 1.66 0.88 2.16 2.07 1.38 2.04 1.41 25% 0.66 C.T. 0.67 0.28 0.99 1.04 0.47 0.66 0.77 10% 0.00 C.T. 0.00 0.00 0.37 0.58 0.00 0.46 0.00 0% 0.00 C.T. 0.00 0.00 0.00 0.00 0.00 0.00 0.00 Mean 2.19 C.T. 2.25 1.35 2.56 2.87 1.88 2.72 1.71 s.d. 2.02 C.T. 2.03 1.58 1.95 2.26 1.86 2.30 1.42 n 201 7 194 77 64 60 80 82 39
be observed as companies initiated use of new technologies when moving from the 4th to 3rd quartile of D/IT use. This suggests a performance penalty associated with a learning curve for new technologies. Figure 2-5 is a plot of the construction cost growth data from Table 2-5; it was selected to illustrate the learning curve effect. In cases where a learning penalty is evident, the shading convention as described above is not followed. Note that in most cases, the 3rd quartile learning penalty can be directly tied to the construction phase in the Cost, Schedule, Safety, and Rework performance categories. Although it is not apparent from these data, construction phase considerations may also be directly responsible for a learning curve penalty in project schedule growth
performance and LWCIR.
The greatest benefit of D/IT use accrued in the 1st or 2nd quartile, depending on the performance metric. For Cost, it generally occurred in the 1st quartile of usage. For Schedule, it generally occurred in the 2nd quartile. The pattern for Safety, Changes, and Rework was mixed.
In order to simplify the analysis of the effect of increased D/IT use on performance, the sixth and seventh columns were added to show the increase in performance due to increased use of D/IT. The sixth column shows the increase in performance that was realized from the 4th quartile of use to the quartile of highest use. The seventh column was added to take into account the learning curve penalty by averaging the performance in the 3rd and 4th quartiles of use. The information in this column may be interpreted in a fashion similar to that of the previous column, that is, it shows the increase in
performance from a starting point (the average of the 3rd and the 4th quartile performance) to the quartile of highest use. When considering the data in this column, the following should be taken into account: it may be a more conservative estimate of benefit since a decrease in performance from the 4th to the 3rd quartile will result in an increase in overall performance (as in the case of a third quartile learning penalty), while an increase in performance from the 4th to the 3rd quartile will result in a decrease in overall
13
Table 2-5. Correlation of D/IT Practice Use with Performance Outcomes
– All Owners
Design/Information Use
Low use ←→ High use Change in Performance
Investment stage Benefit stage
Performance Metric1 4th 3rd 2nd 1st Low Use to Greatest Benefit Avg. Invest. Stage to Greatest Benefit COST
Project Cost Growth -0.023 -0.024 -0.035 -0.044 0.021 0.021
Construction Cost Growth2 -0.008 0.044 -0.022 -0.047 0.039 0.065
Startup Cost Growth2 -0.055 -0.200* -0.020 -0.093 0.038
-Construction Phase Cost
Factor2 0.632 0.634 0.545 0.503 0.129 0.130
Startup Phase Cost Factor2 0.034 0.023 0.049 0.047 -
-SCHEDULE
Project Schedule Growth 0.064 0.090 0.030 0.011 0.053 0.066
Construction Schedule
Growth2 0.095 0.075 0.039 0.073 0.056 0.046
Startup Schedule Growth2 -0.016 -0.084 -0.043 -0.085 0.069 0.035
Actual Overall Project
Duration 147 129 126 133 21 12
Actual Total Project Duration 112 101 93 98 19 14
Construction Phase Duration2 65 59 55 62 10 7
Startup Phase Duration2 11.58 8.75 7.04 8.82 4.540 3.125
Const. Phase Duration Factor2 0.472 0.483 0.446 0.474 0.026 0.032
Startup Phase Duration Factor2 0.126 0.112 0.077 0.090 0.049 0.042
SAFETY
R.I.R. 3.766 3.273 3.360 2.588 1.178 0.932
L.W.C.I.R. 0.568 0.868 0.407 0.878 0.161 0.311
Zero Recordables 46.2% 41.2% 45.8% 34.9% -
Zero Lost Workdays 74.1% 73.5% 80.9% 66.2% 6.8% 7.1%
CHANGES
Change Cost Factor 0.057 0.051 0.056 0.050 0.007 0.004
Change Schedule Factor 0.057 0.040 0.045 0.058 0.012 0.004
REWORK
Field Rework Cost Factor 0.048* 0.057 0.045 0.056 0.003 0.008
Field Rework Schedule Factor C.T. 0.004* 0.024* 0.016* -
-1 Metric definitions are provided in Appendix B.
2 Phase definitions are provided in Appendix C.
* = Statistical warning indicator. See Appendix A.
C.T. = Data withheld per CII Confidentiality Policy. See Appendix A.
Bold indicates performance penalty for learning curve effect.
Shading indicates worst performance in the investment stage (except where there is a performance penalty) and best performance in the benefit stage.
Figure 2-5. Example D/IT Practice Use versus Performance Outcomes – Owners
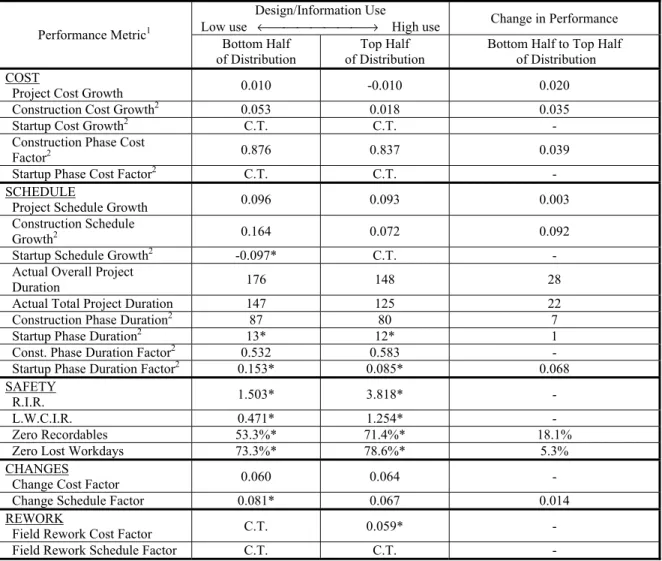
Tables 2-5a and 2-5b show the correlation of D/IT practice use with performance outcomes broken out by Owners, Buildings and Owners, Industrial, respectively. Much of the discussion that follows focuses on industrial projects because the analysis is likely to have provided more reliable data than for building projects. Though analyzed, the small number of building projects often resulted in less reliable data, as indicated. For the most part, Table 2-5a shows a consistent pattern of improvement in the performance metric among building projects between low D/IT use to high D/IT use. The data in this table should be interpreted with caution, however, due to the small number of projects included for some metrics.
Table 2-5b shows the results for industrial projects. One can observe a general pattern of improvement in performance when projects move from low D/IT use to high use here, as well. Performance improvements in the Cost performance category were generally realized in the 1st quartile of D/IT use; improvements in the Schedule performance category were mixed. These results closely mirrored those of all owners in Table 2-5. With the removal of Buildings from the data, however, improvements in Safety were clearly realized in the 2nd quartile of use. When the data for buildings were included (Table 2-5), improvements in Safety were mixed. The Changes and Rework categories
■ Mean Median
15
readily tied to construction phase considerations. In addition to the construction phase, the learning penalty was evident in project cost growth and overall and total project duration. Performance improved in the 2nd quartile for Safety and improved in the 1st quartile for the change cost factor and field rework cost factor.
Table 2-5a. Correlation of D/IT Practice Use with Performance Outcomes
– Owners, Buildings
Design/Information Use
Low use ←→ High use Change in Performance
Performance Metric1
Bottom Half
of Distribution of DistributionTop Half Bottom Half to Top Half of Distribution
COST
Project Cost Growth 0.010 -0.010 0.020
Construction Cost Growth2 0.053 0.018 0.035
Startup Cost Growth2 C.T. C.T.
-Construction Phase Cost
Factor2 0.876 0.837 0.039
Startup Phase Cost Factor2 C.T. C.T.
-SCHEDULE
Project Schedule Growth 0.096 0.093 0.003
Construction Schedule
Growth2 0.164 0.072 0.092
Startup Schedule Growth2 -0.097* C.T.
-Actual Overall Project
Duration 176 148 28
Actual Total Project Duration 147 125 22
Construction Phase Duration2 87 80 7
Startup Phase Duration2 13* 12* 1
Const. Phase Duration Factor2 0.532 0.583
Startup Phase Duration Factor2 0.153* 0.085* 0.068
SAFETY
R.I.R. 1.503* 3.818*
L.W.C.I.R. 0.471* 1.254*
Zero Recordables 53.3%* 71.4%* 18.1%
Zero Lost Workdays 73.3%* 78.6%* 5.3%
CHANGES
Change Cost Factor 0.060 0.064
Change Schedule Factor 0.081* 0.067 0.014
REWORK
Field Rework Cost Factor C.T. 0.059*
Field Rework Schedule Factor C.T. C.T.
-1 Metric definitions are provided in Appendix B.
2 Phase definitions are provided in Appendix C.
* = Statistical warning indicator. See Appendix A.
Table 2-5b. Correlation of D/IT Practice Use with Performance Outcomes
– Owners, Industrial
Design/Information Use
Low use ←→ High use Change in Performance
Investment stage Benefit stage
Performance Metric1 4th 3rd 2nd 1st Low Use to Greatest Benefit Avg. Invest. Stage to Greatest Benefit COST
Project Cost Growth -0.041 -0.028 -0.040 -0.059 0.018 0.025
Construction Cost Growth2 -0.033 0.024 -0.059 -0.050 0.026 0.055
Startup Cost Growth2 -0.100 -0.119 -0.009 -0.091 -
-Construction Phase Cost
Factor2 0.467 0.549 0.489 0.453 0.014 0.055
Startup Phase Cost Factor2 0.038 0.030 0.045 0.046 -
-SCHEDULE
Project Schedule Growth 0.041 0.033 0.023 0.018 0.023 0.019
Construction Schedule
Growth2 0.055 0.034 0.052 0.089 0.003
Startup Schedule Growth2 -0.004 -0.043 -0.069 -0.113 0.109 0.090
Actual Overall Project
Duration 126 132 124 124 2 5
Actual Total Project Duration 91 92 89 91 2 2.5
Construction Phase Duration2 50 56 52 56 - 1
Startup Phase Duration2 10.8 6.8 7.1 9.4 3.7 1.7
Const. Phase Duration Factor2 0.432 0.450 0.421 0.456 0.011 0.020
Startup Phase Duration Factor2 0.119 0.090 0.094 0.079 0.040 0.026
SAFETY
R.I.R. 4.479 3.241 2.474 3.073 2.005 1.386
L.W.C.I.R. 0.596 0.511 0.294 1.143 0.302 0.260
Zero Recordables 43.9% 40.0% 38.1% 31.1% -
Zero Lost Workdays 74.4% 75.0% 83.3% 59.2% 8.9% 8.6%
CHANGES
Change Cost Factor 0.051 0.049 0.059 0.045 0.006 0.005
Change Schedule Factor 0.039 0.047 0.042 0.039 - 0.004
REWORK
Field Rework Cost Factor 0.054* 0.054 0.058 0.044 0.010 0.010
Field Rework Schedule Factor C.T. 0.010* C.T. C.T. -
-1 Metric definitions are provided in Appendix B.
2 Phase definitions are provided in Appendix C.
* = Statistical warning indicator. See Appendix A.
C.T. = Data withheld per CII Confidentiality Policy. See Appendix A.
Bold indicates performance penalty for learning curve effect.
Shading indicates worst performance in the investment stage (except where there is a performance penalty) and best performance in the benefit stage.
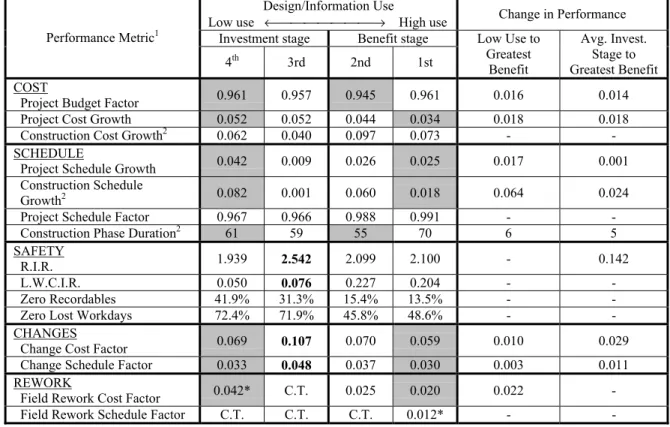
Tables 2-6 and 2-6a summarize the correlation of D/IT use and performance outcomes for contractors in a manner similar to that of owners in Tables 2-5 and 2-5b. Though analyzed, no data broken out by Contractors, Buildings are shown for confidentiality reasons.
17
Within the Cost category, project cost growth showed a marked improvement in performance as D/IT use increased. Within the Schedule category, project schedule growth showed a clear pattern of improvement as D/IT use increased. In Safety, what was notable was that increased D/IT use did not have an effect on improved performance. Both metrics within the Changes category showed a trend toward improved performance as projects increased D/IT use. The field cost rework factor showed improvement, but this should be interpreted with caution due to the small number of projects falling into the first quartile of the distribution. Third quartile learning curve penalties were observed in the RIR metric and in the Changes category. The learning curve penalty in the change cost factor is illustrated in Figure 2-6. The results from Table 2-6a, broken out for Contractors, Industrial, are similar to that of Table 2-6.
Table 2-6. Correlation of D/IT Practice Use with Performance Outcomes – All Contractors
Design/Information Use
Low use ←→ High use Change in Performance
Investment stage Benefit stage
Performance Metric1 4th 3rd 2nd 1st Low Use to Greatest Benefit Avg. Invest. Stage to Greatest Benefit COST
Project Budget Factor 0.961 0.957 0.945 0.961 0.016 0.014
Project Cost Growth 0.052 0.052 0.044 0.034 0.018 0.018
Construction Cost Growth2 0.062 0.040 0.097 0.073 -
-SCHEDULE
Project Schedule Growth 0.042 0.009 0.026 0.025 0.017 0.001
Construction Schedule
Growth2 0.082 0.001 0.060 0.018 0.064 0.024
Project Schedule Factor 0.967 0.966 0.988 0.991 -
Construction Phase Duration2 61 59 55 70 6 5
SAFETY
R.I.R. 1.939 2.542 2.099 2.100 - 0.142
L.W.C.I.R. 0.050 0.076 0.227 0.204 -
Zero Recordables 41.9% 31.3% 15.4% 13.5% -
Zero Lost Workdays 72.4% 71.9% 45.8% 48.6% -
-CHANGES
Change Cost Factor 0.069 0.107 0.070 0.059 0.010 0.029
Change Schedule Factor 0.033 0.048 0.037 0.030 0.003 0.011
REWORK
Field Rework Cost Factor 0.042* C.T. 0.025 0.020 0.022
Field Rework Schedule Factor C.T. C.T. C.T. 0.012* -
-1 Metric definitions are provided in Appendix B.
2 Phase definitions are provided in Appendix C.
* = Statistical warning indicator. See Appendix A.
C.T. = Data withheld shown per CII Confidentiality Policy. See Appendix A.
Bold indicates performance penalty for learning curve effect.
Shading indicates worst performance in the investment stage (except where there is a performance penalty) and best performance in the benefit stage.
Figure 2-6. Example D/IT Practice Use versus Performance Outcomes – Contractors
■ Mean Median
19
Table 2-6a. Correlation of D/IT Practice Use with Performance Outcomes – Contractors, Industrial
Design/Information Use
Low use ←→ High use
Change in Performance
Investment stage Benefit stage
Performance Metric1 4th 3rd 2nd 1st Low Use to Greatest Benefit Avg. Invest Stage to Greatest Benefit COST
Project Budget Factor 0.953 0.959 0.952 0.959 0.001 0.004
Project Cost Growth 0.052 0.043 0.056 0.023 0.029 0.025
Construction Cost Growth2 0.053 0.051 0.104 0.068 -
-SCHEDULE
Project Schedule Growth 0.034 0.010 0.030 0.022 0.012
-Construction Schedule
Growth2 0.052 0.015 0.072 0.013 0.039 0.021
Project Schedule Factor 0.973 0.966 0.994 0.988 -
Construction Phase Duration2 62 58 59 69 3 1
SAFETY
R.I.R. 2.473 1.913 2.385 1.705 0.768 0.488
L.W.C.I.R. 0.058 0.095 0.220 0.211 -
Zero Recordables 36.4% 32.3% 11.5% 15.2% -
Zero Lost Workdays 67.7% 70.0% 47.8% 46.9% -
-CHANGES
Change Cost Factor 0.075 0.097 0.075 0.047 0.028 0.039
Change Schedule Factor 0.032 0.042 0.040 0.027 0.005 0.010
REWORK
Field Rework Cost Factor 0.038* C.T. 0.025 0.021 0.017
Field Rework Schedule Factor C.T. C.T. C.T. 0.008* -
-1 Metric definitions are provided in Appendix B.
2 Phase definitions are provided in Appendix C.
* = Statistical warning indicator. See Appendix A.
C.T. = Data withheld per CII Confidentiality Policy. See Appendix A.
Bold indicates performance penalty for learning curve effect.
Shading indicates worst performance in the investment stage (except where there is a performance penalty) and best performance in the benefit stage.
A number of differences are apparent for all owners and all contractors from the analysis of Tables 2-5 and 2-6. For all owners, Table 2-5 clearly indicated reductions in project cost growth, construction cost growth, and project schedule growth with increased D/IT use. This was perhaps the most consistent observation in Table 2-5. Contractor data in Table 2-6, however, revealed less consistent improvements in project cost growth and project schedule growth with increased D/IT use. Construction cost growth showed no trend toward improvement with increased D/IT use for contractors. Overall and total project duration outcomes for contractors are not provided since their participation is limited to the phases of their contract. The Safety performance improvements in the RIR experienced by owners with increased D/IT use were not apparent for contractors,
although there was stronger contractor performance in rework as evidenced by the field rework cost factor.
21
3. Discussion of Task 1 Findings 3.1 Performance Outcomes
Owner-related performance outcomes generally supported what has already been reported in the literature. Projects costing over $50 million reported better performance in the Cost, Changes, and Rework performance categories. This finding is not
unexpected since larger projects usually report greater use of performance enhancing practices. Also consistent with the literature is the finding that projects costing less than $15 million reported better rates of zero recordables and lost workdays.
A rather surprising finding was the relatively stronger performance of owner-submitted add-on and modernization projects versus grass roots projects. Given the complications often associated in the execution of the former two, one might have expected grass roots projects to show better performance. Of course, grass roots projects tend to be larger in scope and are subject to certain performance hindering factors, such as being more complex, having greater personnel turnover, being fast-tracked more often, and being more affected by communications issues.
Contractor safety performance exceeded that of owners in two key indicators, the
Recordable Incident Rate, and the Lost Workday Case Incident Rate. This may be due to the difference between contractors and owners in the degree of involvement in capital facility projects. For contractors, the design and construction of capital facilities is the major business activity, thus making it imperative to apply best safety practices to avoid downtime, schedule protraction, and concomitant impacts on insurance rates and
revenues due to accidents and injuries. For owners, the construction of capital facilities may be an activity subordinate to the primary purpose for business operations, e.g., manufacturing. Some owners may not as strongly emphasize the implementation of best safety practices for capital facility projects as contractors might. This is borne out by data showing not only that the mean level of safety practice use was higher among
contractors, but also that the spread of the distribution was narrower, implying greater use of safety practices by contractors.3
3.2 Implementation of D/IT
The data in Tables 2-3 and 2-4 showed that larger projects tended to make more use of D/IT. This held true when analyzing projects by Cost Category or by Project Nature. For both owners and contractors larger projects as defined by Cost had, in general, the highest D/IT use scores. This relationship was also observed for grass roots projects, especially so for those projects submitted by contractors. Such performance may be explained by the fact that grass roots projects are normally larger than add-on or modernization projects, and as noted above, larger projects tended to make greater use of D/IT.
Use of the surveyed technologies was likely to be greater than the Task 1 statistical analyses indicate. The large number of projects reporting no use, essentially 25 percent of each Industry Group, was probably indicative of survey instrumentation errors. These included errors in interpreting what these technologies were, definitional problems, and skip patterns. The application of these technologies may be new for many companies, and there may be a number of misconceptions concerning them. As an example,
anecdotal evidence has shown that project representatives sometimes demonstrate a lack of understanding of what “integrated databases” are. Although most companies use integrated databases, they often fail to identify their application as such. Versions 2.0 and 3.0 of the CII survey instrument, which were used to collect some of these data, placed the questions on use of D/IT near the end of the 23-page questionnaire. Each technology surveyed contained a lead-in question such as “Was an integrated database utilized on this project?” The structure of the questionnaire created an unintended short cut to finishing the survey for those respondents that were unsure of the question being asked, since answering “no” to the leading question permitted them to skip that set of questions. Version 4.0 and subsequent versions of the questionnaire have been revised so that the respondent cannot skip blocks of questions.
To answer the question of whether the use of these technologies is expanding, a trend analysis was performed by analyzing D/IT use by year. Figure 3-1 illustrates this trend for the period 1994-1999. To prepare this chart, the degree of D/IT use was assessed for each project controlling for the impact of declining project sizes. This step was
warranted in light of the obvious correlation between project size and D/IT use apparent in Tables 2-3 and 2-4. As shown in these tables, projects in the greater than $50 million Cost Category reported more use than the smaller project categories for both owners and contractors. The technique also controls for the greater average size of contractor
projects, which was $50 million as compared to $37 million for owners in the CII database.
Based on the results of this analysis, it seems reasonable to conclude that the use of the four technologies is expanding. Figure 3.1 shows an overall upward trend in D/IT use for the period 1994-1999. The downturn for both owners and contractors in 1998 was due to an increase in average project cost for the year and the method of adjustment to control for declining project size. For contractors, the average project cost more than doubled between 1997 and 1998. For owners, the average project cost increased at a rate of over 20 percent over the same time period. The increase in average project cost served to decrease the D/IT use index as controlled for project size. No data were plotted for contractors in 1999 since there were fewer than 10 projects included in the data set. The data for owners shows a sharp upturn in 1999. This was due to a combination of
decreased average project cost and a large increase in the average D/IT index. Despite the fact that the relative degree of practice use decreased in 1998 then sharply increased, the longer term trend in the index indicates that D/IT use is continuing to rise.
23
Figure 3-1. D/IT Use
Design/Information Technology 0.0 0.5 1.0 1.5 2.0 2.5 3.0 3.5 1994 1995 1996 1997 1998 1999 Contractor Owner
Since the cost of these technologies is decreasing significantly each year, the trend shown in Figure 3-1 is likely to continue. Another factor that is likely to be contributing to increased practice use is changes in the team members executing the projects. As new members join the project team, many of whom have a greater appreciation for technology use, resistance to adoption of these technologies is decreasing.
Another question of interest is “Who reaps the greater benefit for implementing these technologies?” A comparison of owner and contractor data on potential performance gains from increased use of these technologies shown in Tables 2-5 through 2-6a provides a means of answering the question. Comparing the change in the performance metric for owners and contractors indicates that owners appeared to benefit more in cost savings, schedule, and safety. The results for changes, and rework were mixed.
3.3 Relationship Between D/IT Use and Outcomes
Data summarized for owners in Tables 2-5 through 2-5b and for contractors in Tables 2-6 and 2-6a clearly indicate a relationship between increased use of these technologies and better project performance, although the trend was not necessarily one of increased performance with increasing marginal D/IT use. A 3rd quartile learning penalty could be
directly tied to construction phase considerations for both owners and contractors. Third quartile learning penalties were in evidence in contractor project cost growth and total project duration performance metrics, as well.
The overall trend, however, was one of improved performance with increased use of D/IT. This was seen in improved cost performance associated with D/IT use. Owners experienced project cost savings of 2.1 percent, and contractors experienced savings of 1.8 percent as D/IT use increased.
There was strong evidence to indicate that use of these technologies also contributed to schedule compression. Construction schedule growth improved by 5.6 percent for owners and by 6.4 percent for contractors. Table 2-5 revealed that among owners, those projects that used the technologies the most tended to have shorter than average
durations. The table showed reductions in both overall project and construction durations with increased use of D/IT. There clearly must be some schedule compression involved that resulted in reduced durations as project sizes increased. Of particular interest, however, was that this trend was not as dramatic for contractor projects (Table 2-6). The compression apparent for owners may be related to their broader role in the project and benefits gained from use of D/IT throughout all phases. As noted, contractor data are for those contractors performing both design and construct functions.
Impacts on safety performance are clear: owners undoubtedly obtain quantifiable safety benefits, whereas for contractors the impact was less obvious. The statistical analyses confirm the benefit of D/IT use as it related to rework, although the data must be
interpreted with caution due to the small number of cases contributing to the rework data indicated by Tables 2-5 and 2-6.
25
Conclusions and Recommendations
This study produced some significant and interesting findings. First, the uses of D/IT and project performance are positively correlated. Projects reporting greater use of the
technologies usually report much better performance. Both owners and contractors continue to increase the use of the technologies and both realize meaningful benefits. Owners, however, appear to obtain a broader range of benefits. This likely was related to their larger role in the project.
Project size is the single most important factor for determining the degree of use for these technologies on most projects. Fortunately, as the cost of implementing these
technologies continues to fall, it is likely that there will be increased use in smaller projects.
Use of the various technologies tends to overlap. Although not specifically addressed in this study, there was probably a synergistic advantage of using multiple technologies. This perhaps should be evaluated in future studies.
There was a risk for companies as they began implementing D/IT on their projects. A pronounced learning curve effect was noticeable in many cases, resulting in performance penalties, which perhaps reflected the costs and schedule impacts as team members experiment with the technologies. The rewards for those that achieve higher degrees of implementation, however, more than offset the concerns for the risks. Most benefits of use were realized by moving to the top half of the distribution as scored by the CII D/IT index. It was not necessary to become a 1st quartile user, as overall performance
differences between the 1st and 2nd quartiles are not significant.
Finally, the composition of the CII database must be considered when interpreting these findings. Table 4-1 depicts the total number of projects currently in the CII database by industry group. The majority of the projects are in the industrial group. CII has made progress in expanding representation of the buildings industry group so that data for these projects were included in the analysis. Efforts at expanding the representation of the infrastructure industry group continue. When a sufficient number of projects from this industry group become available, these may also be included in any new analyses.
Table 4-1. Distribution of Current CII Database by Industry Group
Building Industrial Infrastructure
Domestic 90 269 25
Owner International 40 88 17
Domestic 31 310 35
Contractor International
More work should go into clarifying the definitions of the surveyed technologies so the definitional problems noted earlier can be corrected. Further research should be
undertaken to assess the question of expanding the number of technologies in the CII survey instrument, as the four technologies studied are not a comprehensive assessment of D/IT use within the industry.
27
Appendix A – Statistical Notes Confidentiality
When there were less than 10 projects available in a category or when less than 3 companies submitted the data, no statistical summaries are provided. This is consistent with the CII policy on confidentiality and in such cases the code “C.T.” (confidentiality test) was inserted in the tables.
Statistical Warning Indicator
When there are less than 20 projects included in any table cell, an asterisk (*) follows the data value. This notation indicates that the data in that table cell should be interpreted with caution due to the small number of projects represented in that cell.
Removal of Statistical Outliers
Prior to performing the Task 1 statistical analyses, all outcome metrics values calculated were screened to remove statistical outliers. This step was incorporated to remove values so extreme that their inclusion would likely distort the statistical summaries produced. The technique used to identify statistical outliers was the same used to define outliers in most statistical texts. This is also the same definition used for outlier commonly used in the preparation of box and whisker plots. All values exceeding the 75th percentile value +1.5 times the inter-quartile range or those less than the 25th percentile value - 1.5 times the inter-quartile range were excluded.
29
Appendix B – Metric Definitions
Performance Metric Formulas and Definitions
Performance Metric Category: COST Metric: Project Cost Growth
Metric: ProjectBudget Factor (Contractor data only)
Metric: Phase Cost Factor (Owner data only)
Formulas:
Actual Total Project Cost - Initial Predicted Project Cost Initial Predicted Project Cost
Formula:
Actual Total Project Cost
Initial Predicted Project Cost +Approved Changes
Formula:
Actual Phase Cost Actual Total Project Cost
Metric: Phase Cost Growth (Owner data only) Formula:
Actual Phase Cost – Initial Predicted Phase Cost Initial Predicted Phase Cost
Definition of Terms
Actual Total Project Cost:
• Industrial sector owners - Total installed cost at turnover, excluding land costs.
• Building sector owners – Total cost of design and construction to prepare the facility for occupancy. • Contractors – Total cost of the final scope of work. Initial Predicted Project Cost:
• Owners – Budget at the start of detail design. • Contractors – Cost estimate used as the basis of
contract award.
Actual Phase Cost:
• All costs associated with the project phase in question. • See the Project Phase Table in Appendix C for phase
definitions.
Initial Predicted Phase Cost:
• Budget at the start of detail design.
• See the Project Phase Table in Appendix C for phase definitions.
Approved Changes
Performance Metric Category: SCHEDULE Metric: Project Schedule Growth Formula:
Actual Total Proj. Duration - Initial Predicted Proj. Duration Initial Predicted Proj. Duration
Metric: Project Schedule Factor (Contractor data
only) Formula: Actual Total Project Duration
Initial Predicted Project Duration + Approved Changes
Metric: Phase Duration Factor (Owner data only) Formula:
Actual Phase Duration Actual Overall Project Duration
Metric: Total Project Duration Actual Total Project Duration (weeks)
Metric: Construction Phase Duration Actual Construction Phase Duration (weeks)
Definition of Terms
Actual Total Project Duration:
• Owners – Duration from beginning of detail design to turnover to user.
• Contractors - Total duration for the final scope of work from mobilization to completion.
Actual Overall Project Duration:
• Unlike Actual Total Duration, Actual Overall Duration also includes time consumed for the Pre-Project Planning Phase.
Actual Phase Duration:
• Actual total duration of the project phase in question. See the Project Phase Table in Appendix C for phase
definitions.
Initial Predicted Project Duration:
• Owners - Duration prediction upon which the authorization to proceed with detail design is based. • Contractors - The contractor's duration estimate at the
time of contract award. Approved Changes
31
Performance Metric Category: SAFETY Metric: Recordable Incident Rate (RIR) Formula:
Total Number of Recordable Cases x 200,000 Total Site Work-Hours
Metric: Lost Workday Case Incident Rate (LWCIR) Formula:
Total Number of Lost Workday Cases x 200,000 Total Site Work-Hours
Definition of Terms
• Recordable Cases: All work-related deaths and illnesses, and those work-related injuries that result in: loss of consciousness, restriction of work or motion, transfer to another job, or require medical treatment beyond first aid.
• Lost Workday Cases: Cases that involve days away from work or days of restricted work activity, or both.
Performance Metric Category: CHANGES
Metric: Change Cost Factor Formula:
Total Cost of Changes Actual Total Project Cost
Definition of Terms
Total Cost of Changes:
• Total cost impact of project scope and project development changes. Changes in project scope are changes to the original limits of work contractually negotiated by each party, e.g., changes in the purpose for which an edifice is constructed or size of the project. Changes in project development are changes required to execute the original scope of work, e.g., unforeseen site conditions or changes required due to errors or omissions.
Actual Total Project Cost:
• Industrial Sector Owners – Total installed cost at turnover, excluding land costs.
• Building Sector Owners – Total cost of design and construction to prepare the facility for occupancy. • Contractors – Total cost of the final scope of work.
Performance Metric Category: REWORK Metric: Total Field Rework Factor Formula:
Total Direct Cost of Field Rework Actual Construction Phase Cost
Definition of Terms
• Total Direct Cost of Field Rework: Total direct cost
of field rework regardless of initiating cause. • the construction phase. See the Project Phase Table inActual Construction Phase Cost: All costs associated with Appendix C for construction phase definition.
33
Appendix C – Project Phase Definitions
Project Phase Table
Project Phase Start/Stop Typical Activities & Products Typical Cost Elements
Pre-Project Planning Typical Participants: • Owner personnel • Planning Consultants • Constructability Consultant • Alliance / Partner
Start: Defined Business Need that requires facilities Stop: Total Project Budget
Authorized
• Options Analysis • Life-cycle Cost Analysis • Project Execution Plan • Appropriation Submittal Pkg • P&IDs and Site Layout • Project Scoping • Procurement Plan • Arch. Rendering
• Owner Planning team personnel expenses
• Consultant fees & expenses • Environmental Permitting costs • Project Manager / Construction
Manager fees • Licensor Costs Detail Design Typical Participants: • Owner personnel • Design Contractor • Constructability Expert • Alliance / Partner
Start: Design Basis
Stop: Release of all approved drawings and specs for construction (or last package for fast-track)
• Drawing & spec preparation • Bill of material preparation • Procurement Status
• Sequence of operations • Technical Review • Definitive Cost Estimate
• Owner project management personnel • Designer fees
• Project Manager / Construction Manager fees
Demolition / Abatement (see note below)
Typical Participants: • Owner personnel • General Contractor • Demolition Contractor • Remediation / Abatement Contractor
Start: Mobilization for demolition
Stop: Completion of demolition
• Remove existing facility or portion of facility to allow construction or renovation to proceed
• Perform cleanup or abatement / remediation
• Owner project management personnel • Project Manager / Construction
Manager fees
• General Contractor and/or Demolition specialist charges
• Abatement / remediation contractor charges
Note: The demolition / abatement phase should be reported when the demolition / abatement work is a separate schedule activity (potentially paralleling the design and procurement phases) in preparation for new construction. Do not use the demolition / abatement phase if the work is integral with modernization or addition activities.