DOT HS 811 208 October 2009
Motorcycle Helmet Use and
Head and Facial Injuries
This publication is distributed by the U.S. Department of Transportation, National Highway Traffic Safety Administration, in the interest of information exchange. The opinions, findings and conclusions expressed in this publication are those of the author(s) and not necessarily those of the Department of Transportation or the National Highway Traffic Safety Administration. The United States Government assumes no liability for its content or use thereof. If trade or manufacturers’ names or products are mentioned, it is because they are considered essential to the object of the publication and should not be construed as an endorsement. The United States Government does not endorse products or manufacturers.
Technical Report Documentation Page 1. Report No.
DOT HS 811 208
2. Government Accession No. 3. Recipients's Catalog No.
5. Report Date
October 2009
4. Title and Subtitle
Motorcycle Helmet Use and Head and Facial Injuries:
Crash Outcomes in CODES-Linked Data 6. Performing Organization Code
7. Author(s)
Lawrence J. Cook, Ph.D.; Tim Kerns, M.S.; Cindy Burch, M.P.H.; Andrea Thomas, M.S.; Emily Bell, M.S.
8. Performing Organization Report No.
10. Work Unit No. (TRAIS)n code 9. Performing Organization Name and Address
Utah Crash Outcome Data Evaluation System 615 Arapeen Dr., Suite 202
Salt Lake City, UT 84108-1226
11. Contract of Grant No.
13. Type of Report and Period Covered
NHTSA Technical Report
12. Sponsoring Agency Name and Address
State Data Reporting Division, Office of Data Acquisition, NVS-412,
National Center for Statistics and Analysis National Highway Traffic Safety Administration 1200 New Jersey Avenue SE.
Washington, DC 20590
14. Sponsoring Agency Code
NVS-412
15.Supplementary Notes
John Kindelberger was the Contracting Officer’s Technical Representative for this project.
16. Abstract
This report examines the relationship between motorcycle helmet use and motorcycle crash outcomes in terms of injury types, hospital charges, and other variables employing data from the Crash
Outcome Data Evaluation System (CODES), a program facilitated by the National Highway Traffic Safety Administration. Helmeted motorcyclists were less likely to experience facial and head injuries compared to unhelmeted motorcyclists. Helmeted motorcyclists were significantly less likely to experience a traumatic brain injury. TBIs are of particular concern in our study. TBI was associated with significantly higher hospital charges. Additionally, motorcyclists with TBI were much less likely to be discharged home and more likely to require rehabilitation or to be discharged to a long-term care facility following their hospitalization. Both of these destinations are likely to result in costs and burdens for the injured motorcyclists beyond the scope of this study’s data. Finally, motorcyclists involved in alcohol- or drug-related crashes and speed-related crashes had higher odds of
experiencing poor outcomes.
17. Key Words
Crash Outcome Data Evaluation System, CODES, motorcycle, helmet
18. Distribution Statement
Document is available to the public through the National Technical Information Service, Springfield, VA 22161
19. Security Classif. (of this report)
Unclassified 20. Security Classif. (of this page) Unclassified 21. No of Pages 55 22. Price
TABLE OF CONTENTS
TABLE OF CONTENTS... ii
LIST OF TABLES... iii
LIST OF FIGURES ... iv
EXECUTIVE SUMMARY ... 1
BACKGROUND AND SIGNIFICANCE... 2
METHODOLOGY ... 4
CODES Data Network... 5
Combination of State Data... 6
Injury Severity Measures ... 7
Statistical Analysis... 8
Imputation... 8
Descriptive Analysis ... 9
Multivariable Modeling ... 9
Software ... 9
RESULTS ... 10
Data Set Description ... 10
Crash Characteristics ... 10
Vehicle and Operator Characteristics ... 12
Motorcyclist Characteristics ... 13
Hospitalized Motorcyclists ... 16
Injury Severity by Helmet Use ... 22
Effectiveness of Motorcycle Helmets... 26
Facial Injury ... 27
Head Injury ... 28
Moderate to Severe Head and Facial Injuries ... 29
Traumatic Brain Injury ... 30
CONCLUSIONS... 32
APPENDIX A... 34
APPENDIX B ... 39
APPENDIX C ... 40
APPENDIX D... 41
APPENDIX E ... 44
LIST OF TABLES
Table 1. Data Years by State... 6
Table 2. Motorcycle Crash Characteristics... 11
Table 3. Motorcycle Characteristics ... 12
Table 4. Motorcyclist Characteristics ... 13
Table 5. Crash Outcomes... 16
Table 6. Injury Status... 16
Table 7. Maximum Abbreviated Injury Scale (MAIS)... 18
Table 8. Head/Face and Traumatic Brain Injuries for Hospital-Treated Motorcyclists ... 18
Table 9. Median Hospital Charges by MAIS Head/Facial and Traumatic Brain Injury Severity*... 19
Table 10. Helmet Use by MAIS Head/Facial Injury Severity ... 23
Table 11. Helmet Use by MAIS Trunk Body Regions Injury Severity... 24
Table 12. Helmet Use by MAIS Extremity Injury Severity ... 25
Table 13. Helmet Use by MAIS External Injury Severity... 25
Table 14. Helmet Use by TBI Severity... 26
Table 15. Percent of Motorcyclists in Helmet Use Category by Facial Injury... 27
Table 16. Logistic Regression Results Predicting Facial Injury... 28
Table 17. Percent of Motorcyclists in Helmet Use Category by Head Injury ... 28
Table 18. Logistic Regression Results Predicting Head Injury ... 29
Table 19. Percent of Motorcyclists in Helmet Use Group by Moderate to Severe Head/Facial Injury... 30
Table 20. Logistic Regression Results Predicting Moderate to Severe Head or Facial Injury ... 30
Table 21. TBI Status by Helmet Use Group... 31
LIST OF FIGURES
Figure 1. Motorcyclist Fatalities by Age Group and Year... 2
Figure 2. Motorcyclist Age Group... 13
Figure 3. Motorcyclist Age by Gender ... 14
Figure 4. Motorcyclists Age by Helmet Use ... 15
Figure 5. AIS Injured Body Region*... 17
Figure 6. Percent of Motorcyclists Discharged Home by TBI Severity ... 20
Figure 7. Discharge Status by TBI Severity ... 21
EXECUTIVE SUMMARY
This report examines the relationship between motorcycle helmet use and motorcycle crash outcomes in terms of injury types, hospital charges, and other variables employing data from the Crash Outcome Data Evaluation System (CODES), a program facilitated by the National Highway Traffic Safety Administration. States that participate in CODES perform probabilistic linkage between State crash data and medical outcome data, and use the resulting data for analyses of crash outcomes in support of highway safety.
This study represents the first time since 1996 that CODES States have submitted data for a combined analysis and the first time that as many as 18 States contributing 48 State-years of linked data have been included in such a study. The analysis was carried out under NHTSA sponsorship by the CODES Technical Resource Center established at the University of Utah.
Eighteen States in the CODES Data Network submitted the data used in this study. The combined data set contains information on 104,472 motorcyclists involved in crashes in these 18 States during the years 2003, 2004, and 2005. Advanced statistical methods such as multiple imputation were used to analyze the data.
In the data set, 57 percent of motorcyclists were helmeted at the time of the crashes and 43 percent were non-helmeted. For both groups, about 40 percent of motorcyclists were treated at hospitals or died following the crashes. However, 6.6 percent of unhelmeted motorcyclists suffered a moderate to severe head or facial injury compared to 5.1 percent of helmeted motorcyclists. Moderate to severe injuries were defined as a Maximum Abbreviated Injury Severity (MAIS) scale of level 2 or higher
Fifteen percent of hospital-treated helmeted motorcyclists suffered traumatic brain injury (TBI) compared to 21 percent of hospital-treated unhelmeted motorcyclists. TBI severity varied by helmet use. Almost 9 percent of unhelmeted and 7 percent of helmeted
hospital-treated motorcyclists received minor to moderate TBI. More than 7 percent of unhelmeted and 4.7 percent of hospital-treated helmeted motorcyclists sustained severe TBI.
Median charges for hospitalized motorcyclists who survived to discharge were 13 times higher for those incurring a TBI compared to those who did not sustain a TBI ($31,979 versus $2,461). Over 85 percent of hospital-treated motorcyclists without a TBI were discharged home, compared to 56 percent of motorcyclists with severe TBI.
Motorcyclists admitted to the hospital with TBI were more likely to die, be discharged to rehab, or transferred to a long-term care facility. While 17 percent of all
hospital-admitted motorcyclists had TBI, they account for 54 percent of all hospital-admitted riders who did not survive.
A logistic regression analysis that accounted for clustering of motorcyclists within States indicated that helmets significantly reduced the odds of sustaining head or facial injury, TBI, and dying in the hospital.
The use of standardized data submissions from multiple CODES States proved to be feasible and productive. Methods initiated for this study can be further developed for future specialized studies of crash outcomes using pooled CODES data.
BACKGROUND AND SIGNIFICANCE
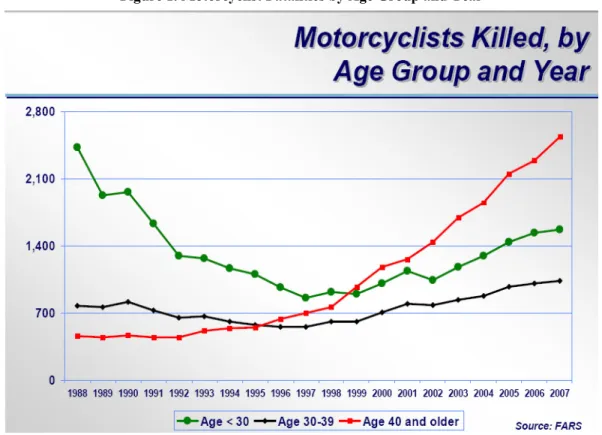
During the past decade in the United States, there has been a dramatic rise in fatality rates for motorcyclists (Figure 1). Data from the National Center for Statistics and Analysis (NCSA) of the National Highway Traffic Safety Administration (NHTSA, 2008) reveal that, as of 2007, fatalities had increased for the 10th year in a row, an increase of 144 percent compared to 1997. While there has also been an increase in motorcycle
registrations during this period, the rate of increase in fatalities has been greater than that of registrations (NHTSA, 2005).
Figure 1. Motorcyclist Fatalities by Age Group and Year
Source: NHTSA, NCSA, FARS, 2008.
This increase has been especially marked among riders 40 and older, who now constitute approximately half of all deaths (NHTSA, 2008). In 1997, this older group accounted for 33 percent of rider deaths, but had grown to 49 percent by 2007. Although fatalities
age of 49; thus the mean age of fatally injured motorcyclists has increased from 29.3 in 1990 to 37.9 in 2002. The overall percentage of older riders involved in crashes has increased. While younger people are still riding motorcycles, they now constitute a smaller proportion of fatalities.
One potential intervention for preventing injuries as a result of motorcycle crashes are motorcycle helmets. In a study of fatally injured riders, Sarkar et al. (1995) noted that 36 percent of deaths among helmeted riders were due to trunk injuries, as compared to 19 percent among the non-helmeted. Similar findings were noted in a California study of fatalities before and after a mandatory helmet law (Kraus et al., 1994). Also, according to a study conducted at the National Study Center for Trauma and Emergency medical Systems (NSC), the number of motorcycle fatalities decreased by 37 percent after enactment of the Maryland mandatory motorcycle helmet law. Additionally, helmeted motorcyclists were significantly less likely to suffer TBI than were those unhelmeted motorcyclists (Auman et al., 2002).
Despite the burden of injury associated with motorcycle crashes, at least 6 States have repealed or weakened laws that require the use of motorcycle helmets since 1995. Also, 3 States don’t have a helmet law of any kind. The weakening of helmet laws in States has corresponded to a decrease in motorcycle helmet use (NHTSA, 2008). Furthermore, few comprehensive studies have been conducted to examine the types of injuries
sustained by hospitalized motorcyclists; instead, most studies have focused primarily on fatalities, comparing riders with and without helmets, and trends in head injury following repeal or passage of motorcycle helmet laws. The Fatality Analysis Reporting System (FARS) data does include information on motorcyclist fatalities, but injury data is limited to the KABCO scale and only pertain to fatal crashes. The National Automotive
Sampling System (NASS) General Estimates System, a large NHTSA database consisting of a sample of crashes nationwide, includes only police-observed injury information, and the NASS Crashworthiness Data System, which conducts detailed crash investigations, does not include data on motorcyclists.
Although the focus of this study is on head and facial injuries, several studies have addressed the high rates of lower-extremity, chest, and abdominal injuries following motorcycle crashes. Kraus et al. (2002), in a study of the incidence of thoracic and abdominal injuries among injured motorcyclists in California, reported that multiple intra-thoracic and intra-abdominal injuries were common, and that the number of rib fractures and whether they were bilateral was strongly associated with serious injuries to the thoracic and abdominal organs. In a British study of injured motorcyclists, Ankarath et al. (2002) showed that thoracic and abdominal trauma as well as pelvic ring fractures associated with long bone injuries were the major contributors to reduced survival following head injury.
In the original Report to Congress (1996) on the Benefits of Safety Belts and Motorcycle Helmets, data on motorcycle crashes from 7 States were compiled as part of the CODES. That study employed probabilistic linkage techniques to combine data gathered from police crash reports, emergency medical services, hospital emergency departments, and
hospital discharge files to more fully describe motorcycle crash events and their outcomes. Among other findings, that report revealed (1) that hospital charges for
motorcyclists who were unhelmeted were on average 8 percent higher than for those who were helmeted; and (2) that the use of a motorcycle helmet was 67 percent effective in the reduction of brain injuries. However, due to large amounts of missing data, these estimates were not adjusted for other potential predictors of injury severity.
This report further explores the relationship between helmet use and hospital outcomes. The main outcomes of interest in this study are those that motorcycle helmets could potentially prevent, namely head, facial, and traumatic brain injuries. This study further improves upon the earlier CODES analysis by expanding the number of States included in the analysis from 6 to 18. Furthermore, the use of statistical imputation to estimate missing values allows for the inclusion of all crash records into a multivariable model, thus producing estimates that have been adjusted for other crash factors.
A note on the terminology used in the report:
motorcycle rider (operator) - the person operating or in control of the motorcycle motorcycle passenger - the person seated behind the rider and not in control of the motorcycle
motorcyclist – a collective term used for any combined reference to the rider and passenger of the motorcycle
METHODOLOGY
This study represents the first time since 1996 that CODES States have submitted data for a combined analysis and the first time that as many as 18 States contributing 48 State-years of linked data have been included in such a study. The analysis was carried out under NHTSA sponsorship by the CODES Technical Resource Center (TRC) established at the University of Utah and CODES Program Resource Center (PRC) established at the University of Maryland.
CODES Data Network
The CODES Data Network was used to generate data in order to perform an assessment of the medical outcomes of motorcycle crashes. The CODES Data Network consists of 19 States that work in cooperation with NHTSA to probabilistically link State motor vehicle crash data to statewide medical care systems such as EMS, emergency department admissions, and inpatient hospital discharges.
Individual States are responsible for obtaining the necessary files to participate in
CODES. These include a minimum of the State motor vehicle crash and hospital inpatient discharge databases. Additionally, several States obtain emergency department and emergency medical services databases. CODES Data Network grantees are also responsible for conducting probabilistic linkages of their data using CODES 2000 software. Almost always these databases are owned by more than one State agency and the data’s use is governed by the State’s CODES Board of Directors, an entity created within the State that is responsible for ensuring that State data are available for linkage and developing the policies that control release of the linked data in compliance with State privacy legislation/regulations. An explanation of CODES methodologies and frequently asked questions are included in Appendices D and E.
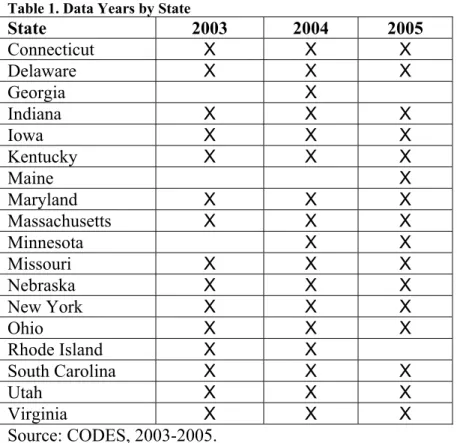
Following approval from all 19 State boards of directors, States were requested to submit person-level linked data for all motorcyclists in police reported crashes for the years 2003 to 2005. All 19 States in the CODES Data Network were able to respond to this request. One State, Illinois, is not included due to an inordinate amount of missing data on motorcycle helmet use. Fourteen States were able to provide data for all three years, while 2 States provided data from two years, and 2 States provided a single year of data (Table 1).
Table 1. Data Years by State
State 2003 2004 2005
Connecticut X X X
Delaware X X X
Georgia X
Indiana X X X
Iowa X X X
Kentucky X X X
Maine X
Maryland X X X
Massachusetts X X X
Minnesota X X
Missouri X X X
Nebraska X X X
New York X X X
Ohio X X X
Rhode Island X X
South Carolina X X X
Utah X X X
Virginia X X X
Source: CODES, 2003-2005.
Combination of State Data
An inherent difficulty in combining crash data from multiple States is that police crash reports differ from State to State. To overcome differing definitions of data elements, a set of standardized variables was created (Appendix A). Each State was responsible for determining the most appropriate method of creating each standardized variable from its crash report and hospital data sets. States electronically submitted their standardized data to the CODES Technical Recourse Center at the University of Utah, which provides assistance to the CODES program under a cooperative agreement with NHTSA. Additionally, States submitted data dictionaries describing how State-specific data elements were used to create the standardized variables. CODES TRC personnel reviewed the data dictionaries and consulted with each State to ensure an accurate mapping from the State crash report.
Due to variability in State crash reports, some States were unable to create all of the standardized variables. Appendix B shows variable availability by State. While most variables were captured by all States, such as time and month of crash, some variables were much less frequently available. These variables include whether or not the motorcycle rider (operator) was licensed or had an endorsement for motorcycles and whether the crash occurred in a rural or urban location. VIN information was also sparsely captured from State to State and therefore will not be included in this report. Similarly, motorcycle licensure/endorsement is excluded from this analysis. Crash reports in the various CODES States are not detailed enough to allow
a comparison of the effectiveness between different types of helmets, i.e., U.S.
Department of Transportation (DOT) approved versus not DOT-approved, or face shield versus no face shield. Finally, all hospital charges have been adjusted to 2005 dollars.
Injury Severity Measures
This report makes use of several measures of injury severity. Among the foremost are KABCO and AIS. “KABCO” is an acronym for the injury severity field on most crash reports. The levels of KABCO are roughly defined as follows: K = fatal injury, A = severe or incapacitating injury, B = non-incapacitating injury, C = possible injury, O = not injured. KABCO is frequently used when analyzing motor vehicle crashes since it is available directly from the crash report and does not require a linkage to any other sources. However KABCO is considered unreliable since it is often assessed at the scene of the crash by police who are trained in public safety and not necessarily in determining injury severity (Farmer, 2003).
The Abbreviated Injury Severity Scale (AIS) is an anatomical scoring system based on hospital-collected information. AIS assigns scores on a scale from 0 to 6: 0 = no injury, 1 = minor, 2 = moderate, 3 = serious, 4 = severe, 5 = critical, 6 = unsurvivable. In addition to determining the severity of an injury, AIS scores also designate the injured body region. To determine the most severe injury sustained, the Maximum AIS (MAIS) is taken to be the highest AIS score from the nine body regions (AAAM, 1990).
Ideally, AIS scores are calculated by a trained medical coder reviewing the patient chart. In CODES, however, States only have access to billing data. This data contains
International Classification of Disease 9th Revision Clinical Modification (ICD-9-CM) codes that translate injuries and other diseases into a series of billing codes. For this reason, the computer program ICDMap-90 (John Hopkins University and Tri-Analytics, Inc., Baltimore, MD) was used to convert ICD-9-CM codes to AIS and MAIS values. Grantees without access to this software submitted their linked crash ICD-9-CM codes to the CODES PRC. ICDMap-90 does have some inherent weaknesses (Cryer, 2006; Meredith et al., 2002). In particular, it is possible for certain ICD-9-CM codes to map to more than one AIS code and therefore to different levels of severity. While this may lead to overestimation of injury severity in some instances, it does keep the estimates
consistent from State to State. Estimated AIS and MAIS from ICD-9-CM codes were preferred over other severity scoring systems, such as Injury Severity Score (ISS) or Survivability Risk Ratios (SRR), due to AIS and MAIS being captured in other NHTSA data systems, most notably the NASS. Once the MAIS variables were generated, States were responsible for incorporating the results back into their linked State data sets. Throughout the report we will compare injury severity as captured by KABCO and MAIS as a method of demonstrating the added value CODES-linked data can provide beyond an analysis of the crash file alone.
Given the focus of the report on motorcycle helmets, head injuries are of particular concern. One of the most severe and costly injuries a person can sustain is a traumatic brain injury. TBI may lead to a lifetime of disability and result in significant
rehabilitation and long-term care costs. For this report we used the Barell Matrix definition of TBI (Barell et al., 2002). The Barell Matrix uses ICD-9-CM codes to categorize TBI into three groups, as follows:
1. Severe TBI: consists of injuries with evidence of an intracranial injury or moderate to prolonged loss of consciousness.
2. Moderate TBI: consists of injuries with no evidence of intracranial injury and loss of consciousness of less than one hour or an unknown or undocumented loss of consciousness.
3. Mild TBI: consists of head injuries with no intracranial injury and no loss of consciousness.
Additionally, we present a fourth category, “potential TBI,” which was defined to be motorcyclists not already grouped into one of the other three TBI categories and having an ICD-9-CM Code of 959.01 (unspecified head injury) (NCIPC, 2003). State CODES personnel were responsible for mapping the ICD-9-CM codes in their hospital files to the Barell Matrix definitions. Individual ICD-9-CM codes were not available in the data submitted to NHTSA and the CODES TRC and are therefore not presented in this report.
Statistical Analysis
Imputation
Probabilistic linkage methodology incorporates multiple imputation to accurately account for the uncertainty associated with unavoidable missing values and sometimes
inaccurately collected data inherent with large administrative data sets. The linkage process involves generating the probability distribution of matches and then sampling matches to produce multiply imputed data sets. Following probabilistic linkage, multiple imputation is used to estimate missing values for analysis. Since not all variables were available in each State, State-specific missing value imputation models were developed. Five imputed data sets were created for each State. Following imputation, all State data were combined into a single data set for analysis.
Although imputation of missing values is done at the person level, some variables describe vehicle or crash characteristics. As a result, variables that might be expected to be the same for all people on a given motorcycle or in a specific crash may differ as a result of the missing value imputation. While this is not an unexpected result of multiple imputation, it does introduce difficulties when aggregating variables to the vehicle or crash level. To correctly total the number of motorcycles and crashes in the data set, imputed values for vehicle and crash characteristics were weighted according to the number of motorcyclists for vehicle and crash level analyses. For example, consider one motorcycle with two motorcyclists and a missing value for the variable “alcohol or drug involvement.” It is possible that during imputation one motorcyclist was imputed to “Yes” while the other imputed to “No.” Under our weighting scheme each motorcyclist would contribute half of a count to the variable in an analysis of alcohol and drug involvement. This method was employed for all vehicle and crash level variables.
category, it allows us to analyze accurate counts without arbitrary decisions regarding which imputed value is most correct and thereby potentially introducing bias.
Descriptive Analysis
For this study, univariate statistics are used to describe crash, motorcycle, driver, and motorcyclist characteristics within the CODES States. Two-way associations between helmet use and hospital outcomes, such as injury severity, body area injured, receiving a TBI, and median hospital charges, are described using contingency tables and bar charts.
Multivariable Modeling
To estimate associations between motorcycle helmet use and head/facial injuries,
multivariable logistic regression models are employed. Generalized estimating equations (GEE) with exchangeable correlation structures are used to account for the clustering of motorcyclists within States. The specific outcomes considered using these models are whether the motorcyclist received a facial injury; whether the motorcyclist received a head injury; whether the motorcyclist received a moderate to severe head or facial injury (defined as MAIS > 2); and whether the motorcyclist received a TBI.
Several explanatory variables were initially included in the multivariable models. These variables were: gender, age, speed limit, whether the crash was speed-related, alcohol and/or drug involvement, whether the crash was intersection-related, helmet use,
motorcyclist type: rider (operator) versus passenger, single-vehicle versus multi-vehicle crash, whether the crash occurred at night (9 p.m. to 5:59 a.m.), and urban versus rural location of the crash. Interactions were considered between helmet use and each of: single vehicle, alcohol/drug involvement, and urban/rural location. Variables were selected based on their availability within the CODES Network and inclusion in the CODES Report to Congress (1996).
After initial models were analyzed, interactions between helmet use and both drug/alcohol involvement and urban/rural were removed because they were not
statistically significant in any model. Urban versus rural location also failed to achieve statistical significance in any model and was removed, thus allowing the incorporation of States that were unable to calculate this variable (Iowa, Ohio, and South Carolina).
Software
All analyses were performed in SAS 9.1.3. Multivariable logistic regression GEEs were computed using PROC GENMOD; PROC MIANALYZE was used to combine results across imputations.
RESULTS
The combined data set contained information on 104,472 motorcyclists. There were 93,527 motorcycles involved in 89,086 crashes in 18 States during the years 2003-2005. The median number of riders contributed per State was 5,144. The most any State contributed to the analysis was 15,910 riders and the least was 737.
Data Set Description
The next three sections are used to provide the reader with a description of the combined CODES data set and not intended as national estimates of motorcycle crash and
motorcyclist characteristics.
Crash Characteristics
Table 2 displays the characteristics of the 89,086 crashes. Over two-thirds (67.6%) of all motorcycle crashes occurred between noon and 8:59 p.m. Motorcycle crashes were more likely to occur in summer months (June, July, and August). Slightly more crashes
involved multiple vehicles (56.4%) compared to just the motorcycle (43.6%). Sixty-eight percent of crashes with a known urban/rural designation occurred in an urban area and only 38 percent of crashes occurred at intersections.
Table 2. Motorcycle Crash Characteristics
Variable Level Count Percent
0:00 – 2:59 4,460 5.0%
3:00 – 5:59 1,771 2.0%
6:00 – 8:59 4,663 5.2%
9:00 – 11:59 8,433 9.5%
12:00 – 14:59 17,287 19.4%
15:00 – 17:59 24,248 27.2%
18:00 – 20:59 18,717 21.0%
Crash Time
21:00 – 23:59 9,507 10.7%
January 969 1.1%
February 1,481 1.7%
March 3,764 4.2%
April 7,992 9.0%
May 11,323 12.7%
June 12,877 14.5%
July 13,507 15.2%
August 12,636 14.2%
September 11,690 13.1%
October 7,655 8.6%
November 3,774 4.2%
Crash Month
December 1,418 1.6%
Crash Type Single-Vehicle 38,831 43.6%
Multiple Vehicle 50,255 56.4%
Location Rural 22,692 32.1%*
Urban 48,107 67.9%*
Unknown Location 18,287
Intersection-Related Not Intersection 55,043 61.8%
Intersection-Related 34,043 38.2%
*Percentages are calculated based on crashes with known locations.
Vehicle and Operator Characteristics
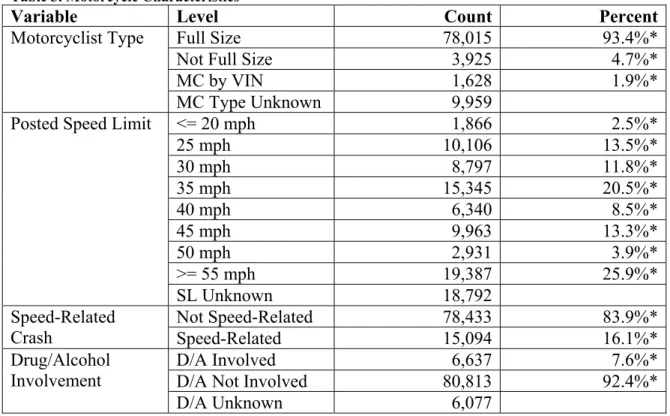
Characteristics of the motorcycles and drivers are displayed in Tables 3 and 4. Over 90 percent of motorcycles were full size. The most common posted speed limits for motorcyclists were > 55 mph and 35 mph. Of the 93,527 motorcycle riders (operators) involved in crashes, 16.1 percent had speed-related crashes and 7.6 percent had alcohol or drug involvement.
Table 3. Motorcycle Characteristics
Variable Level Count Percent
Full Size 78,015 93.4%*
Not Full Size 3,925 4.7%*
MC by VIN 1,628 1.9%*
Motorcyclist Type
MC Type Unknown 9,959
<= 20 mph 1,866 2.5%*
25 mph 10,106 13.5%*
30 mph 8,797 11.8%*
35 mph 15,345 20.5%*
40 mph 6,340 8.5%*
45 mph 9,963 13.3%*
50 mph 2,931 3.9%*
>= 55 mph 19,387 25.9%*
Posted Speed Limit
SL Unknown 18,792
Not Speed-Related 78,433 83.9%*
Speed-Related
Crash Speed-Related 15,094 16.1%*
D/A Involved 6,637 7.6%*
D/A Not Involved 80,813 92.4%*
Drug/Alcohol Involvement
D/A Unknown 6,077
*Percentages are calculated using cases with known values.
Motorcyclist Characteristics
Of the 104,472 motorcyclists in our study, the majority, 92,582 (89%), were identified as being the motorcycle rider (operator) while the remaining 11,890 (11%) were passengers (Table 4). The majority of motorcyclists were male (85%). More motorcyclists were helmeted at the time of the crash than those that were unhelmeted (57 percent versus 43%).
Table 4. Motorcyclist Characteristics
Variable Level Count Percent
Passenger 11,890 11.4%
Motorcyclist Type
Rider (Operator)* 92,582 88.6%
Male 88,267 84.5%
Gender
Female 16,205 15.5%
Helmet Worn 59,299 56.8%
Safety Equipment
Helmet Not Worn 45,173 43.2%
*Despite there being 93,527 motorcycles in the data set only 92,582 motorcyclists were coded as being operators. This discrepancy was present in the data submitted by States and not introduced through linkage or imputation.
Source: CODES, 2003-2005.
The age distribution of motorcyclists in our study is displayed in Figure 2. The largest age group (27%) was motorcyclists in their 20’s, followed by motorcyclists between 40 to 49 years old (22%).
Figure 2. Motorcyclist Age Group
0% 5% 10% 15% 20% 25% 30%
< 20 20 - 29 30 - 39 40 - 49 50 - 59 >= 60
Percent of Motorcyclists
Age Group Source: CODES, 2003-2005.
While male motorcyclists were most likely to be in their early 20’s, female motorcyclists were more likely to be between 40 and 49 years old (Figure 3). Helmet use also differed by age (Figure 4). Helmeted motorcyclists were more likely to be younger compared to unhelmeted motorcyclists. The difference in helmet usage by age may be the result of age-specific helmet laws in some of the CODES States. Helmet use laws by State are shown in Appendix C.
Figure 3. Motorcyclist Age by Gender
0% 5% 10% 15% 20% 25% 30%
< 20 20 - 29 30 - 39 40 - 49 50 - 59 >= 60
Age Group
Males Females
Source: CODES, 2003-2005.
Figure 4. Motorcyclists Age by Helmet Use
Source: CODES, 2003-2005.
Injury Outcomes
Motorcyclists’ injury outcomes are displayed in Table 5. Injury severity for this project was defined using both KABCO from the crash report and linkage outcomes. The
KABCO scale is the traditional injury severity scale used on police crash reports and was explained above on page 14.
Based on police reports, which code an injury as fatal if the death occurs within 30 days of the crash, a total of 3,673 (4%) motorcyclists died following their crash. Only 17 percent of motorcyclists were coded as having no injuries.
The linked CODES data was used to determine the highest level of medical care that a motorcyclist received following the crash. This variable is likely related to the
motorcyclist’s KABCO value but is calculated based solely on the probabilistic linkage results. The results of the State linkages show that while nearly 60 percent of
motorcyclists did not link to a hospital record, 27 percent linked to the emergency
department, and 15 percent were admitted to the hospital. It should be noted that 3 States (Kentucky, Rhode Island, and Virginia) did not submit ED data; therefore the number of motorcyclists treated at the ED is likely an underestimate.
0% 5% 10% 15% 20% 25% 30%
< 20 20 - 29 30 - 39 40 - 49 50 - 59 >= 60
Age Group
Not Helmeted Helmeted
Table 5. Crash Outcomes
K 3,673 3.5%
A 23,750 22.7%
B 38,836 37.2%
C 20,169 19.3%
KABCO*
O 18,042 17.3%
None 61,049 58.4%
ED/Outpatient 28,075 26.9%
Highest Level of Care
Inpatient 15,348 14.7%
*Two motorcyclists were coded as “Died before crash” and are therefore not displayed in the KABCO portion of Table 5.
Source: CODES, 2003-2005.
As in earlier CODES reports, an aggregate injury severity variable was created based on a combination of KABCO and the highest level of care derived from the linkage. Based on these two variables motorcyclists were categorized at one of the five injury levels: Killed – as reported on the police crash report or the discharge status from the hospital file; Admitted to the hospital – crash record linked to a hospital discharge record; Treated at the ED – crash record linked to an emergency department record; Injured – KABCO value of A, B, or C but did not link to a hospital record; and Not Injured – KABCO value of O and did not link to a hospital record. The results are displayed in Table 6. Sixteen percent of all motorcyclists were not injured. Using the definition of death within 30 days of the crash, an additional 63 fatalities not coded as a “K” on the police crash report were identified based on the discharge code from a linked hospital record. While not counted as a fatality in Table 6, an additional 14 fatalities occurred in the hospital more than 30 days post-crash.
Table 6. Injury Status
Injury Status Count Percent
Not Injured 16,504 15.8%
Injured but Not Linked 42,060 40.3%
Treated at ED 27,375 26.2%
Hospitalized 14,796 14.1%
Killed 3,737 3.6%
Source: CODES, 2003-2005.
Hospitalized Motorcyclists
With the linkage of crash reports to hospital records, CODES data can be used to analyze the relationship between crash factors and medical outcomes. For the remainder of this section we limit our analysis to the 43,423 motorcyclists who linked to a hospital (emergency department or inpatient) record. Motorcyclists who died at the scene and were not transported have been excluded.
Figure 5 shows the AIS body region for all hospitalized motorcyclists. Note that since motorcyclists can have multiple injuries, one motorcyclist may appear multiple times in this graph.
Figure 5. AIS Injured Body Region*
0% 25% 50%
AIS Body Region
Percent of Hospitalized Motorcyclists
Head Face Neck Thorax
Abdomen Spine Upper Ext Lower Ext External
*Since a motorcyclist can injure more than one body region, the percentages in Figure 5 add up to more than 100 percent.
Source: CODES, 2003-2005.
The majority of hospitalized motorcyclists’ injuries were to the upper and lower
extremities. Also, more than 15 percent of motorcyclists sustained head injuries and close to 17 percent sustained facial injuries. There were a total of 100 neck injuries.
The MAIS for all hospital-treated motorcyclists is displayed in Table 7. The majority of injuries were classified as minor (18,740, 43%) or moderate (13,755, 32%). There were 31 (0.1%) motorcyclists with injuries classified as maximum and over 700 (2%) more motorcyclists suffered critical injuries.
Table 7. Maximum Abbreviated Injury Scale (MAIS)
MAIS Count Percent
None 2,070 4.8%
Minor 18,740 43.2%
Moderate 13,755 31.7%
Serious 6,000 13.8%
Severe 2,065 4.8%
Critical 762 1.8%
Maximum 31 0.1%
Source: CODES, 2003-2005.
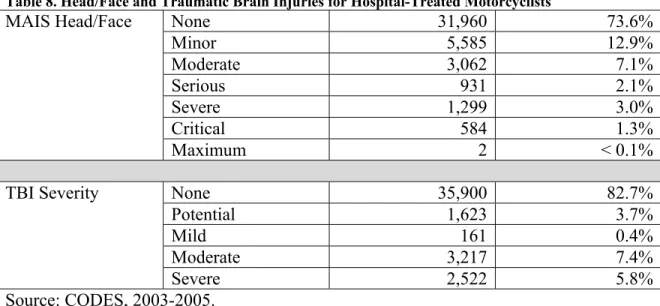
Both head/face MAIS and TBI severity are displayed in Table 8. Since, the definition of TBI contains ICD-9-CM codes corresponding to the head and face MAIS body regions we have created a combined Head/Face body region and the defined the MAIS to be the maximum AIS of the head and face regions.
A total of 7,523 motorcyclists received TBI as a result of their crashes. These injuries were categorized as severe (2,522, or 34%), moderate (3,217, or 43%), minor (161, or 2.1%), and potential (1,623, or 22%). For the remainder of this section TBI categories mild and moderate will be combined, due to the relatively few cases of minor TBI. Table 8. Head/Face and Traumatic Brain Injuries for Hospital-Treated Motorcyclists
None 31,960 73.6%
Minor 5,585 12.9%
Moderate 3,062 7.1%
Serious 931 2.1%
Severe 1,299 3.0%
Critical 584 1.3%
MAIS Head/Face
Maximum 2 < 0.1%
None 35,900 82.7%
Potential 1,623 3.7%
Mild 161 0.4%
Moderate 3,217 7.4%
TBI Severity
Severe 2,522 5.8%
Source: CODES, 2003-2005.
To determine the financial impact of head/facial injuries, we compared the median hospital charges for motorcyclists stratified by severity of head/facial injury and TBI (Table 9). Median hospital charges and their confidence intervals were calculated using the statistical methodology developed in Strashny (2009). Since only two motorcyclists were categorized as having a maximum head/facial injury the maximum and critical injury groups were combined. Motorcyclists who die shortly after arriving at the hospital may incur smaller charges than their injury severity would indicate, therefore the results presented in Table 9 exclude the 924 motorcyclists discharged dead from the hospital.
Table 9. Median Hospital Charges by MAIS Head/Facial and Traumatic Brain Injury Severity*
MAIS Head/Facial Injury Severity
Number of
Motorcyclists Hospital Median Charges
95% LCL 95% UCL
No Head/Facial Injury
31,543 $2,285 $2,230 $2,341
Minor 5,534 $3,786 $3,628 $3,949
Moderate 3,023 $10,205 $9,701 $10,736
Serious 906 $25,430 $23,418 $27,614
Severe 1,236 $32,954 $30,718 $35,354
Critical - Maximum
257 $73,179 $60,316 $88,784
TBI Severity Number of
Motorcyclists
Median Hospital Charges
95% LCL 95% UCL
None 35,477 $2,461 $2,406 $2,518
Potential 1,550 $3,296 $3,085 $3,522
Mild/Moderate 3,342 $9,792 $9,355 $10,249
Severe 2,130 $31,979 $30,090 $33,986
*Hospital charges have been adjusted to year 2005 dollars.
Source: CODES, 2003-2005.
As the severity of the head/facial injury increases the median of hospital charges increases 32 fold. The median of hospital charges for motorcyclists without a head or facial injury was $2,285 while a motorcyclist with an AIS head injury of 5 or 6 had median hospital charges of $73,179. Similarly, median hospital charges increase with TBI severity. Motorcyclists without TBI have a median hospital charge of $2,461 while motorcyclists with severe TBI have a median hospital charge of $31,979.
The majority of hospital-treated motorcyclists were discharged home (Figure 6). While over 80 percent of motorcyclists with no, potential, mild, and moderate TBIs were discharged home, only 56 percent of motorcyclists with severe TBI were similarly discharged.
Figure 6. Percent of Motorcyclists Discharged Home by TBI Severity
0% 50% 100%
None Potential Mild Moderate Severe
TBI Severity
Percent of Motorcyclists in TBI Group
Source: CODES, 2003-2005.
All remaining discharge statuses are presented in Figure 7. Motorcyclists who received a TBI were also more likely to be discharged from the hospital dead or transferred to rehab or a long-term care facility. While over 85 percent of motorcyclists without TBI were discharged home, this percent drops to 56 percent for motorcyclists with severe TBI. Additionally, while only 17 percent of all motorcyclists had TBI, motorcyclists with TBIs accounted for 54 percent of all riders discharged dead.
Figure 7. Discharge Status by TBI Severity
0% 10% 20% 30%
None Potential Mild Moderate Severe
TBI Severity
Against Medical Advice Dead Long Term Care Rehab
Percent of Motorcyclists in TBI Group
*There were a total of 14 motorcyclists in the discharged dead category whose death occurred at least 31 days following the crash.
Source: CODES, 2003-2005.
Injury Outcomes by Motorcycle Helmet Use
To determine the impact of motorcycle helmets on injury outcomes we further examined hospital outcomes by whether or not a motorcyclist was wearing a helmet at the time of the crash. Figure 8 displays the body area of injury by helmet use. Upper and lower extremities were the most commonly injured body regions for both groups of motorcyclists. However, unhelmeted motorcyclists experienced nearly twice the percentage of head and face injuries that helmeted motorcyclists did. While only 12 percent of hospital-treated helmeted motorcyclists experienced head injuries, 20 percent of hospital-treated unhelmeted motorcyclists incurred such injuries. Similarly, 13 percent of hospital-treated helmeted motorcyclists received face injuries compared to 22 percent of hospital-treated unhelmeted motorcyclists.
Figure 8. AIS Body Region by Helmet Use*
0% 25% 50%
AIS Body Region
No Helmet Helmet
Percent of Hospitalized Motorcyclists
in Helmet Use Group
Head Face Neck Thorax
Abdomen SpineUpper ExtLower Ext External
*Since a motorcyclist can injure more than one body region, the percentages in Figure 8 add up to more than 100 percent.
Source: CODES, 2003-2005. Injury Severity by Helmet Use
Table 10 examines the MAIS severity level for the head and facial injuries. As seen in Figure 8, 20 percent of unhelmeted motorcyclists received head injuries compared to only 12 percent of helmeted motorcyclists. Additionally, head injuries to unhelmeted
motorcyclists appear to be more severe than those sustained by helmeted motorcyclists. Eight and one-half (8.5) percent of unhelmeted motorcyclists sustained head MAIS of three or higher. This compares to 5.1 percent of helmeted motorcyclists.
Table 10. Helmet Use by MAIS Head/Facial Injury Severity
Head Injury Severity Helmet Not Used Helmet Used
No Head Injury 14,511 (80.2%) 22,266 (87.9%)
Minor 824 (4.6%) 262 (1.0%)
Moderate 1,220 (6.7%) 1,526 (6.0%)
Serious 517 (2.9%) 412 (1.6%)
Severe 693 (3.8%) 606 (2.4%)
Critical 322 (1.8%) 262 (1.0%)
Maximum - 2 (< 0.1%)
Facial Injury Severity Helmet Not Used Helmet Used
No Face Injury 14,059 (77.7%) 22,014 (86.9%)
Minor 3,561 (19.7%) 2,881 (11.4%)
Moderate 464 (2.6%) 439 (1.7%)
Serious 3 (0.0%) 2 (0.0%)
Severe -
-Critical -
-Maximum -
-Source: CODES, 2003-2005.
There was not much difference in severity levels between unhelmeted and helmeted motorcyclists for the MAIS trunk body regions (Table 11). Additionally, there were few neck injuries in either group, 35 and 66 for unhelmeted and helmeted respectively.
Table 11. Helmet Use by MAIS Trunk Body Regions Injury Severity
Neck Injury Severity Helmet Not Used Helmet Used
No Neck Injury 18,051 (99.8%) 25,271 (99.7%)
Minor 28 (0.2%) 47 (0.2%)
Moderate 2 (0.0%) 4 (0.0%)
Serious 6 (0.0%) 14 (0.1%)
Severe -
-Critical -
-Maximum -
-Thorax Injury Severity Helmet Not Used Helmet Used
No Thorax Injury 15,598 (86.2%) 21,176 (83.6%)
Minor 819 (4.5%) 1,300 (5.1%)
Moderate 362 (2.0%) 601 (2.4%)
Serious 1,073 (5.9%) 1,807 (7.1%)
Severe 227 (1.3%) 434 (1.7%)
Critical 2 (0.0%) 0 (0.0%)
Maximum 6 (0.0%) 18 (0.1%)
Abdomen Injury Severity Helmet Not Used Helmet Used
No Abdomen Injury 16,595 (91.8%) 23,011 (90.8%)
Minor 845 (4.7%) 1,181 (4.7%)
Moderate 487 (2.7%) 796 (3.1%)
Serious 48 (0.3%) 100 (0.4%)
Severe 68 (0.4%) 143 (0.6%)
Critical 44 (0.2%) 105 (0.4%)
Maximum -
-Spine Injury Severity Helmet Not Used Helmet Used
No Spine Injury 15,899 (87.9%) 22,131 (87.4%)
Minor 1,188 (6.6%) 1,678 (6.6%)
Moderate 902 (5.0%) 1,367 (5.4%)
Serious 48 (0.3%) 90 (0.4%)
Severe 25 (0.1%) 33 (0.1%)
Critical 24 (0.1%) 33 (0.1%)
Maximum 1 (0.0%) 4 (0.0%)
Extremity injury severity by helmet use is provided in Table 12. As seen in Figure 7, helmeted motorcyclists had more upper and lower extremity injuries. However, all but a few of these were categorized as minor or moderate.
Table 12. Helmet Use by MAIS Extremity Injury Severity
Upper Extremity Injury
Severity Helmet Not Used Helmet Used
No Upper Extremity Injury
11,445 (63.3%) 14,727 (58.1%)
Minor 3,376 (18.7%) 4,839 (19.1%)
Moderate 3,039 (16.8%) 5,269 (20.8%)
Serious 227 (1.3%) 501 (2.0%)
Severe -
-Critical -
-Maximum -
-Lower Extremity Injury Severity
Helmet Not Used Helmet Used
No Lower Extremity Injury
10,469 (57.9%) 13,753 (54.3%)
Minor 3,506 (19.4%) 5,401 (21.3%)
Moderate 2,762 (15.3%) 4,158 (16.4%)
Serious 1,333 (7.4%) 2,004 (7.9%)
Severe 17 (0.1%) 20 (0.1%)
Critical -
-Maximum -
-Source: CODES, 2003-2005.
No differences were noted in the number and severity level of external injuries between unhelmeted and helmeted motorcyclists (Table 13).
Table 13. Helmet Use by MAIS External Injury Severity
External Injury Severity Helmet Not Used Helmet Used
No External Injury 13,513 (74.7%) 19,280 (76.1%)
Minor 4,547 (25.1%) 6,021 (23.8%)
Moderate 21 (0.1%) 28 (0.1%)
Serious 6 (0.0%) 6 (0.0%)
Severe -
-Critical - 1 (0.0%)
Maximum -
Table 14 shows that unhelmeted motorcyclists were more likely to receive TBI than helmeted riders. Over 8 percent of unhelmeted motorcyclists received mild to moderate TBI and an additional 7.3 percent received severe TBI. This compares to 7.0 percent and 4.7 percent for moderate and severe TBIs for helmeted riders.
Table 14. Helmet Use by TBI Severity
TBI Severity Helmet Not Used Helmet Used
No TBI 14,242 (78.7%) 21,658 (85.5%)
Potential TBI 912 (5.0%) 711 (2.8%)
Mild/Moderate TBI 1,607 (8.9%) 1,771 (7.0%)
Severe TBI 1,326 (7.3%) 1,196 (4.7%)
Source: CODES, 2003-2005.
Effectiveness of Motorcycle Helmets
The overrepresentation of facial, head, and traumatic brain injuries in the unhelmeted population led us to estimate the effectiveness of motorcycle helmets at preventing these injuries. In the following section we present both unadjusted and adjusted effectiveness estimates.
Unadjusted effectiveness estimates were generated by calculating the relative risk for a given outcome from a two-by-two table of the outcome (yes or no) versus motorcycle helmet use (yes or no). The effectiveness is then estimated to be 1 – the relative risk. Unadjusted effectiveness estimates may be incomplete because they do not account for other variables that might be associated with the outcome, for example speed limit or alcohol and drug involvement. Therefore, logistic regression models were employed. Additionally, generalized estimating equations were incorporated to account for
clustering of observations within States. The same explanatory variables were used in the logistic regression models for all outcomes. In addition to helmet use, other covariates were gender, age, whether the crash was speed-related, whether alcohol or drugs were involved in the crash, whether the crash was intersection-related, type of motorcyclist (motorcycle rider [operator] versus motorcycle passenger), number of vehicles involved in the crash (single versus multiple), whether the crash occurred at night (9 p.m. to 5:59 a.m.), and posted speed limit. A detailed explanation of variables collected for this analysis can be found in Appendix A. Additionally, as found in a prior NHTSA
motorcycle study (Pickrell & Starnes, 2008), a significant interaction between helmet use and number of vehicles was included. Due to this interaction, the results of the logistic regressions are presented separately for single-vehicle and multiple-vehicle crashes. Finally, it is assumed that nonfatal and non-hospital-treated motorcyclists did not
experience the outcome of interest. For motorcyclists who died at the scene and were not transported, it is unknown whether they sustained the outcome of interest and they are therefore excluded from the analysis.
Facial Injury
There were 7,350 facial injuries sustained by motorcyclists in our data (Table 15). As seen above, facial injuries were more common for unhelmeted motorcyclists compared to helmeted motorcyclists (9.2% versus 5.7%). This data provides an unadjusted estimate that motorcycle helmets are 37 percent effective at preventing facial injuries.
Table 15. Percent of Motorcyclists in Helmet Use Category by Facial Injury
Helmet Not Used Helmet Used
No Facial Injury 39,955 (90.8%) 54,682 (94.3%)
Facial Injury 4,028 (9.2%) 3,322 (5.7%)
Source: CODES, 2003-2005.
Table 16 shows the results of the multivariable logistic regression with facial injury as the outcome. The confidence intervals for being a male motorcyclist, type of motorcyclists, and intersection-related crash all contain 1.0. This indicates that these variables are not related to whether motorcyclists incur a facial injury. An increase of one year in age is associated with an increase of 1.01 in the odds of receiving a facial injury. By
comparison an increase in age of 10 years is associated with an increase of 1.1 in the odds of receiving a facial injury. An increase in the speed limit is also associated with an increase in the odds of receiving a facial injury. An increase of 5 miles per hour, on average, increases the odds of a facial injury by 1.04. Compared to daytime crashes, motorcycle crashes that occur at night are associated with an increase of 1.1 in the odds of a facial injury, on average. Alcohol and speed involvement both had more dramatic impacts on the odds of a facial injury. Motorcyclists in alcohol- or drug-related crashes are 1.7 times more likely to receive a facial injury compared to motorcyclists in non-alcohol and non-drug-related crashes. Speed-related crashes are also associated with higher odds of a facial injury (OR = 1.3).
The interaction between helmet use and single-versus multiple-vehicle crashes is
displayed in the bottom two rows of Table 16. In both single-vehicle and multiple-vehicle crashes, helmeted motorcyclists have lower odds of receiving facial injuries compared to unhelmeted motorcyclists. In single-vehicle crashes helmeted motorcyclists are half as likely to receive a facial injury compared to unhelmeted motorcyclists. Motorcyclists in multiple-vehicle crashes are 66 percent as likely to receive a facial injury as unhelmeted motorcyclists. Using the logistic model we estimate motorcycle helmets to be 48 percent effective at preventing facial injuries in single-vehicle crashes and 34 percent effective at preventing facial injuries in multiple-vehicle crashes.
Table 16. Logistic Regression Results Predicting Facial Injury
Parameter Estimate Odds Ratio 95% LCL 95% UCL
Intercept -3.317
Male 0.036 1.037 0.951 1.130
Age 0.011 1.011 1.008 1.013
Speed-Related 0.248 1.281 1.188 1.381
Alcohol/Drug Involvement
0.536 1.708 1.552 1.881
Intersection 0.016 1.016 0.948 1.089
Rider (Operator) 0.044 1.045 0.945 1.155
Nighttime 0.112 1.118 1.044 1.199
Speed Limit 0.007 1.007 1.005 1.010
Helmet AND Single Vehicle
-0.652 0.521 0.477 0.569
Helmet AND Multiple Vehicle
-0.421 0.656 0.595 0.724
Source: CODES, 2003-2005.
Head Injury
As can be seen in Table 17, a total of 6,646 motorcyclists suffered head injury as a result of their crashes. Close to double the percent of unhelmeted motorcyclists (8.1%) suffered head injury compared to the percentage of helmeted motorcyclists (5.3%) suffering a head injury. Thus, motorcycle helmets are estimated to be 35 percent effective at preventing head injuries.
Table 17. Percent of Motorcyclists in Helmet Use Category by Head Injury
Helmet Not Used Helmet Used
No Head Injury 40,408 (91.9%) 54,933 (94.7%)
Head Injury 3,575 (8.1%) 3,071(5.3%)
Source: CODES, 2003-2005.
Table 18 shows the results of the multivariable logistic regression with head injury as the outcome. The confidence intervals for type of motorcyclist and intersection-related crash both contain 1.0, indicating that these variables are not-related to whether motorcyclists incur a head injury. An increase of one year in age is associated with an increase of 1.01 in the odds of receiving a head injury. By comparison an increase in age of 10 years is associated with an increase of 1.1 in the odds of receiving a head injury. Higher speed limits are associated with increased odds of receiving a head injury. An increase in the speed limit of 5 miles per hour, on average, increases the odds of a head injury by 1.1. Compared to daytime crashes, motorcycle crashes that occur at night are associated with an increase of 1.1 in the odds of a head injury, on average. Motorcyclists in alcohol- or drug-related crashes are 2.0 times more likely to receive head injury compared to
motorcyclists in non-alcohol and non-drug-related crashes. Speed-related crashes are also associated with higher odds of head injury (OR = 1.5).
Helmets reduced the odds of sustaining head injury in both single- and multiple-vehicle crashes. Helmeted motorcyclists in single-vehicle crashes had half the odds of receiving head injury compared to unhelmeted motorcyclists in single-vehicle crashes. In multiple-vehicle crashes, helmeted motorcyclists had 67 percent of the odds of sustaining head injury compared to unhelmeted motorcyclists. From the logistic model we estimate that helmets are 48 percent effective at preventing head injuries in single-vehicle crashes and 33 percent effective at preventing head injuries in multiple-vehicle crashes.
Table 18. Logistic Regression Results Predicting Head Injury
Parameter Estimate Odds Ratio 95% LCL 95% UCL
Intercept -3.362
Male 0.199 1.220 1.112 1.338
Age 0.005 1.005 1.003 1.007
Speed-Related 0.426 1.531 1.419 1.652
Alcohol/Drug
Involvement 0.707 2.028 1.844 2.231
Intersection 0.063 1.065 0.994 1.141
Rider (Operator) 0.014 1.014 0.914 1.126
Nighttime 0.127 1.135 1.056 1.221
Speed Limit 0.010 1.010 1.007 1.012
Helmet AND Single Vehicle
-0.657 0.519 0.473 0.568
Helmet AND Multiple Vehicle
-0.397 0.673 0.611 0.740
Source: CODES, 2003-2005.
Moderate to Severe Head and Facial Injuries
In order to determine if helmets are only effective at preventing minor injuries, we furthered explored the relationship between helmet use and head and facial body regions. For this model we defined moderate to severe head or face injuries to be those having an MAIS head or face body region score of 2 or higher. There were a total of 5,878
motorcyclists that survived to hospital admission and suffered a moderate to severe head or facial injury (Table 19). Table 19 provides an unadjusted estimate that helmets are 22 percent effective at preventing moderate to severe head and facial injuries.
Table 19. Percent of Motorcyclists in Helmet Use Group by Moderate to Severe Head/Facial Injury
Helmet Not Used Helmet Used
No Moderate to Severe Head/Face Injury
41,079 (93.4%) 55,030 (94.9%) Moderate to Severe
Head/Face Injury
2,904 (6.6%) 2,974 (5.1%)
Source: CODES, 2003-2005.
As in the head and facial injury models above, both alcohol and drug involvement and speed-related crashes are more likely to be associated with moderate to severe head or facial injuries (Table 20). Also, as before, helmets reduce the odds of moderate to severe head or facial injuries in single-vehicle crashes (OR = 0.61) and multiple-vehicle crashes (OR = 0.78). Thus we estimate from our model that helmets are 40 percent effective at preventing moderate to severe head or facial injuries in single-vehicle crashes and 22 percent effective at preventing moderate to severe head or facial injuries in multiple-vehicle crashes.
Table 20. Logistic Regression Results Predicting Moderate to Severe Head or Facial Injury
Parameter Estimate Odds Ratio 95% LCL 95% UCL
Intercept -3.550
Male 0.212 1.236 1.117 1.366
Age 0.005 1.005 1.003 1.007
Speed-Related 0.466 1.594 1.469 1.730
Alcohol/Drug
Involvement 0.767 2.153 1.940 2.388
Intersection 0.053 1.054 0.980 1.134
Rider (Operator) -0.007 0.994 0.888 1.112
Nighttime 0.113 1.119 1.038 1.207
Speed Limit 0.009 1.009 1.006 1.011
Helmet AND Single Vehicle
-0.503 0.605 0.550 0.664
Helmet AND Multiple Vehicle
-0.248 0.780 0.709 0.858
Source: CODES, 2003-2005.
Traumatic Brain Injury
In order estimate the effectiveness of helmets at preventing potential and unequivocal TBI, we grouped motorcyclists having any severity of TBI as well as those with potential TBI into the TBI = “yes” group. All other motorcyclists were coded as TBI = “no”. The results are displayed in Table 21.
Table 21. TBI Status by Helmet Use Group
Helmet Not Used Helmet Used
No TBI 40,138 (91.3%) 54,326 (93.7%)
TBI 3,845 (8.7%) 3,678 (6.3%)
Source: CODES, 2003-2005.
Table 21 shows that the probability of receiving a TBI following a motorcycle crash is 0.087 for unhelmeted motorcyclists compared to only 0.063 for helmeted motorcyclists. These two estimates provide a risk ratio of 0.73, indicating that motorcycle helmets are 27 percent effective at preventing traumatic brain injury.
Table 22 shows that confidence intervals of the odds ratios for age, type of motorcyclist, and intersection-related crash contain the value of 1.0. This indicates that these variables are not related to whether motorcyclists incur TBI. An increase of 5 miles per hour, on average, increases the odds of TBI by 1.04. Compared to daytime crashes, motorcycle crashes that occur at night are associated with an increase of 1.1 in the odds of TBI, on average. Motorcyclists in alcohol or drug-related crashes are 2.0 times more likely to receive a TBI compared to motorcyclists in non-alcohol and non-drug-related crashes. Speed-related crashes are also associated with higher odds of TBI (OR = 1.5).
Helmets significantly reduced the odds of TBI in both single-and multiple-vehicle crashes. In single-vehicle crashes, helmeted motorcyclists had just under 60 percent of the odds of TBI compared to unhelmeted motorcyclists. For multiple-vehicle crashes, helmeted motorcyclists had 76 percent of the odds of unhelmeted motorcyclists for sustaining TBI. Using the logistic model we can estimate the effectiveness of motorcycle helmets at preventing TBI to be 41 percent for single-vehicle crashes and 25 percent for multiple-vehicle crashes.
Table 22. Logistic Regression Results Predicting Traumatic Brain Injury
Parameter Estimate Odds Ratio 95% LCL 95% UCL
Intercept -3.116
Male 0.128 1.136 1.038 1.244
Age 0.002 1.002 1.000 1.004
Speed-Related 0.387 1.473 1.370 1.585
Alcohol/Drug
Involvement 0.711 2.037 1.854 2.238
Intersection 0.044 1.045 0.979 1.115
Rider (Operator) 0.049 1.051 0.945 1.168
Nighttime 0.099 1.105 1.030 1.184
Speed Limit 0.008 1.008 1.006 1.010
Helmet AND Single Vehicle
-0.528 0.590 0.541 0.642
Helmet AND Multiple Vehicle
-0.281 0.755 0.691 0.825
Source: CODES, 2003-2005.
CONCLUSIONS
This report examines factors associated with motorcycle crash outcomes using CODES data supplied by 18 States. Of particular interest to this report were injuries that may have been preventable by motorcycle helmet use. These outcomes include head/facial injuries and traumatic brain injuries. CODES data consists of Statewide crash databases
probabilistically linked to Statewide emergency department and hospital admission data. These properties make CODES data particularly ideal for identifying specific medical injuries through the use of ICD-9-CM codes and AIS mapping.
Helmeted motorcyclists were less likely to experience facial and head injuries compared to unhelmeted motorcyclists. Helmeted motorcyclists were significantly less likely to experience TBI. TBIs are of particular concern in our study. TBI was associated with significantly higher hospital charges. Additionally, motorcyclists with TBI were much less likely to be discharged home and more likely to require rehab or to be discharged to long-term care facilities following their hospitalizations. Both destinations are likely to result in costs and burdens for the injured motorcyclists beyond the scope of this study’s data. Finally, motorcyclists involved in alcohol- or drug-related crashes and speed-related crashes had higher odds of experiencing poor outcomes.
It is important to note that the State crash databases used in the CODES combined analysis did not identify whether the individual motorcycle helmets involved in fatal crashes comply with DOT regulations. The National Occupant Protection Use Survey (NOPUS), a national probability-based sample survey, estimated that 48 percent of
Although CODES data from 18 States cannot be considered a representative sample of all motorcycle crashes in the United States for generating national counts or estimates, as a census of 48 State-years of reported motorcycle crashes, this data provides very large numbers of helmeted and unhelmeted motorcyclists for which it is possible to make useful comparisons and study rare outcomes. This study also provides a useful
demonstration of how data from multiple States can be combined for research purposes. Methods initiated for this study can be further developed for future specialized studies of crash outcomes using pooled CODES data.
APPENDIX A
Specifications for the standardized CODES motorcycle data submission
Data Element Values Definitions
Dataset name:
Inclusion criteria: riders (operators) and passengers of vehicles denoted as motored cycles (SEE ADDENDUM 1 FOR DEFINITIONS)
GENERIC
VARIABLES Apply to all observations
State State identifier 2-character State abbreviation for your State Year of Linked Data 4-digit year
Imputation Number 1-5 Imputation data set identifier 1-5 CRASH LEVEL
VARIABLES
Assign these crash characteristics to all MC operators and riders in the crash. Crash ID Number As provided or
generated
Unique ID number for the crash. For added confidentiality this number should be generated by CODES personnel rather than drawn from State crash data ID. It should uniquely identify a crash within the data set. Crash Time The three-hour time
block in which crash occurred
00:00-02:59, 03:00-05:59, 06:00-8:59, 09:00-11:59, 12:00-14:59 15:00-17:59, 18:00-20:59, 21:00-23:59 Crash Month The month in which the
crash occurred Jan-Dec Crash Type Single vehicle versus
multiple vehicle
As reported on the crash report. A multiple-vehicle crash includes collisions of multiple motor vehicles in transport. For motorcycle model, the other vehicle does not have to be another motorcycle. A single-vehicle crash includes all other types of crashes.
Rural/Urban Crash Location
Rural/Urban Rural: FHWA Highway Performance Monitoring System (HPMS) definition of rural (excludes small local roads); rural defined as <5,000 population. Urban: All other not defined as HPMS rural including HPMS large central metro, large fringe metro, small metro
Intersection-Related Intersection-Related versus
Not Intersection-Related
Location of the crash next to an intersection and results from an action related to the movement of traffic units through the intersection. On-ramps and off-On-ramps should not be treated as intersections. Posted Speed Limit As reported Missing values will be imputed as continuous variable
VEHICLE LEVEL VARIABLES
Assign these vehicle or driver characteristics to all MC operators and riders on the cycle.
Vehicle Number As provided or generated
ID number for uniquely identifying vehicles within a crash. For added confidentiality this number may be generated by CODES personnel rather than drawn from State crash data ID.
PAR-Reported Motorcycle Body Type
Full size/Not full size (SEE ADDENDUM 1 FOR DEFINITIONS Operator Impaired Operator Impaired
versus
Operator Not Impaired
The “impaired operator” indicator is “yes” if the MC operator was suspected of being under the influence/using alcohol or drugs as documented on the crash record under Driver Condition, Driver Contributing Factor, BAC level, etc. Does not include operators who are only impaired by fatigue or other non-alcohol, non-drug factors. For riders, this indicator refers to the operator, not the rider.
Operator Licensed for Motorcycle
Operator licensed for motorcycle versus Operator not licensed for motorcycle
Derive from available variables for license type and endorsement.
Speeding Vehicle was speeding versus Not speeding
Driver contributing factor or presence from State crash data: Use Speed-Related, Too Fast for Conditions, or similar PAR-reported attribute. Code by vehicle for each occupant.