CRUDE OIL
Uncertainty about
Future Oil Supply
Makes It Important to
Develop a Strategy for
Addressing a Peak and
Decline in Oil
Production
February 2007
What GAO Found
Why GAO Did This Study
Production
The U.S. economy depends heavily on oil, particularly in the
transportation sector. World oil production has been running at near capacity to meet demand, pushing prices upward. Concerns about meeting increasing demand with finite resources have renewed interest in an old question: How long can the oil supply expand before reaching a maximum level of production—a peak—from which it can only decline?
GAO (1) examined when oil production could peak, (2) assessed the potential for transportation technologies to mitigate the consequences of a peak in oil production, and
(3) examined federal agency efforts that could reduce uncertainty about the timing of a peak or mitigate the consequences. To address these objectives, GAO reviewed studies, convened an expert panel, and consulted agency officials.
What GAO Recommends
To better prepare for a peak in oil production, GAO recommends that the Secretary of Energy work with other agencies to establish a strategy to coordinate and
prioritize federal agency efforts to reduce uncertainty about the likely timing of a peak and to advise Congress on how best to mitigate consequences. In commenting on a draft of the report, the
Departments of Energy and the Interior generally agreed with the report and recommendations.
Most studies estimate that oil production will peak sometime between now and 2040. This range of estimates is wide because the timing of the peak depends on multiple, uncertain factors that will help determine how quickly the oil remaining in the ground is used, including the amount of oil still in the ground; how much of that oil can ultimately be produced given
technological, cost, and environmental challenges as well as potentially unfavorable political and investment conditions in some countries where oil is located; and future global demand for oil. Demand for oil will, in turn, be influenced by global economic growth and may be affected by government policies on the environment and climate change and consumer choices about conservation.
In the United States, alternative fuels and transportation technologies face challenges that could impede their ability to mitigate the consequences of a peak and decline in oil production, unless sufficient time and effort are brought to bear. For example, although corn ethanol production is
technically feasible, it is more expensive to produce than gasoline and will require costly investments in infrastructure, such as pipelines and storage tanks, before it can become widely available as a primary fuel. Key alternative technologies currently supply the equivalent of only about 1 percent of U.S. consumption of petroleum products, and the Department of Energy (DOE) projects that even by 2015, they could displace only the equivalent of 4 percent of projected U.S. annual consumption. In such circumstances, an imminent peak and sharp decline in oil production could cause a worldwide recession. If the peak is delayed, however, these
technologies have a greater potential to mitigate the consequences. DOE projects that the technologies could displace up to 34 percent of U.S. consumption in the 2025 through 2030 time frame, if the challenges are met. The level of effort dedicated to overcoming challenges will depend in part on sustained high oil prices to encourage sufficient investment in and demand for alternatives.
Federal agency efforts that could reduce uncertainty about the timing of peak oil production or mitigate its consequences are spread across multiple agencies and are generally not focused explicitly on peak oil. Federally sponsored studies have expressed concern over the potential for a peak, and agency officials have identified actions that could be taken to address this issue. For example, DOE and United States Geological Survey officials said uncertainty about the peak’s timing could be reduced through better information about worldwide demand and supply, and agency officials said they could step up efforts to promote alternative fuels and transportation technologies. However, there is no coordinated federal strategy for reducing uncertainty about the peak’s timing or mitigating its consequences.
www.gao.gov/cgi-bin/getrpt?GAO-07-283. To view the full product, including the scope and methodology, click on the link above.
Letter
1Results in Brief 4
Background 6 Timing of Peak Oil Production Depends on Uncertain Factors 12
Alternative Transportation Technologies Face Challenges in
Mitigating the Consequences of the Peak and Decline 29 Federal Agencies Do Not Have a Coordinated Strategy to Address
Peak Oil Issues 35
Conclusions 38
Recommendation for Executive Action 39
Agency Comments and Our Evaluation 40
Appendix I
Scope and Methodology
43Appendix II
Key Peak Oil Studies
47Appendix III
Key Technologies to Enhance the Supply of Oil
49Enhanced Oil Recovery 49
Deepwater and Ultra-Deepwater Drilling 50
Oil Sands 52
Heavy and Extra-Heavy Oils 53
Oil Shale 54
Appendix IV
Key Technologies to Displace Oil Consumption in the
Transportation Sector
57Ethanol 57 Biodiesel 58
Coal and Biomass Gas-to-Liquids 60
Natural Gas 61
Advanced Vehicle Technologies 63
Hydrogen Fuel Cell Vehicles 65
Appendix V
Comments from the Department of Energy
67Appendix VI
Comments from the Department of the Interior
72GAO Comments 75
Appendix VII
GAO Contact and Staff Acknowledgments
76Figures
Figure 1: U.S. Oil Production, 1900-2005 8
Figure 2: World Crude Oil and Other Liquids Production, 1965-2005 9 Figure 3: Annual U.S. Oil Consumption, by Sector, 1974-2005 10
Figure 4: Real and Nominal Oil Prices, 1950-2006 11
Figure 5: Key Estimates of the Timing of Peak Oil 13
Figure 6: World Oil Reserves, OPEC and non-OPEC, 2006 16 Figure 7: Worldwide Proven Oil Reserves, by Political Risk 22 Figure 8: Worldwide Proven Oil Reserves, by Investment Risk 24 Figure 9: Top 10 Companies on the Basis of Oil Production and
Reserves Holdings, 2004 25
Figure 10: World Oil Production, by OPEC and Non-OPEC
Countries, 2004 Projected to 2030 26
Figure 11: Daily World Oil Consumption, by Region for 2003 and
Abbreviations
CO2 carbon dioxide
DOE Department of Energy
DOT Department of Transportation EIA Energy Information Administration EOR enhanced oil recovery
GDP gross domestic product GTL gas to liquids
IEA International Energy Agency
OECD Organization for Economic Co-operation and Development OPEC Organization of the Petroleum Exporting Countries
USDA United States Department of Agriculture USGS United States Geological Survey
This is a work of the U.S. government and is not subject to copyright protection in the United States. It may be reproduced and distributed in its entirety without further permission from GAO. However, because this work may contain copyrighted images or other material, permission from the copyright holder may be necessary if you wish to reproduce this material separately.
February 28, 2007
The Honorable Bart Gordon Chairman
Committee on Science and Technology House of Representatives
The Honorable Roscoe G. Bartlett The Honorable Judy Biggert The Honorable Wayne T. Gilchrest The Honorable Vernon J. Ehlers The Honorable Lynn C. Woolsey House of Representatives
U.S. consumers paid $38 billion more for gasoline in the first 6 months of 2006 than they paid in the same period of 2005, and $57 billion more than they paid in the same period of 2004, in large part because of rising oil prices, which reached a 24-year high in 2006 when adjusted for inflation. Oil is a global commodity, and its price is determined mainly by the balance between world demand and supply. Since 1983, world consumption of petroleum products has grown fairly steadily. The Department of Energy’s (DOE) Energy Information Administration (EIA) states in a 2006 report that world consumption of petroleum had reached 84 million barrels per day in 2005.1
EIA also projects that world oil consumption will continue to grow and will reach 118 million barrels per day in 2030.2
About 43 percent of this growth in oil consumption will come from the non-Organization for Economic Co-operation and Development Asian countries, including China and India, but the United States will remain the world’s largest oil consumer. In 2005, the United States accounted for just under 25 percent of world oil consumption. World oil
1
This number comes from EIA’s Monthly Energy Review (December 2006), table 11.2. EIA labels this table as petroleum consumption, but DOE pointed out in its comments that the consumption data include some ethanol, which is not a petroleum product. EIA staff told us that the ethanol in the 2005 figure amounts to 265,000 barrels per day, amounting to just under one-third of 1 percent of world consumption.
2
This projection comes from EIA’s International Energy Outlook 2006 and reflects assumptions used in EIA’s reference case scenario. To assess uncertainties in the reference case projections, EIA also runs low and high oil price scenarios, in which the projected world oil consumption in 2030 is 102 million and 128 million barrels per day, respectively.
production has been running at near capacity in recent years to meet rising consumption, putting upward pressure on oil prices. The potential for disruptions in key oil-producing regions of the world, such as the Middle East, and the yearly threat of hurricanes in the Gulf of Mexico have also exerted upward pressure on oil prices. These conditions have
renewed interest in a long-standing question: Will oil supply continue to expand to meet growing demand, or will we soon reach a maximum possible level of production—a peak—beyond which oil supply can only decline?
Historically, U.S. oil production peaked around 1970 at close to 10 million barrels per day and has been generally declining ever since, to about 5 million barrels per day in 2005. While recent discoveries raise the prospect of some increases in U.S. oil production, significant reductions in world oil production could still have important consequences for the nation’s
welfare. The United States imported about 66 percent of its oil and petroleum products in 2005, and the U.S. economy—particularly the transportation sector—depends heavily on oil. Overall, transportation accounts for approximately 65 percent of U.S. oil consumption. New technologies have been introduced that displace some oil consumption within the sector, but oil consumption for transportation has continued to increase in recent years. According to a 2005 report prepared for DOE, without timely preparation, a reduction in world oil production could cause transportation fuel shortages that would translate into significant economic hardship.3
The U.S. government addresses or examines world oil supply in several ways. For example, DOE is responsible for promoting the nation’s energy security through reliable and affordable energy, including oil. DOE supports development of technologies for producing and using oil and for making alternative fuels, such as ethanol or hydrogen. The department also publishes statistics on energy production and consumption through EIA. In addition, the United States Geological Survey (USGS), within the Department of the Interior (Interior), assesses the amount of oil
throughout the world. The United States also is a member of the International Energy Agency (IEA), an organization of 26 member countries whose objectives include coping with disruptions in the oil
3
Robert L. Hirsch, Roger Bezdek, and Robert Wendling, Peaking of World Oil Production: Impacts, Mitigation, and Risk Management (February 2005).
supply and providing information on the international oil market, among other things.4
In this context, we (1) examined when oil production could peak, (2) assessed the potential for transportation technologies to mitigate the consequences of a peak and decline in oil production, and (3) examined federal agency efforts that could reduce uncertainty about the timing of peak oil production or mitigate the consequences.
In conducting our work, we identified and reviewed key studies on when oil production will peak. We reviewed estimates of the amount of oil throughout the world and the amount of oil held by national oil
companies, and we analyzed forecasts of political and investment risks in oil-producing regions. To assess the potential for transportation
technologies in the United States to mitigate the consequences of a peak and decline in oil production, we examined options to develop alternative fuels and technologies to reduce energy consumption in the transportation sector. In particular, we focused on technologies that would affect
automobiles and light trucks. We consulted with experts to devise a list of key technologies in these areas and then reviewed DOE programs and activities related to developing these technologies. We did not attempt to comprehensively list all technologies or to conduct a governmentwide review of all programs, and we limited our scope to what federal government officials know about the status of these technologies in the United States. We did not conduct a global assessment of transportation technologies. We reviewed numerous studies on the relationship between oil and the global economy and, in particular, on the experiences of past oil price shocks. To identify federal government activities that could address peak oil production issues, we spoke with officials at DOE and USGS, and gathered information on federal programs and policies that could affect uncertainty about the timing of peak oil production and the development of alternative transportation technologies. To gain further insights into the federal role and other issues surrounding peak oil
production, we convened an expert panel in conjunction with the National Academy of Sciences. These experts commented on the potential
economic consequences of a transition away from conventional oil, factors that could affect the severity of the consequences, and what the federal role should be, among other things. A more detailed description of the scope and methodology of our review is presented in appendix I. We
4
performed our work between July 2005 and December 2006, in accordance with generally accepted government auditing standards.
Most studies estimate that oil production will peak sometime between now and 2040, although many of these projections cover a wide range of time, including two studies for which the range extends into the next century. The timing of the peak depends on multiple, uncertain factors that will influence how quickly the remaining oil is used, including the amount of oil still in the ground, how much of the remaining oil can be ultimately produced, and future oil demand. The amount of oil remaining in the ground is highly uncertain, in part because the Organization of Petroleum Exporting Countries (OPEC) controls most of the estimated world oil reserves, but its estimates of reserves are not verified by independent auditors. In addition, many parts of the world have not yet been fully explored for oil. There is also great uncertainty about the amount of oil that will ultimately be produced, given the technological, cost, and environmental challenges. For example, some of the oil
remaining in the ground can be accessed only by using complex and costly technologies that present greater environmental challenges than the technologies used for most of the oil produced to date. Other important sources of uncertainty about future oil production are potentially
unfavorable political and investment conditions in countries where oil is located. For example, more than 60 percent of world oil reserves, on the basis of Oil and Gas Journal estimates, are in countries where relatively unstable political conditions could constrain oil exploration and
production. Finally, future world demand for oil also is uncertain because it depends on economic growth and government policies throughout the world. For example, continued rapid economic growth in China and India could significantly increase world demand for oil, while environmental concerns, including oil’s contribution to global warming, may spur conservation or adoption of alternative fuels that would reduce future demand for oil.
Results in Brief
In the United States, alternative transportation technologies face
challenges that could impede their ability to mitigate the consequences of a peak and decline in oil production, unless sufficient time and effort are brought to bear. For example:
• Ethanol from corn is more costly to produce than gasoline, in part because of the high cost of the corn feedstock. Even if ethanol were to become more cost-competitive with gasoline, it could not become widely available
without costly investments in infrastructure, including pipelines, storage tanks, and filling stations.
• Advanced vehicle technologies that could increase mileage or use different fuels are generally more costly than conventional technologies and have not been widely adopted. For example, hybrid electric vehicles can cost from $2,000 to $3,500 more to purchase than comparable conventional vehicles and currently constitute about 1 percent of new vehicle registrations in the United States.
• Hydrogen fuel cell vehicles are significantly more costly than conventional vehicles to produce. Specifically, the hydrogen fuel cell stack needed to power a vehicle currently costs about $35,000 to produce, in comparison with a conventional gas engine, which costs $2,000 to $3,000.
Given these challenges, development and widespread adoption of alternative transportation technologies will take time and effort. Key alternative technologies currently supply the equivalent of only about 1 percent of U.S. consumption of petroleum products, and DOE projects that even under optimistic scenarios, by 2015 these technologies could displace only the equivalent of 4 percent of projected U.S. annual consumption. Under these circumstances, an imminent peak and sharp decline in oil production could have severe consequences, including a worldwide recession. If the peak comes later, however, these technologies have a greater potential to mitigate the consequences. DOE projects that these technologies could displace up to the equivalent of 34 percent of projected U.S. annual consumption of petroleum products in the 2025 through 2030 time frame, assuming the challenges the technologies face are overcome. The level of effort dedicated to overcoming challenges to alternative technologies will depend in part on the price of oil; without sustained high oil prices, efforts to develop and adopt alternatives may fall by the wayside.
Federal agency efforts that could reduce uncertainty about the timing of peak oil production or mitigate its consequences are spread across
multiple agencies and generally are not focused explicitly on peak oil. For example, efforts that could be used to reduce uncertainty about the timing of a peak include USGS activities to estimate oil resources and DOE efforts to monitor current supply and demand conditions in global oil markets and to make future projections. Similarly, DOE, the Department of Transportation (DOT), and the U.S. Department of Agriculture (USDA) all have programs and activities that oversee or promote alternative transportation technologies that could mitigate the consequences of a
peak. However, officials of key agencies we spoke with acknowledge that their efforts—with the exception of some studies—are not specifically designed to address peak oil. Federally sponsored studies we reviewed have expressed a growing concern over the potential for a peak and officials from key agencies have identified some options for addressing this issue. For example, DOE and USGS officials told us that developing better information about worldwide demand and supply and improving global estimates for nonconventional oil resources and oil in “frontier” regions that have yet to be fully explored could help prepare for a peak in oil production by reducing uncertainty about its timing. Agency officials also said that, in the event of an imminent peak, they could step up efforts to mitigate the consequences by, for example, further encouraging
development and adoption of alternative fuels and advanced vehicle technologies. However, according to DOE, there is no formal strategy for coordinating and prioritizing federal efforts dealing with peak oil issues, either within DOE or between DOE and other key agencies.
While the consequences of a peak would be felt globally, the United States, as the largest consumer of oil and one of the nations most heavily
dependent on oil for transportation, may be particularly vulnerable. Therefore, to better prepare the United States for a peak and decline in oil production, we are recommending that the Secretary of Energy take the lead, in coordination with other relevant federal agencies, to establish a peak oil strategy. Such a strategy should include efforts to reduce
uncertainty about the timing of a peak in oil production and provide timely advice to Congress about cost-effective measures to mitigate the potential consequences of a peak. In commenting on a draft of the report, the Departments of Energy and the Interior generally agreed with the report and recommendations.
Oil—the product of the burial and transformation of biomass over the last 200 million years—has historically had no equal as an energy source for its intrinsic qualities of extractability, transportability, versatility, and cost. But the total amount of oil underground is finite, and, therefore,
production will one day reach a peak and then begin to decline. Such a peak may be involuntary if supply is unable to keep up with growing demand. Alternatively, a production peak could be brought about by voluntary reductions in oil consumption before physical limits to
continued supply growth kick in. Not surprisingly, concerns have arisen in recent years about the relationship between (1) the growing consumption of oil and the availability of oil reserves and (2) the impact of potentially dwindling supplies and rising prices on the world’s economy and social
welfare. Following a peak in world oil production, the rate of production would eventually decrease and, necessarily, so would the rate of
consumption of oil.
Oil can be found and produced from a variety of sources. To date, world oil production has come almost exclusively from what are considered to be “conventional sources” of oil. While there is no universally agreed-upon definition of what is meant by conventional sources, IEA states that conventional sources can be produced using today’s mainstream
technologies, compared with “nonconventional sources” that require more complex or more expensive technologies to extract, such as oil sands and oil shale. Distinguishing between conventional and nonconventional oil sources is important because the additional cost and technological challenges surrounding production of nonconventional sources make these resources more uncertain. However, this distinction is further complicated because what is considered to be a mainstream technology can change over time. For example, offshore oil deposits were considered to be a nonconventional source 50 years ago; however, today they are considered conventional. For the purpose of this report, and consistent with IEA’s classification, we define nonconventional sources as including oil sands, heavy oil deposits, and oil shale.5
Some oil is being produced from these nonconventional sources today. For example, in 2005 Canada produced about 1.6 million barrels per day of oil from oil sands, and Venezuelan production of extra-heavy oil for 2005 was projected to be about 600,000 barrels per day. Currently, however, production from these sources is very small compared with total world oil production.
According to IEA, most countries outside the Middle East have reached their peak in conventional oil production, or will do so in the near future. The United States is a case in point. Even though the United States is currently the third-largest, oil-producing nation,6
U.S. oil production peaked around 1970 and has been on a declining trend ever since. (See fig. 1.)
Oil Production Has Peaked
in the United States and
Most Other Countries
Outside the Middle East
5
The distinction as to what portion of heavy oil is conventional is debated by experts. For example, contrary to the IEA definition, USGS considers the heavy oil produced in California as conventional oil.
6
Figure 1: U.S. Oil Production, 1900-2005
0 1 2 3 4 5 6 7 8 9 10
2005 1990
1975 1960
1945 1930
1915 1900
Year
Source: GAO analysis of Energy Information Administration data. Million barrels per day
Looking toward the future, EIA projects that U.S. deepwater oil production will slightly boost total U.S. production in the near term. However, this increase will end about 2016, and then U.S. production will continue to decline. Given these projections, it is clear that future
increases in U.S. demand for oil will need to be fulfilled through increases in production in the rest of the world. Increasing production in other countries has to date been able to more than make up for declining U.S. production and has resulted in increasing world production. (See fig. 2.)
Figure 2: World Crude Oil and Other Liquids Production, 1965-2005
Million barrels per day
Source: GAO analysis of British Petroleum data. 0
10 20 30 40 50 60 70 80 90 100
2005 2000
1995 1990
1985 1980
1975 1970
1965
Note: These data include crude oil, shale oil, oil sands, and natural gas liquids—the liquid content of natural gas. They exclude liquid fuels from other sources, such as coal derivatives.
Oil Is Critical in Satisfying
the U.S. and World
Demand for Energy
Oil accounts for approximately one-third of all the energy used in the world. Following the record oil prices associated with the Iranian
Revolution in 1979-80 and with the start of the Iran-Iraq war in 1980, there was a drop in total world oil consumption, from about 63 million barrels per day in 1980 to 59 million barrels per day in 1983. Since then, however, world consumption of petroleum products has increased, totaling about 84 million barrels per day in 2005. In the United States, consumption of petroleum products increased an average of 1.65 percent annually from 1983 to 2004, and averaged 20.6 million barrels per day in 2005,
representing about one-quarter of all world consumption. EIA projects that U.S. consumption will continue to increase and will reach 27.6 million barrels per day in 2030.
As figure 3 shows, the transportation sector is by far the largest U.S. consumer of petroleum, accounting for two-thirds of all U.S. consumption and relying almost entirely on petroleum to operate. Within the
petroleum energy,7
accounting for approximately 60 percent of the transportation sector’s consumption of petroleum-based energy in the United States. Figure 3 also shows that while consumption of petroleum products in other sectors has remained relatively constant or increased slightly since the early 1980s, petroleum consumption in the transportation sector has grown at a significant rate.
Figure 3: Annual U.S. Oil Consumption, by Sector, 1974-2005
Year 0 2 4 6 8 10 12 14 Electric Transportation Industrial Commerical Residential
Source: GAO analysis of Energy Information Administration data. Million barrels per day
2005 2004 2003 2002 2001 2000 1999 1998 1997 1996 1995 1994 199 3 1992 1991 1990 1989 1988 1987 1986 1985 1984 1983 1982 1981 1980 1979 1978 1977 1976 1975 1974
Relationship of Supply and
Demand of Oil to Oil Price
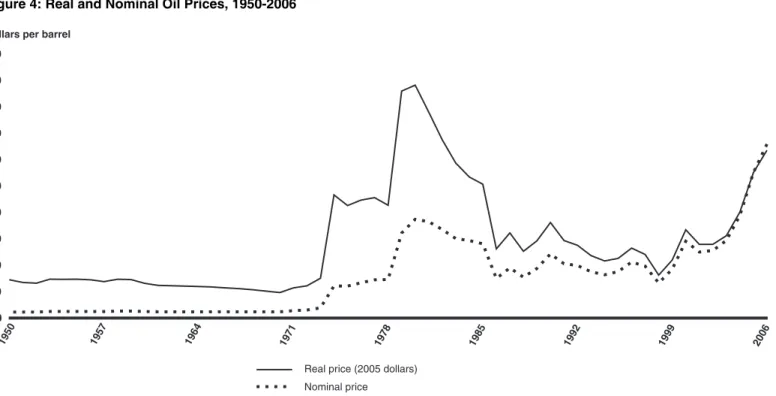
The price of oil is determined in the world market and depends mainly on the balance between world demand and supply. Recent world production of oil has been running at near capacity to meet rising demand, which has put upward pressure on oil prices. Figure 4 shows that world oil prices in nominal terms—unadjusted for inflation—are higher than at any time
7
According to the Transportation Energy Data Book, light vehicles include cars; light trucks (two-axle, four-tire trucks); and motorcycles.
since 1950, although when adjusted for inflation, the high prices of 2006 are still lower than were reached in the 1979-80 price run-up following the Iranian Revolution and the beginning of the Iran-Iraq war.
Figure 4: Real and Nominal Oil Prices, 1950-2006
Dollars per barrel
Source: GAO analysis of British Petroleum, Energy Information Administration, and Bureau of Labor Statistics data. 0
10 20 30 40 50 60 70 80 90 100
Real price (2005 dollars) Nominal price
2006 1999
1992 1985
1978 1971
1964 1957
1950
Note: Crude oil price data are annual averages of Arabian Light prices for 1945 through 1983 and Brent oil prices for 1984 through 2005. The 2006 price is an average of daily Brent oil prices from January 3 to December 20, 2006.
All else being equal, oil consumption is inversely correlated with oil price, with higher oil prices inducing consumers to reduce their oil
consumption.8
Specifically, increases in crude oil prices are reflected in the prices of products made from crude oil, including gasoline, diesel, home heating oil, and petrochemicals. The extent to which consumers are
8
Oil consumption also depends on other factors; therefore, it is sometimes difficult to isolate the changes in consumption caused by changes in oil prices. For example, gasoline consumption generally increases as incomes rise and people choose to drive more. In addition, higher incomes mean that oil plays a smaller role in a consumer’s budget, and, therefore, higher-income consumers may be less sensitive to changes in oil prices than lower-income consumers.
willing and able to reduce their consumption of oil in response to price increases depends on the cost of switching to activities and lifestyles that use less oil. Because there are more options available in the longer term, consumers respond more to changes in oil prices in the longer term than in the shorter term. For example, in the short term, consumers can reduce oil consumption by driving less or more slowly, but in the longer term, consumers can still take those actions, but can also buy more fuel-efficient automobiles or even move closer to where they work and thereby further reduce their oil consumption.
Supply and demand, in turn, affect the type of oil that is produced.
Conventional oil that is less expensive to extract using lower-cost drilling techniques will be produced when oil prices are lower. Conversely, oil that is expensive to produce because of the higher cost technologies involved may not be economical to produce at low oil prices. Producers are unlikely to turn to these more expensive oil sources unless oil prices are sustained at a high enough level to make such an enterprise profitable. Given the importance of oil in the world’s energy portfolio, as cheaper oil reserves are exhausted in the future, nations will need to make the transition to more and more expensive and difficult-to-access sources of oil to meet energy demands. Recently, for example, a large discovery of oil in the Gulf of Mexico made headlines; however, this potential wealth of oil is located at a depth of over 5 miles below sea level, a fact that adds significantly to the costs of extracting that oil.
Most studies estimate that oil production will peak sometime between now and 2040, although many of these projections cover a wide range of time, including two studies for which the range extends into the next century.9
Key uncertainties in trying to determine the timing of peak oil are the (1) amount of oil throughout the world; (2) technological, cost, and environmental challenges to produce that oil; (3) political and investment risk factors that may affect oil exploration and production; and (4) future world demand for oil. The uncertainties related to exploration and
Timing of Peak Oil
Production Depends
on Uncertain Factors
9
One key difference between the studies is in how much oil they assume is still in the ground. Some studies consider a peak in conventional oil, while other studies consider a peak in total oil, including conventional and nonconventional oils. Because of these differences in the peak concept used in the various studies, we have not attempted to define a peak as either a peak in conventional oil or conventional plus nonconventional oils. Instead, we have focused on identifying key factors that cause uncertainty in the timing of the peak. These factors would cause such uncertainty regardless of whether the peak concept focused on conventional or total oil.
production also make it difficult to estimate the rate of decline after the peak.
Studies Predict Widely
Different Dates for Peak
Oil
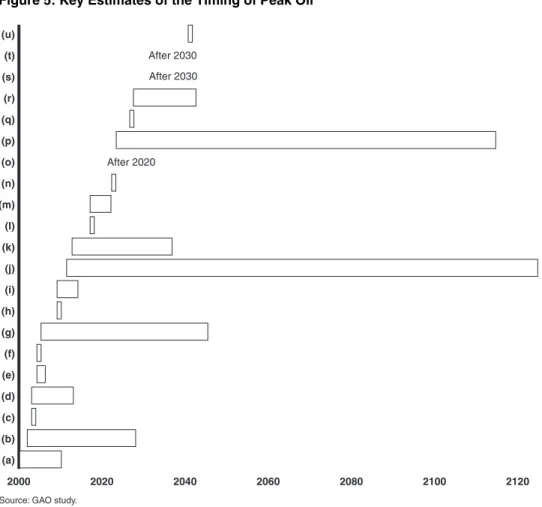
Most studies estimate that oil production will peak sometime between now and 2040, although many of these projections cover a wide range of time, including two studies for which the range extends into the next century. Figure 5 shows the estimates of studies we examined.
Figure 5: Key Estimates of the Timing of Peak Oil
Source: GAO study.
2000 2020 2040 2060 2080 2100 2120
After 2020 After 2030 After 2030
(a) (b) (c) (d) (e) (f) (g) (h) (i) (j) (k) (l) (m) (n) (o) (p) (q) (r) (s) (t) (u)
Note: These studies are listed in appendix II of this report. Estimates of 90 percent confidence intervals using two different reserves data sources are provided for study g. One additional study that is not represented in this figure, referenced as study v, states that the timing of the peak is
Studies that predict the timing of a peak use different estimates of how much oil remains in the ground, and these differences explain some of the wide ranges of these predictions. Estimates of how much oil remains in the ground are highly uncertain because much of these data are self-reported and unverified by independent auditors; many parts of the world have yet to be fully explored for oil; and there is no comprehensive
assessment of oil reserves from nonconventional sources. This uncertainty surrounding estimates of oil resources in the ground comprises the
uncertainty surrounding estimates of proven reserves10
as well as uncertainty surrounding expected increases in these reserves and estimated future oil discoveries.
Amount of Oil in the
Ground Is Uncertain
Oil and Gas Journal and World Oil, two primary sources of proven reserves estimates, compile data on proven reserves from national and private company sources. Some of this information is publicly available from oil companies that are subject to public reporting requirements—for example, information provided by companies that are publicly traded on U.S. stock exchanges that are subject to the filing requirements of U.S. federal securities laws. Information filed pursuant to these laws is subject to liability standards, and, therefore, there is a strong incentive for these companies to make sure their disclosures are complete and accurate. On the other hand, companies that are not subject to these federal securities laws, including companies wholly owned by various OPEC countries where the majority of reserves are located, are not subject to these filing requirements and their related liability standards. Some experts believe OPEC estimates of proven reserves to be inflated. For example, OPEC estimates increased sharply in the 1980s, corresponding to a change in OPEC’s quota rules that linked a member country’s production quota in part to its remaining proven reserves. In addition, many OPEC countries’ reported reserves remained relatively unchanged during the 1990s, even as they continued high levels of oil production. For example, IEA reports that reserves estimates in Kuwait were unchanged from 1991 to 2002, even though the country produced more than 8 billion barrels of oil over that period and did not make any important new oil discoveries. At a 2005
10
Proven reserves are classified as oil in the ground that is likely to be economically producible at expected oil prices and given expected technologies. Conventional reserves are often classified according to the degree of certainty that they exist and can be extracted profitably. Even this classification is fraught with uncertainty because there are no
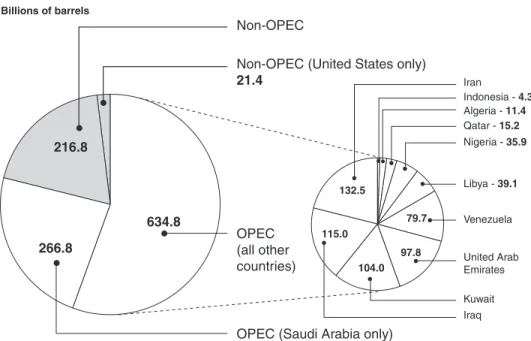
National Academy of Sciences workshop on peak oil, OPEC defended its reserves estimates as accurate. The potential unreliability of OPEC’s self-reported data is particularly problematic with respect to predicting the timing of a peak because OPEC holds most of the world’s current estimated proven oil reserves. On the basis of Oil and Gas Journal estimates as of January 2006, we found that of the approximately 1.1 trillion barrels of proven oil reserves worldwide,11
about 80 percent are located in the OPEC countries,12
compared with about 2 percent in the United States. Figure 6 shows this estimate in more detail.
11
As previously discussed in this report, there is no universally agreed-upon definition of conventional oil. The Oil and Gas Journal includes Canadian oil sands in its estimates. IEA classifies oil sands as nonconventional, and, therefore, since we are using the IEA classification throughout this report, we have removed the Oil and Gas Journal estimate of 174 billion barrels of oil from the Canadian oil sands data. USGS experts emphasized the importance of these oil sands in future oil production and stated that in their view, these resources are now considered to be conventional.
12
OPEC’s members are Algeria, Indonesia, Iran, Iraq, Kuwait, Libya, Nigeria, Qatar, Saudi Arabia, the United Arab Emirates, and Venezuela. Beginning with January 2007 data, new OPEC member Angola would also be included in OPEC reserves estimates.
Figure 6: World Oil Reserves, OPEC and non-OPEC, 2006
OPEC (all other countries)
OPEC (Saudi Arabia only) Non-OPEC
Non-OPEC (United States only)
21.4
Billions of barrels
Source: GAO analysis of Oil and Gas Journal data.
Algeria - 11.4
Iran
Iraq
Kuwait Libya - 39.1
Nigeria - 35.9
Qatar - 15.2
United Arab
Emirates
Venezuela 266.8 634.8 216.8 132.5 104.0 79.7 97.8 115.0
Indonesia - 4.3
USGS, another primary source of reported estimates, provides oil
resources estimates, which are different from proved reserves estimates. Oil resources estimates are significantly higher because they estimate the world’s total oil resource base, rather than just what is now proven to be economically producible. USGS estimates of the resource base include past production and current reserves as well as the potential for future increases in current conventional oil reserves—often referred to as reserves growth—and the amount of estimated conventional oil that has the potential to be added to these reserves.13
Estimates of reserves growth and those resources that have the potential to be added to oil reserves are important in determining when oil production may peak. However,
13
USGS defines conventional oil accumulation based primarily on geology. The time horizon for these data is 30 years. This definition does not incorporate economic or political factors, such as deepwater, remoteness, harsh climate, regulatory status, or engineering techniques. Not included in this USGS definition are oil sands and oil shale. Interior’s Minerals Management Service oversees oil production on federal lands offshore. Officials from the Minerals Management Service stated in comments on a draft of this report that, with regard to some offshore areas, resource estimates are based on data that are 20 to 25 years old. They also pointed out that resource estimates can change
estimating these potential future reserves is complicated by the fact that many regions of the world have not been fully explored and, as a result, there is limited information. For example, in its 2000 assessment, USGS provides a mean estimate of 732 billion barrels that have the potential to be added as newly discovered conventional oil, with as much as 25 percent from the Arctic—including Greenland, Northern Canada, and the Russian portion of the Barents Sea. However, relatively little exploration has been done in this region, and there are large portions of the world where the potential for oil production exists, but where exploration has not been done. According to USGS, there is less uncertainty in regions where wells have been drilled, but even in the United States, one of the areas that has seen the greatest exploration, some areas have not been fully explored, as illustrated by the recent discovery of a potentially large oil field in the Gulf of Mexico.
Limited information on oil-producing regions worldwide also leads USGS to base its estimate of reserves growth on how reserves estimates have grown in the United States. However, some experts criticize this
methodology; they believe such an estimate may be too high because the U.S. experience overestimates increases in future worldwide reserves. In contrast, EIA believes the USGS estimate may be too low. In 2005, USGS released a study showing that its prediction of reserves growth has been in line with the world’s experience from 1996 to 2003.14
Given such
controversy, uncertainty remains about this key element of estimating the amount of oil in the ground. In 2000, USGS’ most recent full assessment of the world’s key oil regions, the agency provided a range of estimates of remaining world conventional oil resources. The mean of this range was at about 2.3 trillion barrels comprising about 890 billion barrels in current reserves and 1.4 trillion barrels that have the potential to be added to oil reserves in the future.15
Further contributing to the uncertainty of the timing of a peak is the lack of a comprehensive assessment of oil from nonconventional sources. For example, the three key sources of oil estimates—Oil and Gas Journal,
14
T.R. Klett, Donald L. Gautier, and Thomas S. Ahlbrandt, “An Evaluation of the U.S. Geological Survey World Petroleum Assessment 2000,” American Association of Petroleum Geologists Bulletin. Vol. 89, no.8 (August 2005).
15
Thomas S. Ahlbrandt, Ronald R. Charpentier, T.R. Klett, James W. Schmoker, Christopher J. Schenk, and Gregory F. Ulmishek, Global Resource Estimates from Total Petroleum Systems (The American Association of Petroleum Geologists: Tulsa, Oklahoma, 2005).
World Oil, and USGS—do not generally include oil from nonconventional sources. This is an important issue because oil from nonconventional sources is thought to exist in large quantities. For example, IEA believes that oil from nonconventional sources—composed primarily of Canadian oil sands, extra-heavy oil deposits in Venezuela, and oil shale in the United States—could account for as much as 7 trillion barrels of oil, which could greatly delay the onset of a peak in production. However, IEA also points out that the amount of this nonconventional oil that will eventually be produced is highly uncertain, which is a result of the challenges facing this production. Despite this uncertainty, USGS experts noted that Canadian oil sands and Venezuelan extra-heavy oil production are under way now and also suggested that proven reserves from these sources will be growing considerably in the immediate future.
Uncertainty Remains
about How Much Oil Can
Be Produced from Proven
Reserves, Hard-to-Reach
Locations, and
Nonconventional Sources
It is also difficult to project the timing of a peak in oil production because technological, cost, and environmental challenges make it unclear how much oil can ultimately be recovered from (1) proven reserves, (2) hard-to-reach locations, and (3) nonconventional sources.
To increase the recovery rate from oil reserves, companies turn to enhanced oil recovery (EOR) technologies, which DOE reports has the potential to increase recovery rates from 30 to 50 percent in many locations. These technologies include injecting steam or heated water; gases, such as carbon dioxide; or chemicals into the reservoir to stimulate oil flow and allow for increased recovery. Opportunities for EOR have been most aggressively pursued in the United States, EOR technologies currently contribute approximately 12 percent to U.S. production, and carbon dioxide EOR alone is projected to have the potential to provide at least 2 million barrels per day by 2020. However, technological advances, such as better seismic and fluid-monitoring techniques for reservoirs during an EOR injection, may be required to make these techniques more cost-effective. Furthermore, EOR technologies are much costlier than the conventional production methods used for the vast majority of oil
produced. Costs are higher because of the capital cost of equipment and operating costs, including the production, transportation, and injection of agents into existing fields and the additional energy costs of performing these tasks. Finally, EOR technologies have the potential to create
environmental concerns associated with the additional energy required to conduct an EOR injection and the greenhouse gas emissions associated with producing that energy, although EIA has stated that these
environmental costs may be less than those imposed by producing oil in previously undeveloped areas. Even if sustained high oil prices make EOR
technologies cost-effective for an oil company, these challenges and costs may deter their widespread use.
The timing of peak oil is also difficult to estimate because new sources of oil could be increasingly more remote and costly to exploit, including offshore production of oil in deepwater and ultra-deepwater. Worldwide, industry analysts report that deepwater (depths of 1,000 to 5,000 feet) and ultra-deepwater (5,000 to 10,000 feet) drilling efforts are concentrated offshore in Africa, Latin America, and North America, and capital
expenditures for these efforts are expected to grow through at least 2011. In the United States, deepwater and ultra-deepwater drilling, primarily in the Gulf of Mexico, could reach 2.2 million barrels per day in 2016, according to EIA estimates. However, accessing and producing oil from these locations present several challenges. At deepwater depths,
penetrating the earth and efficiently operating drilling equipment is difficult because of the extreme pressure and temperature. In addition, these conditions can compromise the endurance and reliability of operating equipment. Operating costs for deepwater rigs are 3.0 to 4.5 times more than operating costs for typical shallow water rigs. Capital costs, including platforms and underwater pipeline infrastructures, are also greater. Finally, deepwater and ultra-deepwater drilling efforts generally face similar environmental concerns as shallow water drilling efforts, although some deepwater operations may pose greater
environmental concerns to sensitive deepwater ecosystems. It is unclear how much oil can be recovered from nonconventional
sources. Recovery from these sources could delay a peak in oil production or slow the rate of decline in production after a peak. Expert sources disagree concerning the significance of the role these nonconventional sources will play in the future. DOE officials we spoke with emphasized the belief that nonconventional oil will play a significant role in the very near future as conventional oil production is unable to meet the increasing demand for oil. However, IEA estimates of oil production have
conventional oil continuing to comprise almost all of production through 2030. Currently, production of oil from key nonconventional sources of oil—oil sands, heavy and extra-heavy oil deposits, and oil shale—is more costly and presents environmental challenges.
Oil sands are deposits of bitumen, a thick, sticky form of crude oil, that is so heavy and viscous it will not flow unless heated. While most
conventional crude oil flows naturally or is pumped from the ground, oil sands must be mined or recovered “in-situ,” before being converted into an upgraded crude oil that can be used by refineries to produce gasoline and
diesel fuels. Alberta, Canada, contains at least 85 percent of the world’s proven oil sands reserves. In 2005, worldwide production of oil sands, largely from Alberta, contributed approximately 1.6 million barrels of oil per day, and production is projected to grow to as much as 3.5 million barrels per day by 2030. Oil sand deposits are also located domestically in Alabama, Alaska, California, Texas, and Utah. Production from oil sands, however, presents significant environmental challenges. The production process uses large amounts of natural gas, which generates greenhouse gases when burned. In addition, large-scale production of oil sands requires significant quantities of water, typically produce large quantities of contaminated wastewater, and alter the natural landscape. These challenges may ultimately limit production from this resource, even if sustained high oil prices make production profitable.
Heavy and extra-heavy oils are dense, viscous oils that generally require advanced production technologies, such as EOR, and substantial
processing to be converted into petroleum products. Heavy and extra-heavy oils differ in their viscosities and other physical properties, but advanced recovery techniques like EOR are required for both types of oil. Known extra-heavy oil deposits are primarily in Venezuela—almost 90 percent of the world’s proven extra-heavy oil reserves. Venezuelan
production of extra-heavy oil was projected to be 600,000 barrels of oil per day in 2005 and is projected to be sustained at this rate through 2040. Heavy oil can be found in Alaska, California, and Wyoming and may exist in other countries besides the United States and Venezuela. Like
production from oil sands, however, heavy oil production in the United States presents environmental challenges in its consumption of other energy sources, which contributes to greenhouse gases, and potential groundwater contamination from the injectants needed to thin the oil enough so that oil will flow through pipes.
Heavy and Extra-Heavy Oils
Oil shale is sedimentary rock containing solid bituminous materials that release petroleum-like liquids when the rock is heated. The world’s largest known oil shale deposit covers portions of Colorado, Utah, and Wyoming, but other countries, such as Australia and Morocco, also contain oil shale resources. Oil shale production is under consideration in the United States, but considerable doubts remain concerning its ultimate technical and commercial feasibility. Production from oil shale is energy-intensive, requiring other energy sources to heat the shale to about 900 to 1,000 degrees Fahrenheit to extract the oil. Furthermore, oil shale production is projected to contaminate local surface water with salts and toxics that leach from spent shale. These factors may limit the amount of oil from
shale that can be produced, even if oil prices are sustained at high enough levels to offset the additional production costs.
More detailed information on these technologies is provided in appendix III.
Political and Investment
Risk Factors Create
Uncertainty about the
Future Rate of Oil
Exploration and
Production
Political and investment risk factors also could affect future oil exploration and production and, ultimately, the timing of peak oil production. These factors include changing political conditions and investment climates in many countries that have large proven oil reserves. Experts we spoke with told us that they considered these factors
important in affecting future oil exploration and production.
In many countries with proven reserves, oil production could be shut down by wars, strikes, and other political events, thus reducing the flow of oil to the world market. If these events occurred repeatedly, or in many different locations, they could constrain exploration and production, resulting in a peak despite the existence of proven oil reserves. For example, according to a news account, crude oil output in Iraq dropped from 3.0 million barrels per day before the 1990 gulf war to about 2.0 million barrels per day in 2006, and a labor strike in the Venezuelan oil sector led to a drop in exports to the United States of 1.2 million barrels. Although these were isolated and temporary oil supply disruptions, if enough similar events occurred with sufficient frequency, the overall impact could constrain production capacity, thus making it impossible for supply to expand along with demand for oil. Using a measure of political risk that assesses the likelihood that events such as civil wars, coups, and labor strikes will occur in a magnitude sufficient to reduce a country’s gross domestic product (GDP) growth rate over the next 5 years,16
we found that four countries—Iran, Iraq, Nigeria, and Venezuela—that possess proven oil reserves greater than 10 billion barrels (high reserves) also face high levels of political risk. These four countries contain almost
Political Conditions Create
Uncertainties about Oil
Exploration and Production
16
The political risk measure comes from Global Insight’s Global Risk Service. Global Insight is a worldwide consulting firm headquartered in Massachusetts. The Global Risk Service political risk score is a summary of probabilities that different political events, such as civil war, will reduce GDP growth rates. The subjective probabilities are assessed by country analysts at Global Insight, on the basis of a wide range of information, and are reviewed by a team to ensure consistency across countries. The measures are revised quarterly; the measure we used comes from the second quarter of 2006.
one-third of worldwide oil reserves. Countries with medium or high levels of political risk contained 63 percent of proven worldwide oil reserves, on the basis of Oil and Gas Journal estimates of oil reserves. (See fig. 7.)17
Figure 7: Worldwide Proven Oil Reserves, by Political Risk
Source: GAO analysis of Oil and Gas Journal and Global Insightdata.
Medium High
Low
4
Political risk
unknown
314
413 389
Billions of barrels
Note: Oil and Gas Journal reserves estimates are based on surveys filled out by the countries. See appendix I of this report for limitations of these data and their effect on our use of these data.
Even in the United States, political considerations may affect the rate of exploration and production. For example, restrictions imposed to protect environmental assets mean that some oil may not be produced. Interior’s Minerals Management Service estimates that approximately 76 billion barrels of oil lie in undiscovered fields offshore in the U.S. outer
continental shelf. However, Congress has enacted moratoriums on drilling and exploration in this area to protect coastlines from unintended oil
17
Because we examined a forecast of risk factors, it would have been ideal to have a forecast of what oil reserves are likely to be in each country for the next 5 years, including reserve growth and potential future discoveries. However, such reserve predictions are not publicly available, and, therefore, we used published country-level data on proven reserves from the Oil and Gas Journal. Consistent with our previous presentation of proven reserves, the information we present here does not include Canadian oil sands data.
spills. In addition, policies on federal land use need to take into account multiple uses of the land, including environmental protection.18
Environmental restrictions may affect a peak in oil production by barring oil exploration and production in environmentally sensitive areas.
Foreign investment in the oil sector could be necessary to bring oil to the world market,19
according to studies we reviewed and experts we
consulted, but many countries have restricted foreign investment. Lack of investment could hasten a peak in oil production because the proper infrastructure might not be available to find and produce oil when needed, and because technical expertise may be lacking. The important role foreign investment plays in oil production is illustrated in Kazakhstan, where the National Commission on Energy Policy found that opening the energy sector to foreign investment in the early 1990s led to a doubling in oil production between 1998 and 2002.20
In addition, we found that direct foreign investment in Venezuela was strongly correlated with oil
production in that country, and that when foreign investment declined between 2001 and 2004, oil production also declined.21
Industry officials told us that lack of technical expertise could lead to less sophisticated drilling techniques that actually reduce the ability to recover oil in more complex reservoirs. For example, according to industry officials, some Russian wells have difficulties with high water cut—that is, a high ratio of water to oil—making oil difficult to get out of the ground at current prices. This water cut problem stems from not using technically advanced
methods when the wells were initially drilled. We have previously reported that the Venezuelan national oil company, PDVSA, lost technical expertise when it fired thousands of employees following a strike in 2002 and 2003. In contrast, other national oil companies, such as Saudi Aramco, are widely perceived to possess considerable technical expertise.
Investment Climate Creates
Uncertainty about Oil
Exploration and Production
18
GAO, Oil and Gas Development: Increased Permitting Activity Has Lessened BLM’s Ability to Meet Its Environmental Protection Responsibilities, GAO-05-418 (Washington, D.C.: June 17, 2005).
19
According to IEA, infrastructure investment in exploration and production would need to total about $2.25 trillion from 2004 through 2030. This investment will be needed to expand supply capacity and to replace existing and future supply facilities that will be closed during the projection period.
20
National Commission on Energy Policy, Ending the Energy Stalemate: A Bipartisan Strategy to Meet America’s Energy Challenges (December 2004), available at
www.energycommission.org.
21
GAO, Energy Security: Issues Related to Potential Reductions in Venezuelan Oil Production, GAO-06-668 (Washington, D.C.: June 27, 2006).
According to our analysis, 85 percent of the world’s proven oil reserves are in countries with medium-to-high investment risk or where foreign
investment is prohibited, on the basis of Oil and Gas Journal estimates of oil reserves. (See fig. 8.) For example, over one-third of the world’s proven oil reserves lie in only five countries—China, Iran, Iraq, Nigeria, and Venezuela—all of which have a high likelihood of seeing a worsening investment climate. Three countries with large oil reserves—Saudi Arabia, Kuwait, and Mexico—prohibit foreign investment in the oil sector, and most major oil-producing countries have some type of restrictions on foreign investment. Furthermore, some countries that previously allowed foreign investment, such as Russia and Venezuela, appear to be reasserting state control over the oil sector, according to DOE.
Figure 8: Worldwide Proven Oil Reserves, by Investment Risk
Source: GAO analysis of Oil and Gas Journal and Global Insightdata.
Medium High
4
Investment risk unknown Low
165
384
164 402
Billions of barrels
No foreign investment
allowed in oil sector
Note: Oil and Gas Journal reserves estimates are based on surveys filled out by the countries. See appendix I of this report for limitations of these data and their effect on our use of these data.
Foreign investment in the oil sector also may be limited because national oil companies control the supply. Figure 9 indicates that 7 of the top 10 companies are national or state-sponsored oil and gas companies, ranked
on the basis of oil production. The 3 international oil companies that are among the top 10 are BP, Exxon Mobil, and Royal Dutch Shell.
Figure 9: Top 10 Companies on the Basis of Oil Production and Reserves Holdings, 2004
Source: GAO analysis of data from Petroleum Intelligence Weekly (Dec. 12, 2005). Percentage
0 10 20 30 40 50 60 70 80 90 100
International oil and gas company National oil and gas company
Exxon Mobil (U.S.) 8%
Royal Dutch Shell (U.K./Netherlands) 7% BP (U.K.) 7%
Lukoil (Russia) 2%a
Saudi Aramco (Saudi Arabia) 28% National Iranian Oil Co. (Iran) 12% Petroleos Mexicanos (Mexico) 11% Petroleos de Venezuela (Venezuela) 8% Kuwait Petroleum Co. (Kuwait) 7% Iraq National Oil Co. (Iraq) 6% Petro China (China) 6%
Saudi Aramco (Saudi Arabia) 32% National Iranian Oil Co. (Iran) 16% Iraq National Oil Co. (Iraq) 14% Kuwait Petroleum Co. (Kuwait) 11% Petroleos de Venezuela
(Venezuela) 10%
Abu Dhabi National Oil Co. (U.A.E.) 6% Libya NOC (Libya) 4%
Nigerian National Petroleum Co. (Nigeria) 3%
Petroleos de Mexico(Mexico) 2% 22%
78%
98%
Top 10 oil and gas companies on the basis of oil reserves holdings, 2004 Top 10 oil and gas companies on
the basis of oil production, 2004
Note: The Petroleum Intelligence Weekly data relies on company reports, where possible, as well as other information sources provided by companies. See appendix I of this report for limitations of these data and their effect on our use of these data.
a
Lukoil is the only company in the top 10 based on reserves that is not 100 percent state-sponsored.
National oil companies may have additional motivations for producing oil, other than meeting consumer demand. For instance, some countries use some profits from national companies to support domestic socioeconomic development, rather than focusing on continued development of oil
exploration and production for worldwide consumption. Given the amount of oil controlled by national oil companies, these types of actions have the potential to result in oil production that is not optimized to respond to increases in the demand for oil.
In addition, the top 8 oil companies ranked by proven oil reserves are national companies in OPEC-member countries, and OPEC decisions could affect future oil exploration and production. For example, in some
cases, OPEC countries might decide to limit current production to increase prices or to preserve oil and its revenue for future generations. Figure 10 shows IEA’s projections for total world oil production through 2030 and highlights the larger role that OPEC production will play after IEA’s projected peak in non-OPEC oil production around 2010.
Figure 10: World Oil Production, by OPEC and Non-OPEC Countries, 2004 Projected to 2030
0 10 20 30 40 50 60 70 80 90 100
OPEC Non-OPEC
2030 2020
2010 2004
Source: International Energy Agency. Million barrels per day
Note: This projection excludes production from nonconventional oil sources, such as Canadian oil sands.
Future World Demand for
Oil Is Uncertain
Uncertainty about future demand for oil—which will influence how
quickly the remaining oil is used—contributes to the uncertainty about the timing of peak oil production. EIA projects that oil will continue to be a major source of energy well into the future, with world consumption of petroleum products growing to 118 million barrels per day by 2030. Figure 11 shows world petroleum product consumption by region for 2003 and EIA’s projections for 2030. As the figure shows, EIA projects that
the Organization for Economic Cooperation and Development (OECD) North America,22
which includes the United States, and non-OECD Asia, which includes China and India, are the major drivers of this growth.
Figure 11: Daily World Oil Consumption, by Region for 2003 and Projected for 2030
Source: Energy Information Administration.
0 5 10 15 20 25 30 35
2030 2003 OECD North America
OECD Europe and Eurasia OECD Asia Non-OECD Europe and Eurasia Non-OECD Asia Middle East Africa Central and South America
Million barrels per day Region
Future world oil demand will depend on such uncertain factors as world economic growth, future government policy, and consumer choices. Specifically:
• Economic growth drives demand for oil. For example, according to IEA, in 2003 the world experienced strong growth in oil consumption of 2.0 percent, with even stronger growth of 3.6 percent in 2004, from 79.8
22
OECD is a group of 30 member countries sharing a commitment to democratic government and a market economy.
million barrels per day to 82.6 million barrels per day and China accounted for 30 percent of this increase, driven largely by China’s almost 10 percent economic growth that year. EIA projects the Chinese economy will
continue to grow, but factors such as the speed of reform of ineffective state-owned companies and the development of capital markets adds uncertainty to such projections and, as a result, to the level of future oil demand in China.
• Future government policy can also affect oil demand. For example, environmental concerns about gasoline’s emissions of carbon dioxide, which is a greenhouse gas, may encourage future reductions in oil demand if these concerns are translated into policies that promote biofuels.
• Consumer choices about conservation also can affect oil demand and thereby influence the timing of a peak. For example, if U.S. consumers were to purchase more fuel-efficient vehicles in greater numbers, this could reduce future oil demand in the United States, potentially delaying a time at which oil supply is unable to keep pace with oil demand.
Such uncertainties that lead to changes in future oil demand ultimately make estimates of the timing of a peak uncertain, as is illustrated in an EIA study on peak oil.23
Specifically, using future annual increases in world oil consumption, ranging from 0 percent, to represent no increase, to 3 percent, to represent a large increase, and out of the various scenarios examined, EIA estimated a window of up to 75 years for when the peak may occur.
Factors that create uncertainty about the timing of the peak—in particular, factors that affect oil exploration and production—also create uncertainty about the rate of production decline after the peak. For example, IEA reported that technology played a key role in slowing the decline and extending the life of oil production in the North Sea. Uncertainty about the rate of decline is illustrated in studies that estimate the timing of a peak. IEA, for example, estimates that this decline will range somewhere between 5 percent and 11 percent annually. Other studies assume the rate of decline in production after a peak will be the same as the rise in
production that occurred before the peak. Another methodology,
Factors That Create
Uncertainty about the
Timing of the Peak Also
Create Uncertainty about
the Rate of Decline
23
John H. Wood, Gary R. Long, and David F. Morehouse, Long Term World Oil Supply Scenarios: The Future Is Neither as Bleak or Rosy as Some Assert, Energy Information Administration, U.S. Department of Energy (2004).