Updated March 2001
What Has Been Happening to
Job Satisfaction in Britain?
Andrew Oswald
Professor of Economics Warwick University
and
Jonathan Gardner
Research Fellow Warwick University
Email: andrew.oswald@warwick.ac.uk Website: www.oswald.co.uk Contact telephone numbers: 02476 523510 or 01367 860005
I thought my most useful role would be to describe recent
patterns in British data.
1.
Reported levels of job satisfaction are high in Britain. For
example, on a standard numerical scale from 1 (“I am not satisfied
at all”) up to 7 (“I am completely satisfied with my job”), the single
most common answer is a 6.
2.
However, through the decade of the 1990s, Britons’ job satisfaction
fell. Stress, measured on a standard GHQ scale, increased during
the decade.
3.
Levels of job satisfaction in the public sector declined especially
sharply during the 1990s.
4.
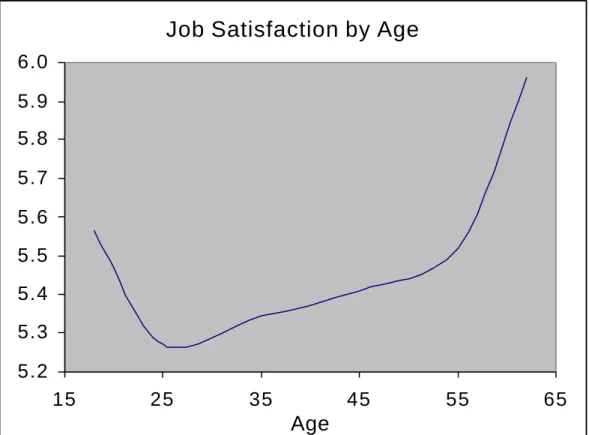
Job satisfaction is U-shaped in age. It is higher among women than
men, lower among blacks that whites, slightly lower in union
workplaces than non-union ones, high in small workplaces, and
largest of all in not-for-profit workplaces. The self-employed also
report high job satisfaction.
5.
It is Britons with university degrees, surprisingly, who report the
lowest levels of satisfaction at work.
British Household Panel Study Data: 1991-1998
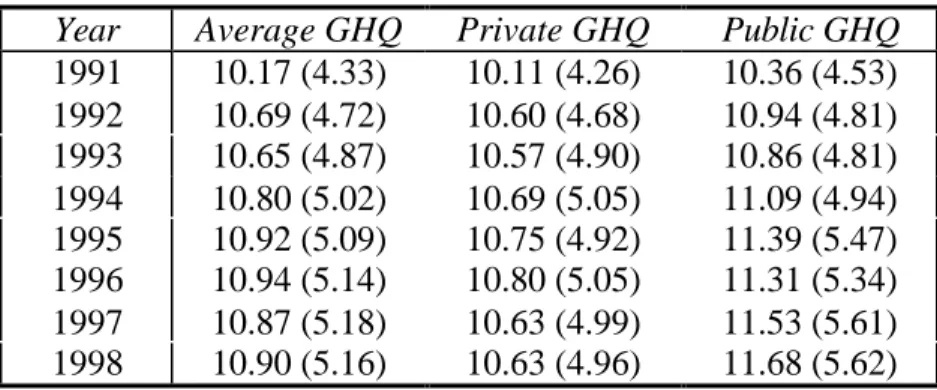
GHQ Mental Stress Levels of UK Workers over Time
Table 1 Mean (ie average) Stress Scores Through the Decade Year Average GHQ Private GHQ Public GHQ
1991 10.17 (4.33) 10.11 (4.26) 10.36 (4.53)
1992 10.69 (4.72) 10.60 (4.68) 10.94 (4.81)
1993 10.65 (4.87) 10.57 (4.90) 10.86 (4.81)
1994 10.80 (5.02) 10.69 (5.05) 11.09 (4.94)
1995 10.92 (5.09) 10.75 (4.92) 11.39 (5.47)
1996 10.94 (5.14) 10.80 (5.05) 11.31 (5.34)
1997 10.87 (5.18) 10.63 (4.99) 11.53 (5.61)
1998 10.90 (5.16) 10.63 (4.96) 11.68 (5.62)
Note:
§ Standard deviations are in parenthesis.
§ This is a statistically significant worsening of stress (at the 99% confidence level).
§ The GHQ variable measures mental distress or lack of psychological wellbeing by converting responses to twelve questions (regarding feelings of stress, self-worth, depression and happiness) to a single 36-point scale, with 0 being the least distressed possible and 36 the most distressed possible.
§ Sample size is approximately 5000 workers re-interviewed each year through the 1990s.
Figure 1: GHQ Levels of UK Workers over Time
GHQ Stress Levels of UK Workers over Time
10.0
10.2
10.4
10.6
10.8
11.0
11.2
11.4
11.6
11.8
1990 1991 1992 1993 1994 1995 1996 1997 1998 1999
Year
Public
A Description of the GHQ Stress Variable
GHQ is a standard measure of mental distress and psychological ill-health named after the General Health Questionnaire. It is widely used by British doctors, psychologists, and various kinds of social scientists. GHQ sums the answers to the following questions to create a kind of stress score.
The questions put to a person are:
Have you recently…
A. Been able to concentrate on whatever you’re doing? B. Lost much sleep over worry?
C. Felt that you were playing a useful part in things? D. Felt capable about making decision about things? E. Felt constantly under strain?
F. Felt you couldn’t overcome your difficulties?
G. Been able to enjoy your normal day-to- day activities? H. Been able to face up to problems?
I. Been feeling unhappy or depressed? J. Been losing confidence in yourself?
K. Been thinking of yourself as a worthless person? L. Been feeling reasonably happy, all things considered?
Each question is answered on a 0 to 3 scale, 0 being the highest level of well-being, 3 the lowest. The responses to these questions are then summed to form the overall GHQ measure of psychiatric illness or subjective well-being (0 to 36). A normal person gets a score of about 10 or 12, meaning that they give 1s nearly all the time.
SAMPLE STATISTICS: The BHPS Panel: 1991-1998
Table 2: The Job Satisfaction Data
Satisfaction Level Frequency Percentage of Responses
7 (completely satisfied) 5790 17.60
6 13737 41.75
5 6866 20.87
4 2803 8.52
3 2169 6.59
2 867 2.63
1 (not satisfied at all) 672 2.04
Intuitive note: hence 2% of the British population tend to say not satisfied at all with their job, and 17.6% say completely satisfied with their job.
Table 3: Mean Job Satisfaction Scores Mean (St. dev)
Overall 5.39 (1.37)
Male 5.22 (1.40)
Female 5.56 (1.32)
White 5.40 (1.37)
Non-white 5.13 (1.37)
Union recognised workplace 5.33 (1.37)
Non union workplace 5.45 (1.37)
Age: Less than 20 5.57 (1.28)
Age: 20-29 5.27 (1.40)
Age: 30-39 5.34 (1.37)
Age: 40-49 5.41 (1.36)
Age: 50-59 5.52 (1.37)
Age: 60 or over 5.96 (1.15)
Private sector 5.35 (1.40)
Public sector 5.45 (1.32)
Non-profit 5.72 (1.19)
Workplace size: 1-24 5.58 (1.33)
Workplace size: 25-99 5.39 (1.34)
Workplace size: 100-499 5.22 (1.42)
Workplace size: 500 plus 5.27 (1.38)
Education: None 5.56 (1.45)
Education: O-levels 5.43 (1.36)
Education: A-Levels 5.28 (1.34)
Education: HND,HNC 5.34 (1.30)
Education: Degree 5.18 (1.33)
Education: Higher Degree 5.30 (1.27)
Intuitive note: the average British job satisfaction score is thus 5.39 on a scale stretching from zero to seven. Answers tend to be at the highly satisfied end.
Table 4: Mean Job Satisfaction Scores over Time
Year Overall Male Female
1991 5.47 (1.52) 5.26 (1.54) 5.69 (1.46)
1992 5.47 (1.37) 5.24 (1.45) 5.70 (1.24)
1993 5.39 (1.37) 5.18 (1.42) 5.60 (1.30)
1994 5.33 (1.41) 5.13 (1.46) 5.52 (1.33)
1995 5.34 (1.36) 5.18 (1.38) 5.50 (1.32)
1996 5.38 (1.32) 5.23 (1.33) 5.53 (1.29)
1997 5.41 (1.30) 5.29 (1.29) 5.54 (1.31)
1998 5.32 (1.28) 5.21 (1.29) 5.43 (1.27)
Note:
§ Standard deviations are in parenthesis
§ This is a statistically significant worsening of job satisfaction (at the 99% level). Intuitive note for non-specialists: it is wrong to look at these and think that job satisfaction has gone down only 0.15 so this is small and does not matter; the reason is that the data are bunched in the 5s and 6s. § From 1991 to 1997, all employees were asked to rate their level of satisfaction with respect to:
promotion prospects; total pay; relations with supervisor; job security; ability to work on own initiative; the actual work itself; and, the hours of work. Finally, a question was asked: “All things considered, how satisfied or dissatisfied are you with your present job overall”. In 1998 the satisfaction questions regarding promotion prospects, relations with boss and the use of initiative were discontinued. The overall satisfaction continued as previously subsequent to the four remaining questions. The impact this has on responses is currently being investigated.
Table 5: The Employing Organisation Year Private Public
1991 5.40 (1.57) 5.59 (1.40)
1992 5.41 (1.41) 5.55 (1.30)
1993 5.35 (1.39) 5.45 (1.33)
1994 5.30 (1.43) 5.37 (1.38)
1995 5.29 (1.39) 5.40 (1.29)
1996 5.36 (1.34) 5.42 (1.27)
1997 5.39 (1.32) 5.42 (1.27)
1998 5.29 (1.29) 5.35 (1.28)
Note:
§ Standard deviations are in parenthesis
§ From 1991 to 1997, all employees were asked to rate their level of satisfaction with respect to: promotion prospects; total pay; relations with supervisor; job security; ability to work on own initiative; the actual work itself; and, the hours of work. Finally, a question was asked: “All things considered, how satisfied or dissatisfied are you with your present job overall”. In 1998 the satisfaction questions regarding promotion prospects, relations with boss and the use of initiative were discontinued. The overall satisfaction continued as previously subsequent to the four remaining questions. The impact this has on responses is currently being investigated.
Intuitive note: so the fall in job satisfaction through the 90s has been more pronounced among public sector workers as a group, and among women as a group.
Figure 2: Job Satisfaction by Age
Figure 3: Job Satisfaction Over time by Gender
Job Satisfaction by Age
5.2 5.3 5.4 5.5 5.6 5.7 5.8 5.9 6.0
15 25 35 45 55 65
Age
Job Satisfaction By Gender
5.0 5.1 5.2 5.3 5.4 5.5 5.6 5.7 5.8
1990 1991 1992 1993 1994 1995 1996 1997 1998 1999
Year
Male Female
Figure 4: Job Satisfaction Over time by Employing Sector
Figure 5: Job Satisfaction Over time within the Public Sector
(note: sample sizes sometimes get smaller than ideal here)
Job Satisfaction in the Public and Private
Sectors
5.3 5.3 5.4 5.4 5.5 5.5 5.6 5.6 5.7
1990 1991 1992 1993 1994 1995 1996 1997 1998 1999
Year
Private Public
Job Satisfaction within the Public Sector
4.8 4.9 5.0 5.1 5.2 5.3 5.4 5.5 5.6 5.7 5.8 5.9
1 9 9 0 1 9 9 1 1 9 9 2 1 9 9 3 1 9 9 4 1 9 9 5 1 9 9 6 1997 1 9 9 8 1 9 9 9
Year
Central Govt Local Govt
Figure 6: Job Satisfaction Over time by Employing Sector
Job Satisfaction in the Public and Private
sectors
4.8
4.9
5.0
5.1
5.2
5.3
5.4
5.5
5.6
5.7
5.8
5.9
1990 1991 1992 1993 1994 1995 1996 1997 1998 1999
Year
Central Govt
Public Local Govt
NHS/Higher Education
Table 6: Ordered Logit Estimation of a Job Satisfaction Equation
Dependent Variable: Overall Job Satisfaction
The variables influencing j.s. Size of effect
Log(pay) 0.074
(1.95)
Hours/10 -0.173
(7.67)
Age -0.060
(5.56)
Age2/100 0.086
(6.33)
Job tenure -0.042
(5.98)
Job tenure2/100 0.119
(4.06)
O-Level -0.217
(3.87)
A-Level -0.405
(6.23)
HND, HNC -0.384
(4.59)
Degree -0.534
(6.39)
Higher Degree -0.300
(2.52)
Male -0.349
(8.39)
Ethnic -0.244
(2.64)
Workplace size:25-99 -0.187
(4.78)
Workplace size:100-499 -0.327
(7.66)
Workplace size:500 or more -0.266
(5.52)
Temporary Job -0.283
(5.40)
Union recognition -0.166
(4.33)
Public sector 0.166
(3.55)
Observations 32,904
Pseudo R2 0.026
Notes:
§ Controls for region, year, occupation, and marital status are also included (results not reported).
§ T-ratios are in parentheses. Standard errors are corrected for the repeat sampling of individuals.
§ The method by which the job satisfaction questions were asked was slightly changed in 1998. This issue is currently being investigated. Intuitive note: R-squared is low so we have a lot to learn.