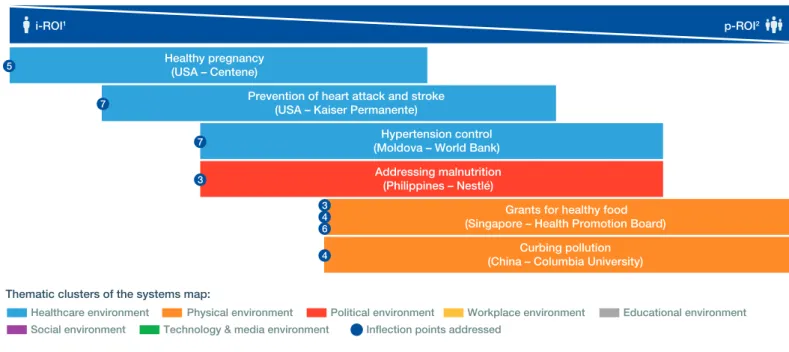
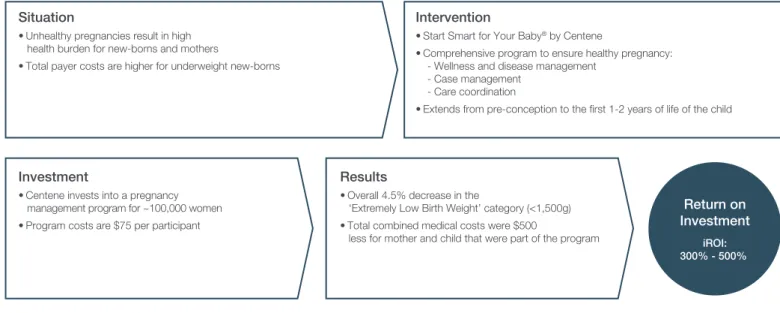
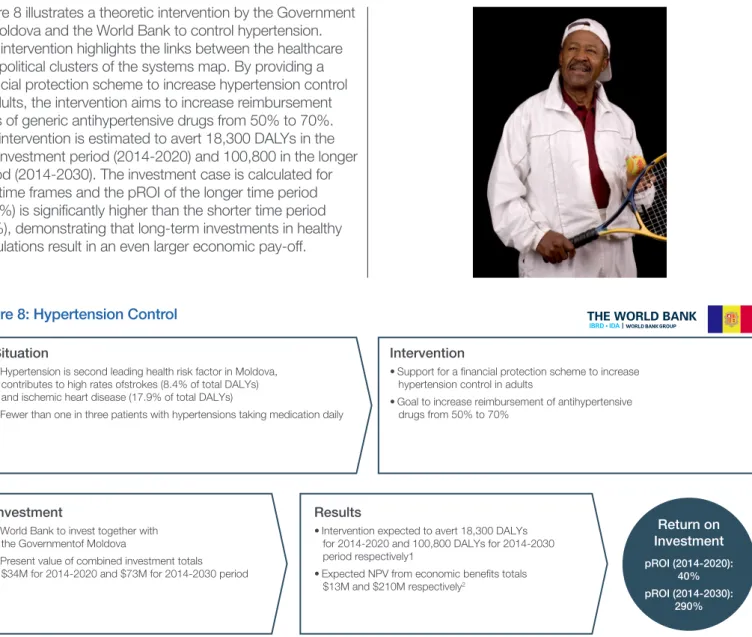
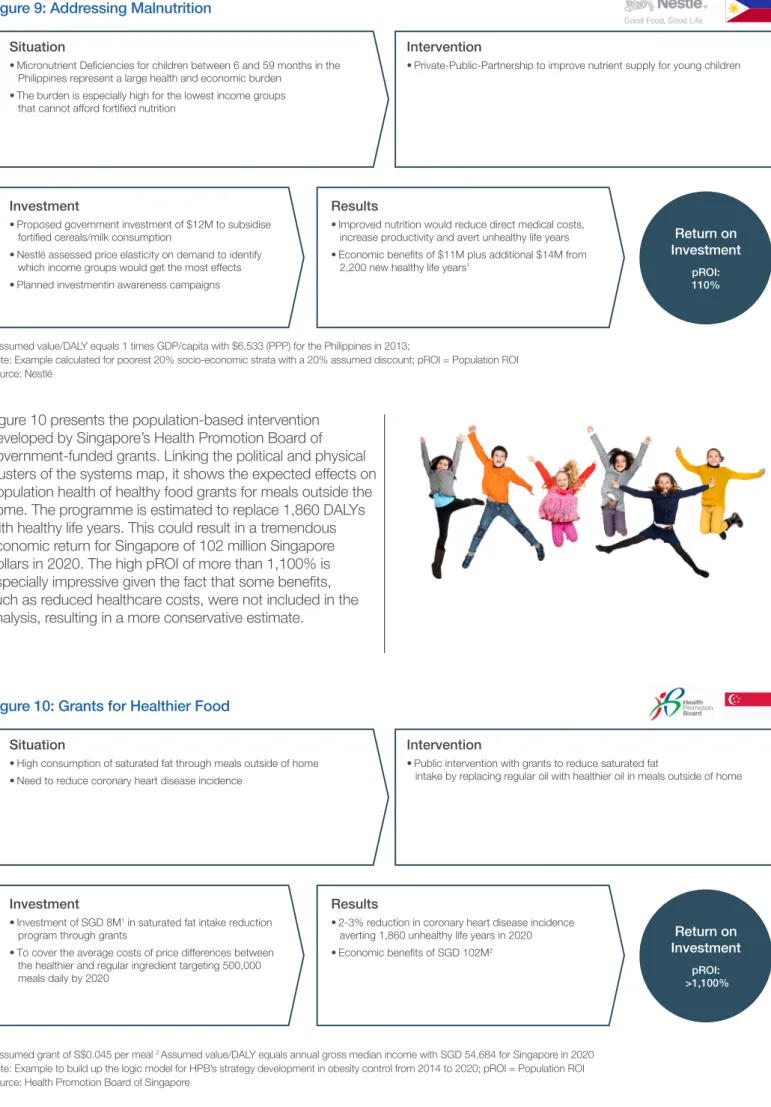
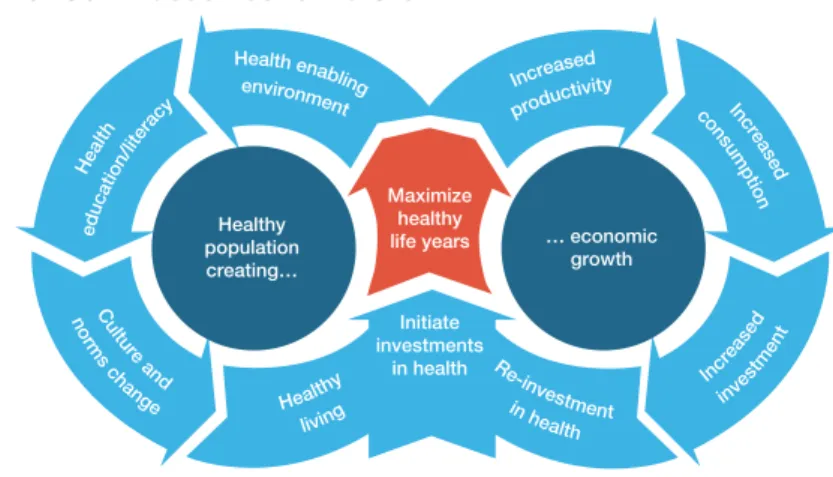
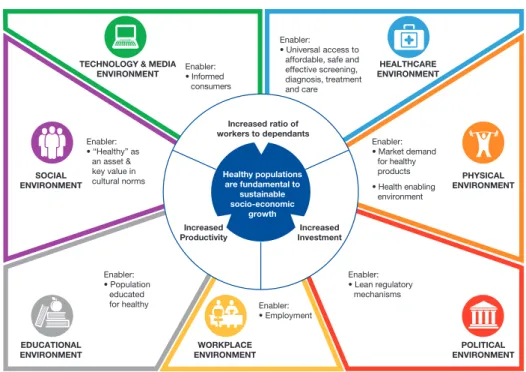
How To Create A Systems Map
Full text
Figure
Related documents
Figure 4.9 shows snapshots throughout the robot’s autonomous performance of Experiment I. After recognizing and opening the first drawer, the robot character- izes the environment
1) Person, yaitu sumber data yang bisa memberikan data berupa jawaban lisan melalui wawancara atau jawaban tertulis melalui angket. 2) Place, yaitu sumber data yang
Stepwise Multiple Regression was used to determine the importance of each independent variable separately in contributing to the mathematical model which includes
In normal data mode, if the mDSL Line Driver receives four seconds of unframed packets, it will restart and begin trying to re- establish a connection with the far end.. The
-Dinding belum diolah. -Belum ada tempat memajang karya murid. -Fasilitas rekreasi yang edukatif. -Fasilitas belajar yang menarik dan menyenangkan. -Tidak semua permainan
For the poorest farmers in eastern India, then, the benefits of groundwater irrigation have come through three routes: in large part, through purchased pump irrigation and, in a
The superiority which is styled sovereignty, and the independent political society which sovereignty implies, is distinguished from other superiority, and from other society, by
1. The result of the study is expected to be able to widen the skills of teachers in using ESP materials course design model in order to improve students’ speaking skill... b. As
