third of human-generated carbon dioxide (CO2), thus, a smaller amount of this greenhouse gas remains in the atmosphere and global warming is slowed. However, in the ocean the carbon dioxide reacts to form carbonic acid. The water turns more acidic and becomes a threat to big and small marine organisms. This brochure explains to students the chemical and physical processes that underlie ocean acidification through different experiments, and is intended to encourage pupils to give more thought to their own use of resources.
Since the Industrial Revolution of the mid-19th century, the human population has released around 440 billion tons of carbon dioxide (CO2) into the atmosphere from the burning of fossil fuels such as coal, natural gas and crude oil – equivalent to 440 million return flights from Germany to Australia!
Plants process this invisible and odourless gas into oxygen through photosynthesis. The oceans also act as “CO2 sinks“ by binding carbon dioxide. If these natural stores on our planet did not exist, it would heat up much more and much faster than what we observe today. Carbon dioxide is a dangerous greenhouse gas: Once it gets into the atmosphere, it reflects heat radiated from the earth and the climate starts to heat up.
The oceans slow down this global warming, however, the CO2 from the atmosphere reacts with seawater to form carbonic acid. As a result, the pH of the water decreases – it becomes more acidic.
Experiments and numerical model calculations clearly indicate that increasing carbon dioxide concentrations and the resulting ocean acidification have consequences for marine life: Corals, sea urchins, mussels and snails, as well as smaller organisms that build their skeletons and shells from calcium carbonate, will not be able to develop as they did before. In the Antarctic Ocean, researchers have already discovered plankton, whose shells are 35 per cent lighter than comparable specimens recovered from sediment cores dating back to times prior to industrialisation.
These microscopic organisms will be the first ones affected by ocean acidification. Plankton sits at the base of the food chain and serves as food for fish and other larger animals. In addition, their metabolism influences impor-tant chemical processes in the ocean. Ocean acidification disturbs the balance in these systems. It is still unclear what this means for our climate and our environment, therefore, scientists are working hard to better understand the process of ocean acidification and to better estimate its consequences.
The experiments in this booklet will help young people to understand the basics of ocean acidification. In the first half, all eight experiments are explained in great detail. Teachers will find information on the preparation and running of the experiments as well as answers to any questions. Starting on page 52, all of the experiments are prepared as worksheets for students.
In the first two experiments, students explore how carbon dioxide passes from the air into the water and from water into the air, and examine the influence of temperature on these processes. An indicator solution shows how the pH varies according to CO2 content. Then they learn that acidification takes place primarily at the boundary layer between the atmosphere and the ocean, and that the more acidic surface water can reach the deeper layers through convection processes.
So what is the primary direction in which the carbon dioxide moves? Molecules always move to where a lesser partial pressure prevails i.e. where the concentration is lower. Experiment 3 illustrates that even if the ocean does release CO2 in some warmer regions, the main direction is from the atmosphere into the ocean.
Overall, the ocean near the poles takes up more carbon dioxide than the tropical and subtropical oceans, as ano-ther experiment with hot and cold water shows. Due solely to their cold temperatures, the Arctic and Antarctic regions are particularly affected by ocean acidification. Researchers assume that the surface water will have tur-ned corrosive in some polar regions by 2018, thereby dissolving the shells of calcifying organisms.
The fifth experiment shows how seawater, in contrast to the freshwater in lakes and rivers, reacts to the rise in carbon dioxide. The saltier the water is, the slower its pH decreases. This so-called “buffering capacity“ of the seawater therefore depends on its salt content. However, the buffer capacity is not unlimited - even the saltiest sea becomes gradually more acidic.
Coccolithophorid Calcidiscus today...
organic carbon, DOC. The pH of the seawater is determined by the concentration of carbon dioxide, bicarbonate and carbonate. The sixth experiment leads to a deeper understanding of ocean chemistry and pH regulation. Like on land, photosynthesis also occurs in the ocean: marine microalgae, single-celled plants barely discernible by the naked eye, process carbon dioxide and use it for growth. This is demonstrated by an experiment with the microalgae Dunaliella sp. in seawater.
Finally, students explore the CO2 balance of their own environment. How much carbon dioxide does the air in their classroom contain? What factors can increase the CO2 concentrations, and which factors are capable of reducing it? The last experiment may trigger some thoughts on which of our actions lead to even more carbon dioxide into the atmosphere and how we can help to reduce this greenhouse gas.
2100
... under conditions that are expected for the year 2100.
A bit of chemistry
For the process of ocean acidification, two reactions are particularly important. These can occur simultaneously:
1. The formation of carbonic acid and the subsequent release of hydrogen ions:
CO
2+
H
2O
ļ
H
2CO
3ļ
H
++
HCO
3-carbon dioxide water carbonic acid hydrogen ions hydrogen carbonate ions 2. The reaction between carbonate ions, CO2 and water, resulting in bicarbonate ions:
CO
2+
H
2O + CO
32-ļ
2
HCO
3-carbon dioxide water carbonate ions bicarbonate ions
These reactions not only turn the water more acidic but also decrease the number of carbonate ions.
However, these ions are exactly what are needed by calcifying organisms, such as clams and corals, to build their shells and skeletons.
The pH scale
The pH indicates how acidic or basic (alkaline) a liquid is. It depends on the concentration of hydrogen ions in an aqueous solution. With increasing pH, the number of hydrogen ions decreases and rises with decreasing pH. Pure water has a pH of 7. Lower values are described as acidic, and higher ones as basic. Seawater currently has a pH between 7.8 and 8.5 and is therefore slightly basic. Since the pH is based on a logarithmic scale, a change from pH 8 to pH 7 corresponds to a tenfold increase in acidity i.e. hydrogen ion concentration. If the pH of a liquid changes from 7 to 6, there are ten times as many additional hydrogen ions as in a change from pH 8 to pH 7.
Tip: Making seawater
Some of the experiments are carried out with seawater. If no seawater is readily available, it can be easily made using a salt mixture from the pet shop. The aim is to achieve a salinity of 35. Any water to be used for the expe-riments, i.e. freshly mixed “seawater“, tap water or distilled water, should be left overnight in an open container so that the carbon dioxide content can equilibrate with the ambient air. Unless otherwise specified in the instruc-tions, the water used for the experiments should always be at room temperature.
Scientists now report salinity as a dimensionless quantity - the unit, psu (practical salinity units) is no longer used. The older unit, ppt (parts per thousand or per mille), is also no longer in use. A salinity of 35 corresponds to 35 grams of salt per litre of water.
Right-hand Figure:
The global carbon dioxide budget for the years 1990 to 2000 (blue) and 2000 to 2009 (red), expressed in gigatons per year. Carbon dioxide (CO2) is emitted to the atmosphere due to deforestation and other
chan-ocean sink
2,2 ± 0,4
2,3 ± 0,5
4,1 ± 0,1
changes
in land use
1,6 ± 0,7
1,1 ± 0,7
land sink
2,6 ± 0,9
2,4 ± 1,0
use of fossil fuels
6,4 ± 0,4
7,7 ± 0,5
The gas exchange between ocean and atmosphere
The oceans exchange gases such as oxygen and carbon dioxide (CO2) with the atmosphere. This occurs at the boundary layer where the air and surface waters meet. In addition to temperature, the corresponding CO2 pressure and chemical reactions between already-dissolved carbon dioxide and other dissolved material in the water determine how much CO2 the ocean can absorb. Various other biological and physical processes determine the release or uptake of CO2.
This experiment illustrates the exchange of gases between water and the atmosphere and how the concentration of gases in these media is always maintained in balance. The effect of temperature on this process will also be observed. Students learn that the oceans give off CO2 in the warm waters near the equator, while the cold polar oceans can absorb considerably more CO2.
summary
Preparation time: 10 minutes
Activity time: 10 minutes for setting up, 1 hour for observation
For pupils aged: 10 – 14 years
Application: physics or chemistry lesson, after-school activity
Time for data analysis
and discussion: 20 minutes
Prior knowledge required: factors affecting gas solubility
Degree of difficulty: easy
Safety note: although the universal indicator is not toxic, the pupils should only blow air into the bottles and avoid sucking up the liquid
materials
3 bottles or flasks of the same size (any material or size will do) 3 beakers or drinking glasses large enough for the bottles to fit in 1 drinking straw
1 small pipette
universal indicator (McCrumb)
water: distilled water, tap water or seawater are suitable hot water
ice cubes
p
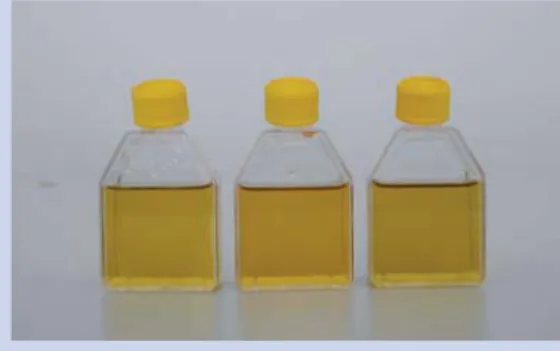
1. Fill the bottles half-full with water. Use either distilled water, tap water or seawater in all three bottles.
Put several drops of indicator solution into the bottles with the pipette until the water in the bottles has reached the same shade of green. Be sure to add the same amount of indicator in all bottles. The amount of indicator depends on what water is used and its volume.
2. The air you exhale contains carbon dioxide. Use the drinking straw to blow air into the bottles until the colour changes from green to yellow. This means that the pH of the water has changed from basic to acidic. Keep blowing air through the straw until there is no further co-lour change.
3. Fill one beaker half-full with water at room temperature, the second beaker half-full with hot water and the last beaker with ice water.
4. Put one uncapped bottle in each beaker and observe the change in colour of the water inside the bottles. Depending on the temperature of your water bath, this may take about an hour until the change becomes visible.
procedure
Figure 1: The bottles with distilled water and McCrumb Indicator
Figure 2: CO2 was added by blowing air into the bottles. The
yellow colour indicates that the water became more acidic.
results
1. Did the colour of the water in the bottles change? 2. What does the colour change in the bottles mean?
Figure 3: The bottles are placed uncapped in water baths of different temperatures.
notes
1. The water in the bottle placed in the hot water bath changed gradually from yellow to green. This means that the dissolved CO2 escaped back to the air making the water more basic. This demonstrates partly why CO2 in low latitude waters is degassed out of the water. In this region, cold newly upwelled, CO2-rich deep water is warmed thus releasing CO2 into the atmosphere.
2. High temperatures decrease the solubility of gases in water and consequently lead to the release of dissolved gases to the atmosphere. Cold water is able to take up a larger amount of gas. The Arctic and the Antarctic Oceans are therefore able to absorb much more carbon dioxide than equatorial waters, where gasses are emitted back to the atmosphere.
further experiments
1. Compare the results between distilled water, tap water and seawater. Distilled water will change to a more intensive yellow colour than tap water and seawater. These two contain calcium carbonate (lime) that buffers the acidification.
2. To investigate how the size of the surface area where water and air interact influences the degassing process, bottles or containers with different diameters can be used. Add the same amount of water to every container. Observe how fast the colour changes. The container with the largest diameter will also be the shallowest. The colour here will change back to green quicker than in containers with smaller diameters. After this experiment, you can draw attention to the fact that oceans cover 71 per cent of the earth’s surface offering a large area for CO2 exchange.
Figure 4: The green shade indicates that the water in the bottle with the hot water bath has already released CO2
Acidification in the boundary layer between ocean and atmosphere
In lakes, rivers or the ocean, there is a constant exchange of gases between the air and the surface waters. Depending on the temperature and the amount of carbon dioxide (CO2) already dissolved, the water either absorbs CO2 from the atmosphere or releases it to the atmosphere. Captured carbon dioxide can be transported into deeper layers when the surface waters are cooled, become heavier and then sink – we then talk about the ocean as a carbon “sink“. If this does not occur, the dissolved gas remains at the surface and equilibration takes place with the atmosphere.
This experiment illustrates the gas exchange at the interface between water and air. It also shows how tempera-ture affects the process. Observations made during the experiment can thus illustrate the processes which occur at the interface between ocean and atmosphere.
summary
Preparation time: 15 minutes
Activity time: 15 minutes
For pupils aged: 10 – 14 years
Application: physics or chemistry lesson, after-school activity
Time for data analysis
and discussion: 15 minutes
Prior knowledge required: acid-base interaction, concept of indicators
Degree of difficulty: easy
Safety note: since matches and candles are used, this experiment should be performed under the supervision of an adult.
materials
6 salad bowls of the same diameter distilled water at room temperature frozen distilled water (ice cubes)
12 floating candles or tealight candles, preferably white matches
white background (paper, napkin, kitchen towel) universal indicator (McCrumb)
pipette
To save on materials, the experiment can be carried out in parts one after the other. In this case, only two salad bowls of the same size and four candles are necessary. It is essential to use water which has equi-librated with the surrounding air. Place the water in an open container and leave it to stand in the room overnight, better still outdoors. To speed the process up, the water can be aerated using an aquarium pump.
p
1. Place three bowls on top of the white paper. Fill these with the same volume of distilled water. These bowls represent three oceans. Cool one bowl by adding the frozen distilled water (ice cubes). It is important that all three bowls are filled to the same level, about two-thirds. Add the same amount of indicator to each bowl. Make sure that they have the same intensity of green colour.
2. Light eight candles and place four in the bowl with frozen distilled water and four in another bowl. Put the four unlit candles in the third bowl. This will serve as your control. Cover the bowls with the remaining empty bowls. Note the colour of the water at the start of the experiment.
3. Watch how the candles burn out and how the colour of the water in the bowls changes. This will take a few minutes. Look closely at the boundary between air and water. Can you explain why the candles burn out? What gas do the candles release when they burn? If necessary, explain that the candles burn out because they had used up the oxygen trapped in the bowls and that they release carbon dioxide when they burn.
procedure
Figure 1: Bowl of water with green indicator.
Figure 2: Four burning candles float in the bowl with green indicator.
results
1. What colour change did you observe? What does it indicate?
2. Where does the colour change take place? Did all the water in the bowl change its colour? What does this imply in relation to the oceans?
Figure 3 and 4: The bowl with the burning candles is co-vered with a second bowl. After several minutes, the candles burn out themselves.
notes
1. The colour change from green to yellow (and the change of the pH from basic to acidic) occurs only at the water surface which has direct contact with the air above it. The carbon dioxide produced by the burning candles dissolves at the water surface making it acidic. Since there was no CO2 introduced into the control bowl, where there were no lit candles, there should be no change in the colour of the water there.
2. Without agitation, the yellow, more acidic water remains at the surface and does not readily diffuse to the deeper part of the bowl. In the ocean, CO2 dissolved at the surface is only effectively removed from the atmos-phere if this CO2 is physically transported to the deeper layers by convection.
3. The cooled water in one bowl should be more intensive yellow because of the higher solubility of gases in cold water. However, since the water in the bowl has a uniform temperature, there is no transport of the acidic water to the bottom of the bowl.
4. In this experiment, distilled water was deliberately used to show the pH change at the surface of the water using the universal indicator. Seawater cannot be used for this experiment because the indicator is not sensitive enough to a small pH drop. The buffering capacity of seawater will lead to a smaller change in pH compared to distilled water.
5. The experiment can be repeated using the same materials. Remove the covering bowl and stir the water to encourage faster equilibration with the air. The water will turn green and the experiment can be repeated.
Figure 6 and 7: After several minutes, the candles burn out and a thin yellow layer becomes visible at the surface. This indicates, that the water at the surface is more acidic than the water further down in the bowl.
Figure 5: Colour of the water before the experiment with burning candles.
a further experiment
Remove the covering bowl and let the setup stand for a while. Observe the colour change at the surface of the water: After several minutes, the yellow colour will disappear because equilibration with the surrounding air, which has a lower concentration of carbon dioxide, has occurred.
Acidification of the oceans
-The increase in carbon dioxide partial pressure in the atmosphere
Rising carbon dioxide concentrations in the air also mean an increasing partial pressure of carbon dioxide (CO2) in the atmosphere i.e. an increasing proportion of this gas within the gas mixture in the atmosphere. In order to restore the balance of the CO2 partial pressure between the atmosphere and the ocean, the CO2 diffuses to where the partial pressure is lower: This means diffusion of CO2 from the atmosphere into the ocean. In this straight-forward experiment, we see the impact of the steady increase in CO2 partial pressure in the air on the ocean.
summary
Preparation time: 10 minutes
Activity time: 10 – 20 minutes
For pupils aged: 12 – 18 years
Application: physics, chemistry or geography lesson, after-school activity
Time for data analysis
and discussion: 20 minutes
Prior knowledge required: basic knowledge about acids and bases
Degree of difficulty: easy
materials
2 large test tubes
2 rubber stoppers with 2 holes for the test tubes
2 glass tubes which fit into the holes in the rubber stoppers 2 thermometers
a small amount of modelling clay 1 rubber tube
test tube rack
universal indicator (McCrumb)
tap water or seawater, and distilled water at room temperature effervescent vitamin tablets, split into quarters
p
1. Insert one glass tube and a thermometer into the holes of each rubber stopper. Connect the two glass tubes in each plug with the rubber tubing.
2. Close the test tubes with the rubber stoppers. Make your setup airtight using modelling clay to plug the air space on the holes of the stopper where you inserted the thermo-meters and the glass tubes. Note down the temperature of the air inside the test tubes as soon as it has stabilised.
3. Fill one test tube half-full with distilled water and add some drops of indicator until the water is a dark shade of green. Replace the stopper making sure that the thermometer does not touch the water. Place the test tube in the rack. This is test tube A.
4. Put one quarter of an effervescent tablet in the other test tube and add a generous amount of tap water to cover the tablet. Close the test tube immediately with the rubber stopper. Place the test tube in the rack next to the first one. This is test tube B.
5. Note down the temperature of the air inside the two test tubes.
6. Look at the colour of the water with the indicator in test tube A. Do you already notice a change?
7. Put another quarter of the effervescent tablet into test tube B and close it immediately. Wait about 3 to 5 minutes and observe the colour of the water in test tube A again. Do you observe a change now? Keep adding a quarter of an effervescent tablet until the colour changes waiting for at least 5 minutes after each addition. Write down the temperature every time you add another quarter.
8. Repeat the experiment with seawater or tap water.
procedure
Figure 1: The green colour of the water in test tube A is due to the added indicator.
Figure 2: An effervescent tablet bubbles inside test tube B.
Figure 5: Change of colour after the addition of the first Figure 3: Measuring the temperature.
results
1. Describe any changes in colour of the water in test tube A after the first quarter of an effervescent tablet was dissolved in test tube B. What happened after adding another quarter? And another? What does the visible change mean?
2. What happened to the temperature in the test tubes after the effervescent tablets were added? What does this temperature rise indicate?
3. At what temperature does the colour change at the surface of the distilled water become visible? How does this compare to when tap water or seawater is used? Can you explain any differences?
experimental setup
A
B
rubber tube thermometer glass tube water with indicatorquarter of an effervescent tablet observations temp (°C) colour /pH temp (°C) colour /pH temp (°C) colour /pH temp (°C) colour /pH temp (°C) colour /pH temp (°C) colour /pH addition of effervescent tablets
0 1/4 1/2 3/4 1 1 1/4
distilled water water
notes
1. The effervescent tablet contains solid sodium hydrogen carbonate and solid citric acid. When water is added to the tablet, these solids dissolve, dissociate into ions and carbon dioxide is released. The carbon dioxide increases the pressure in test tube B, and the gas is forced into test tube A. The carbon dioxide reacts with the water in test tube A forming carbonic acid.
2. The addition of quarters of the effervescent tablets simulates the ever-increasing CO2 in the atmosphere. The initial increase of CO2 after addition of the first quarter tablet does not necessarily lead to acidification of the water in test tube A. However, after subsequent addition of more tablets the concentration of CO2 increases leading to the colour change (lowered pH) of the water in test tube A. The temperature in test tube B increases because the pressure inside the test tube rises. The dissolution of an effervescent tablet is an endothermic process (energy/heat is absorbed from the surroundings), but the increased pressure neutralizes this effect.
3. The higher the pressure, the higher the temperature: The water in test tube A starts becoming more acidic as soon as the temperature inside increases due to increasing CO2 pressure. This happens faster when distilled water is used instead of tap water or sea water.
4. At the beginning of the experiment, no change is observed when tap water or seawater is used because they are able to buffer the acidification process. Tap water is buffered by the high calcium carbonate content and seawater is buffered by the carbonate system, but when the partial pressure of carbon dioxide continues to rise, even tap water and seawater will become acidic. Tap water in your area may be “soft” meaning it does not contain much calcium carbonate. In this case, the water may turn acidic faster.
5. The acidic water at the surface of test tube A does not sink to deeper parts automatically. In the ocean, it also stays at the surface unless it is transported to the deeper waters by convection. This leads to more acidic surface waters affecting a number of surface water dwelling organisms.
6. As an additional experiment, you can cool the upper part of test tube A by placing ice cubes on the outside wall of the test tube. Remove the tube connecting the two test tubes to cut off the CO2 supply to test tube A. Only cool the part where you find the more acidic water. After some time, you can watch how the water sinks down to the lower part of the test tube. In the ocean, the absorbed CO2 is also transported to deeper layers when the water gets cooler.
How does the temperature affect the solubility of CO
2in water?
If the proportion of carbon dioxide (CO2) in the atmosphere increases, the temperature of the air and the ocean will also increase due to the greenhouse effect. Do these increasing water temperatures have a positive or negative effect on the ability of the water to absorb CO2? Will this effect be observed globally or regionally?
This simple experiment illustrates that cold water dissolves larger volumes of gas than warm water. When we relate this to the oceans, it means that polar regions are capable of absorbing particularly large volumes of carbon dioxide. On the one hand, they act as CO2 sinks and thereby slow down climate change. On the other hand, increasing CO2 concentrations have adverse effects on organisms in the water. In the tropics and subtropics, the ocean even releases CO2 into the atmosphere. In terms of global temperature rise, this means that the warmer the water of our oceans is, the less CO2 it can absorb.
summary
Preparation time: 10 minutes
Activity time: 15 – 20 minutes
For pupils aged: 11 – 16 years
Application: chemistry, physics or, geography lesson, or after-school activity
Time for data analysis
and discussion: 20 minutes
Prior knowledge required: none
Degree of difficulty: easy
materials
large transparent bowl or an aquarium 250 ml transparent graduated cylinder funnel
petri dish covers
stand and clamp (optional) ice cubes / cold water water heater / warm water effervescent tablets
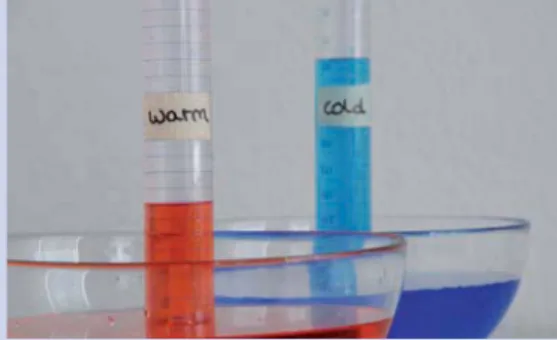
It is easier to compare the experiment with warm and cold water if you do both experiments simultaneously. Colour the water with food colouring (e.g. blue and red) to distinguish the warm and cold experiments and see the results more effectively.
p
procedure
1. Fill the bowl half-full with cold or warm water.
2. Fill the graduated cylinder to the brim with water from the bowl and place it carefully upside down in the bowl. Be sure that no water spills out of the cylinder so that no air bubbles are formed. To do this, cover the opening of the full cylinder with a petri dish, invert the cylinder and immerse this in the bowl. Remove the petri dish after the mouth of the cylinder is already under water.
3. Tilt the graduated cylinder and place the funnel in the opening of the cylinder taking care that there is minimal space between the funnel and the opening of the cylinder and hold it in place. Eventually, the cylinder should sit safely on the funnel.
4. Place an effervescent tablet carefully but quickly under the funnel. This dissolves immediately in the water. Observe how an air pocket develops at the top of the upside down cylinder. Record the volume of the air space formed in the table below. Repeat the trial several times. For each trial discard the used water and replace this with the same volume of fresh water.
5. Compare the results you get when using warm and cold water and record your results in the table. What happens with the air space when warm water is used?
Figure 1: Covering the cylinder mouth with a petri dish.
Figure 2: Replacement of the petri dish cover with a funnel.
Figure 3: Holding the cylinders to keep them in place.
Figure 4: Comparison of the cylinders. Adding colour to the water will make comparisons easier.
formation of an air space inside the graduated cylinder number of effervescent tablets volume of air space formed (ml)
trial number cold water warm water
1 2 3
results
1. Which produces a larger volume of air space inside the graduated cylinder, cold water or warm water?
2. What will be the consequence of a warming ocean? How will this affect the role of the oceans as a CO2 sink?
3. In which areas of the world will you expect more CO2 uptake into the ocean? Where will it be less?
notes
1. When the effervescent tablets dissolve in water, the carbon dioxide bubbles are produced and rise. Water has a limited inherent capacity to dissolve gases. The volume of the air space formed in the graduated cylinder is equal to the volume of CO2(and other gases), which cannot be dissolved in the water anymore because it is saturated. The gas released during the initial dissolution of the tablet will dissolve in the water. Once the water becomes saturated with gas, further gas released will no longer dissolve in the water and will form an air bubble, displacing water inside the cylinder.
2. The solubility of gases decreases with increasing temperature, so the air space inside the cylinder when warm water was used will be bigger compared to when cold water was used.
3. The Northern Atlantic and Antarctic Oceans act as major sinks of CO2 because they are colder than other seas. In addition, cold water is denser than warm water, causing it to sink, therefore the carbon dioxide taken up at the surface can be transported to the deeper waters by convection.
4. Warm equatorial waters tend to release CO2into the atmosphere. In these regions upwelling of CO2-rich deep waters occurs. When the water reaches the surface, it is warmed decreasing gas solubility therefore leading to the degassing of CO2.
further experiments
1. Try the experiment with different salinities. The effect of salinity is however not as great as temperature, so use very different salinities e.g., compare distilled water with seawater (salinity: 35).
2. Try adding two tablets, one after the other, to the same funnel. Use the same water temperature. The students will assume that a tablet will always produce the same volume of air inside the cylinder. The second tablet will, however, produce a larger volume of air because the water is already saturated. This will demons-trate that water has a limited capacity to take up gases.
3. With this experiment, you can even show how the pH influences the amount of CO2 that can be taken up by the water. To do this, run this experiment with normal water and with water acidified with vinegar.
The effects of increased CO
2concentration in the air on seawater
and distilled water
More than 70 per cent of the earth’s surface is covered with water - we truly live on a blue planet! Only about three per cent of this is fresh water, whereas the remaining 67 per cent consist of more or less salty seawater. How do rising carbon dioxide concentrations in the atmosphere affect the pH of seawater and bodies of freshwater, such as lakes and rivers? This experiment shows that salinity has an impact on how oceans and lakes respond to carbon dioxide (CO2), which reaches the water from the air. It is clear that seawater can withstand acidification longer than fresh water.
In this experiment you will use distilled water (pure water containing no dissolved ions or other components) and seawater, to compare how they react to rising CO2 levels in the air.
summary
Preparation time: 15 minutes
Activity time: 30 minutes
For pupils aged: 11 – 15 years
Application: chemistry lesson, after-school activity
Time for data analysis
and discussion: 30 minutes
Prior knowledge required: concept of acids and bases
Degree of difficulty: medium
Safety notes: since matches and candles are used, this experiment should be performed under adult supervision
materials
large transparent basin or a large aquarium 2 beakers (500 ml)
2 pH meters aquarium pump
plastic tubing and 2 airstones with regulator valves seawater*, distilled water*
5 tealight candles matches
stopwatch
* Leave the water to stand overnight in an open container to allow it to equilibrate with the surrounding air. Aerating the water with the aquarium pump is also advisable.
p
procedure
1. Fill one beaker half-full with seawater and the other half full with distilled water. Aerate the water in the bea-kers with the airstones connected to the aquarium pump. Regulate the aeration with the valves so that both beakers are bubbled with air to the same degree.
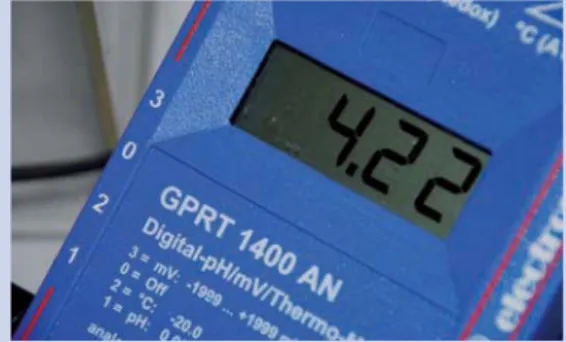
2. Place one pH electrode in each beaker and connect these to the pH meters. Make an initial reading and record this in the table.
3. Light the candles and place them next to the beakers. Place the entire setup under the inverted aquarium. The aquarium pump should also be inside the aquarium. If the aquarium is not big enough, the pH meters can be placed outside.
4. Record the pH of the water in the beakers for 10 minutes at 1-minute intervals. Note down the time when all the candles burn out.
5. Make a graph of the results you recorded in the table.
Figure 1: The same amount of bubbling in the two beakers.
Figure 2: The initial pH is recorded.
Figure 3: The burning candles are placed next to the beakers.
experimental setup
aquarium pump inverted aquarium candles regulator valve pH electrode airstone pH meter pH meterD = distilled water S = seawater
7,00
D
S
8,00pH of the water in the beakers
time (minutes) pH
seawater distilled water 0 1 2 3 4 5 6 7 8 9 10 11 12 13 14 8,00 7,50 7,00 6,50 6,00 5,50 5,00 4,50 4,00
1 2 3 4 5 6 7 8 9 10 11 0
pH
time (minutes)
notes
1. The decrease in pH of the distilled water is faster and greater than that of the seawater.
pH of the water in the beakers over time
In our example, the pH of the distilled water changed from 6.5 to 4.6 within ten minutes, whereas the seawater pH decreased from 7.8 to 7 for the same duration. The change in pH can be calculated as pH at the start of the experiment (pHt0) minus the pH at a given time (pHtn). Ask the students to draw a graph and plot the change in pH over time.
pH change in the beakers
0 2 4 6 8 10 12 14
0 0,2 0,8 1 1,2 1,4 1,6 1,8 pH change
time (minutes)
seawater distilled water 0,4 0,6 20 2 4 6 8 10 12 14
4 4,5 5 5,5 6 6,5 7 7,5 8
pH
time (minutes)
seawater distilled waterresults
1. In which beaker was there a greater change in pH? Did the water become more basic or acidic? 2. Many aquatic organisms cannot tolerate big pH changes in their environment. What do you think will be the effect of a high CO2 environment to organisms in a lake and in the ocean?
3. Why should the water in the beakers be aerated? Why should the pump also be placed inside the inverted aquarium?
4. What do the burning candles do to the air inside the aquarium? Where does the oxygen go? What gas do the burning candles produce?
Another way of showing the change in pH is by multiplying the values for the graph above by -1. Plotting the results will give:
pH change in the beakers
distilled water
0 2 4 6 8 10 12 14
-2 -1
pH change
time (minutes)
seawater 0
2. The water should be aerated by a pump, which is placed inside the aquarium. By placing the pump under the inverted aquarium together with the candles, air will be pumped from inside the aquarium into the water. Bubbling also increases the contact between the air inside the aquarium and the water and so more gas dissolves into the water.
3. Alkalinity is a measure of the ability of water to resist pH changes. The buffering capacity (alkalinity) of water depends on the carbonate system as well as on the dissolved ions in the water.
4. Some lakes have “hard water” containing high magnesium and calcium concentrations and these exhibit high alkalinities. On the other hand, some have “soft water” with low salinity, specifically low in calcium and magne-sium and only a small amount of dissolved salts. Their alkalinities are low. Seawater has a high salinity (35), high alkalinity and therefore a high buffering capacity.
5. Lakes can either be sinks or sources of CO2. Since most lakes are acidic, receiving acidic water from run-off of terrestrial origin as well as from acidic “wet” (rain, snow, fog) and “dry” (gas, particles) precipitation, CO2 plays only a minor role in lake acidification. However, lakes are sensitive to the effects of CO2 because they are shallower and have smaller volumes compared to the oceans, where dilution and convection can mitigate high CO2 inputs both from the atmosphere and land.
further experiments
1. If time allows, continue to record the pH until no further changes can be measured. Take note of how long it takes and what the final pH of the water in the two beakers is. After some time the pH in both beakers will stabilise corresponding to the point when the amount of CO2 in the air and in the water is in equilibrium.
2. Collect water from different lakes or sources to compare the buffering capacity of each lakes. See if you can find “hard water” and “soft water” lakes.
3. Compare the buffering capacity of water with different salinities by dissolving different amounts of sea salt in water.
pH regulation in seawater: The role of carbonate (CO
32-) and
bicarbonate (HCO
3-)
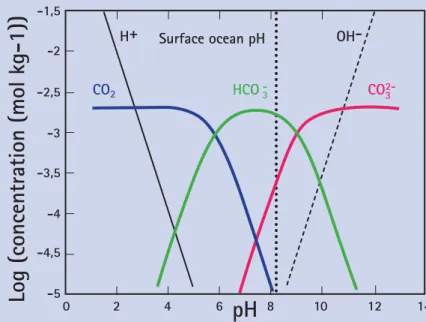
Dissolved inorganic carbon (DIC) represents the largest carbon pool in the ocean. This reservoir includes the dissolved carbon dioxide (CO2) and bicarbonate (HCO3-) and carbonate ions (CO32-). The pH of seawater depends on the relative proportions of these components. The pH of our oceans is currently in the basic range, 7.8 to 8.5, where HCO3- ions dominate. If the pH increases, the concentration of carbonate ions also increases. If more CO2 dissolves in seawater, it turns more acidic and the pH drops. The chemical reaction in water forms carbonic acid (H2CO3). This is relatively unstable and dissociates immediately into bicarbonate and hydrogen ions. Some of the hydrogen ions produced during decomposition of carbonic acid react with further with carbonate to form addi-tional bicarbonate ions. The concentration of carbonate ions decreases accordingly.
The ions are responsible for the buffering function of seawater. Seawater can resist significant fluctuations in pH, even after addition of weak bases or acids. The carbonate ions can react with the large quantities of calcium ions present in seawater. This reaction generates calcium carbonate (limestone, CaCO3), the material which mussel shells, coral skeletons and shells of some microalgae are made of. This experiment illustrates how bicarbonate and carbonate regulate the pH of seawater, and clearly demonstrates how seawater can buffer pH changes.
summary
Preparation time: 5 minutes
Activity time: 30 minutes
For pupils aged: 10 – 16 years
Application: physics or chemistry lesson, after-school activity
Time for data analysis
and discussion: 20 minutes
Prior knowledge required: acid-base interaction, concept of indicators
Degree of difficulty: medium
Safety note: although the universal indicator is not toxic, the pupils should only blow air into the bottles and avoid sucking up the liquid
materials
3 to 6 bottles of the same size with lids distilled water
seawater
6 drinking straws
sodium carbonate (Na2CO3)
sodium bicarbonate (baking soda, NaHCO3) universal indicator (McCrumb) with colour chart pipette
eggshells (optional)
p
procedure
1. Fill three bottles with the equal amounts of seawater and the other three with the same amount of distilled water. Add a small pinch of sodium carbonate to one of the bottles containing seawater and to one containing distilled water. Do the same for the sodium bicarbonate.
2. Compare the colours of the water inside the bottles. Do you see any differences?
3. Add 20 drops of the McCrumb indicator solution to each bottle. Determine the pH of the water in each bottle using the colour chart. Can you see any differences now?
4. Insert drinking straws through the openings of the bottles making sure that they are immersed in the water.
5. Blow air through the drinking straw to introduce CO2 into the bottles. Try to blow uniformly for 20 seconds into each bottle. Replace the lids of the bottles and determine the pH. Record the pH in the table below.
6. Repeat step 5 but instead blow for 40 seconds and 60 seconds into the bottles. Do you notice any differences?
Figure 1: The six bottles after the indicator is added.
Figure 3: The colour of the water after blowing into the bottles for 60 seconds.
H+ Surface ocean pH
OH-0 2 4 6 8 10 12 14
-5 -4,5 -4 -3,5 -3 -2,5 -2 -1,5 CO 2-3 HCO
-3
CO2
pH
Log (concentration (mol kg-1))
Figure 4: If the amount of dissolved CO2 increases, the
pH is low. At higher pH, bicarbonate and carbonate are the dominant species.
Figure 2: The colour of the water after blowing into the bottles for 20 seconds.
results
1. Do you notice any differences in the appearance of the water in the different bottles before the addition of the indicator solution?
2. Compare the pH of the water in the different bottles. How did the addition of sodium carbonate and sodium bicarbonate to seawater and distilled water prior to bubbling with CO2 affect the pH?
3. What happens to the pH of the water in the bottles after blowing in CO2 into them? Does addition of sodium carbonate and sodium bicarbonate to seawater and to distilled water make any difference with regard to pH changes?
4. Eggshells are made of CaCO3. Add powdered eggshells to the acidic seawater and to the acidic distilled water. Do you notice any changes in the pH? Why? What is the difference between the carbonate - in the powdered eggshell and in Na2CO3?
5. Can you now make a conclusion about the roles of bicarbonate and carbonate - in the buffering capacity of seawater?
estimated pH (see colour chart) initial colour after addition of
indicator
after blowing for 20 seconds
after blowing for 40 seconds
after blowing for 60 seconds water samples
seawater seawater with NaHCO3
seawater with Na2CO3 distilled water distilled water with NaHCO3 distilled water with Na2CO3
notes
1. Even just a small pinch of Na2CO3 can cause a supersaturation of the seawater with carbonate. The pupils may get a cloudy solution when Na2CO3 is added to seawater (supersaturation means that the given volume of solvent, in this case seawater, already contains more of the dissolved material, here Na2CO3, than it can normally dissolve). This will not be observed for distilled water.
2. Upon addition of the indicator solution, the pupils will see differences in what seemed to be similar looking water samples.
3. The table below shows the estimated pH of the different water samples after addition of different amounts of CO2, varied by different durations of blowing into the sample. If the teacher has a way of adding exact amounts of CO2 to the samples, for example from a CO2 cylinder, then it is advised to do this, especially for older pupils. It is also recommended to test the pH of the seawater and the distilled water which will be used for the experiment beforehand. The seawater should have a pH of about 8 and distilled water a pH of 7. If this is not the case, transfer the water samples in containers with large openings or bowls and let the samples stand overnight or alternatively aerate the samples. This way, the gases in the samples will equilibrate with those in the air.
From the table above, it is apparent that the pH of distilled water changes quite rapidly when CO2 is added. The pH change of seawater is not as quick and not as large. However, further addition of CO2 may also lower the pH of seawater to the acidic range. In both seawater and distilled water, no pH changes can be observed when NaHCO3 or Na2CO3 is added.
4. The addition of eggshells to the acidic seawater and distilled water will not cause any pH changes in the water sample even though eggshells are made of CaCO3. The reason is, that the carbonate in the eggshell is not dissolved. Remind the pupils that the pH of seawater is determined by the dissolved inorganic carbon species in seawater.
estimated pH (see colour chart) initial colour after addition of
indicator
after blowing for 20 seconds water samples
seawater clear 8 7 7 6-7 seawater clear 8 8 8 8 with NaHCO3
seawater clear 12 12 12 12 with Na2CO3 (may be cloudy)
distilled clear 7 5 4 3-4 water
distilled clear 8 8 8 8 water with
NaHCO3
distilled clear 12 12 12 12 water with
Na2CO3
after blowing for 40 seconds
after blowing for 60 seconds
further experiments
1. Let the pupils determine pH changes in distilled water samples with increasing concentrations of Na2CO3. If you have a good balance in school, weigh different amounts of Na2CO3 and add this to the distilled water. Then blow CO2 into the samples as described above. The pupils will observe that the less Na2CO3 they add, the more the pH of the sample will change with addition of CO2. Explain to them that seawater also has a limited amount of CO32- and that the capacity of the ocean to take up CO2 is not unlimited.
2. Let pupils design their own experiments with the water samples. Let them find out what happens to the pH of a water sample with NaHCO3, if you add Na2CO3, and what happens if they add them in the other order. This will show them that the pH of the water is dependent on which form of the dissolved inorganic carbon ion is predominant. This exercise can also lead them to understand that addition of HCO3- to supersaturation will not make the water more basic and it can even make the water less basic (not more acidic) if added in excess to a basic solution containing Na2CO3. This is best seen in the graph at the start of this activity.
National Center for Atmospheric Research Community Climate System Model 3.1 (CCSM3) modelled decadal mean pH at the sea surface for 1875, 1995, 2050 and 2095.
Source: after Feely et al., Oceanography (2009).
Carbon dioxide fertilization of marine microalgae cultures (Dunaliella sp.)
Tiny, single-celled plants that live in seawater called marine microalgae, need carbon dioxide (CO2) in order to grow. Like plants on land, they help to remove CO2 from the air, and thus contribute to the function of the ocean as a carbon “sink“. This experiment illustrates the importance of CO2 for the growth of the microalgae, Dunaliella sp., in seawater. The conditions simulated in this experiment are, however, not a true reflection of the natural environment since the ocean is always re-supplied with CO2 from the atmosphere. New research results show that growth may be accelerated in some types of oceanic algae by an increased CO2 concentration.summary
Preparation time: 20 minutes
Activity time: 1 – 2 weeks
For pupils aged: 10 – 14 years
Application: biology
Time for data analysis
and discussion: 1 hour
Prior knowledge required: photosynthesis
Degree of difficulty: medium
materials
Erlenmeyer culture flasks (200 ml)
rubber stoppers with one hole fitting into the mouths of the flasks (or cotton balls wrapped into transparent films)
pipettes filter paper
glass fibre filter (GF/F) drinking straws
culture water: pond or lake water, seawater (salinity: 35), brackish water (salinity: 15)
nutrients for algae culture: nitrate (NO3), phosphate (PO4), silicate (Si(OH)4), vitamin mix, metal mix (If nutrients are not available, a plant fertilizer with high nitrate and phosphate content will also do. Use 5 – 10 millilitres per litre of culture water.)
stock culture of freshwater or marine microalgae, e.g. Dunaliella sp. (If no stock culture is available, natural populations will do. Use a plankton net to gather phytoplankton from a lake, pond or from the sea. It may take a little more time until results can be seen with natural populations. Natural Dunaliella sp. does not require silicate.)
p
1. Filter the culture water first with the paper filters and then with the GF/F filters. Filter sterilization is optional, although this minimises bacterial and foreign algal contamination.
2. Prepare common culture water for all the treatments by adding the nutrients to the filtered water. Here, one millilitre of each solution from nitrate, phosphate, silicate and metal mix plus 500 microlitres of the vitamin mix is used for 1 litre filtered culture water.
3. Add about 5 millilitres of the stock algal culture, for example Dunaliella sp. to the prepared culture medium. The exact amount depends on the density of the algal culture. The more of a stock culture you add, the faster the new culture will grow. If you run this experiment in winter, it is better to use a bit more than in summer when higher temperatures and light promote growth.
4. Rinse and then fill the culture flasks with the prepared algal culture up to the 150 millilitres mark. Then you can decide what treatments you would like to make.
For example:
Treatment 1 (T1): CO2 limited - flask covered tightly
Treatment 2 (T2): CO2 fertilised - flask covered with a cotton wad made airtight by wrapping it in transparent film with a straw inserted in the middle for CO2 introduction by blowing
Treatment 3 (T3): control (no CO2 fertilisation) - flask covered with a cotton wad
5. Make three replicates of each treatment. Place the flasks in a bright place but not in direct sunlight. Treatments 1 and 3 should be gently shaken at least twice daily. For treatment 2, air should be blown into the culture for 30 – 60 seconds twice a day.
procedure
results
Observe the algae cultures over two weeks. How do the colours in the flasks change? What do the changes tell you about the growth of the algae under the different treatments?
notes
The following changes should occur: Day 0 Initial stage: water clear
Day 4 Green tinge in T2
Day 6 Light green in T2, green tinge in T1 and T3.
Day 10 Darker green in T2, T3 becomes darker than T1.
Day 13 Darker green in T2, T3 catching up with T2, T1 lightest green.
Day 14 No further change in T2 and T3, no change in colour in T1. T1 much lighter colour than T2 and T3.
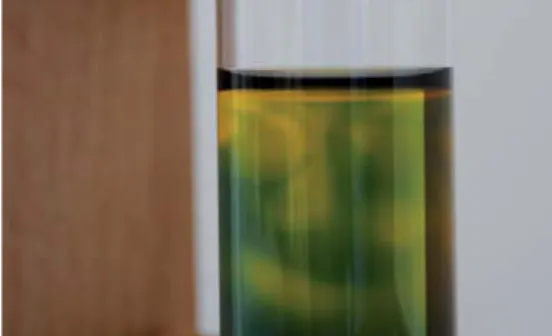
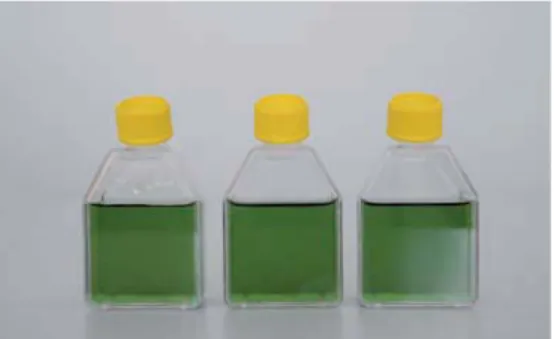
Figure 1:
From left to right: The CO2 limited treatment (T1), the CO2 fertilised culture (T2) and the control treatment (T3) at the start of the experiment.
Figure 2:
From left to right: T1, T2 and T3 after six days. Clear dif-ferences can be seen: The growth of the algae in T2 has nearly reached its “plateau stage” where no more algae will grow because of the depletion of the nutrients and will therefore not become much darker in colour.
Figure 3:
From left to right: T1, T2 and T3 after 14 days. T2 and T3 become similar in colour. T1 still shows very little growth.
How much carbon dioxide is in the classroom?
How much carbon dioxide (CO2) is contained in the air of a classroom? What factors lead to more CO2 production and to its removal? In this experiment, students work as a team to document how CO2 concentration develops during a given time period (here: within a week) and how CO2 concentrations change as a result of different activities in the classroom (in this case, within two weeks).
summary
Activity time: one week for the basic measurements, one week or longer for further experiments
For pupils aged: 10 – 18 years
Application: group activity in biology, chemistry, geography, or maths lesson, interdisciplinary projects
Time for data analysis
and discussion: 1 – 4 lessons
Prior knowledge required: dependent on the experiments
Degree of difficulty: easy – moderate
Safety note: Because candles are used, this experiment should be carried out under supervision of an adult
materials
handheld CO2 sensor with data logger (example: TSI IAQ-Calc 7535) stand and clamp
computer extension cables adhesive tape digital photo camera candles
matches plants aquarium
tap water or seawater pH meter
aquarium pump, plastic tube, air-stones
p
1. Introduction
Introduce the pupils to the carbon cycle by having them measure the carbon dioxide concentrations in different parts of the school with the hand-held CO2 sensor, for example, in the schoolyard, in the parking lot, inside a small closed room with a different number of persons inside, on the school roof and other places.
2. Task allocation
After the pupils have been acquainted with the use of the sensor, the pupils can be divided into groups with each group responsible for a given task:
Analysts: This includes the whole class. After all the data and graphs have been created, the entire class will discuss their results together for the final presentation.
Photographers: Two pupils to document all the steps of the activity with a camera.
Setup team: Two pupils to setup the sensor in the classroom and ensure that it functions and records data correctly during the entire activity.
Recorders: Three pupils to download the data from the sensor into the computer and produce the graphs for the class.
Reporters: Two pupils to summarise the whole activity and prepare a presentation. Monitors: Two pupils to record everything that happens inside the classroom: When did the first person enter the classroom in the morning?
How many people are there in the classroom?
When were the doors and/or windows opened? How long were they open for? When did the whole class enter the classroom? When did it leave it?
When did the last person leave the room?
What were the weather conditions like outside (sunny, cloudy, rainy, snowing, etc.)?
It would also be interesting to note in which subject (Maths, History, etc.) the pupils produce the most CO2.
3. Installing the CO2 sensor
a) Place the CO2 sensor at the back of the classroom with the help of the teacher. If possible, put it in an elevated place so the pupils are not distracted during normal class hours.
b) Fasten the CO2 sensor to the stand with the clamp and, if necessary, secure this with adhesive tape. Be sure that the there is free air circulation around the CO2 sensor.
c) If a thermometer and a hygrometer are available, measurement of the room temperature and humidity can also be included.
d) If you use extension cables, make sure that they are well fixed so that no one will trip over them. e) The setup team should check regularly if the CO2 sensor is recording and storing data correctly.
procedure
Figure 1: The CO2 sensor is mounted on a stand and held with
a clamp on a cupboard at the back of the classroom. This way the pupils are not distracted. Ensure free air circulation
4. Baseline measurements
a) The recorders register the daily fluctuations of CO2 inside the classroom and produce a baseline (Figure 2). b) The monitors write down the length of time the students were inside the classroom or when the windows or doors were opened. They can also correlate the CO2 concentration to the number of people inside the classroom or try to find out if more CO2 is produced during normal lessons or when tests are written. To have more fun, the pupils can also try to influence the CO2 level by intensive breathing, or jumping and jogging on the spot.
c) The photographers should take pictures showing the classroom and the activity of the pupils. The reporters could use the photos later in their presentation.
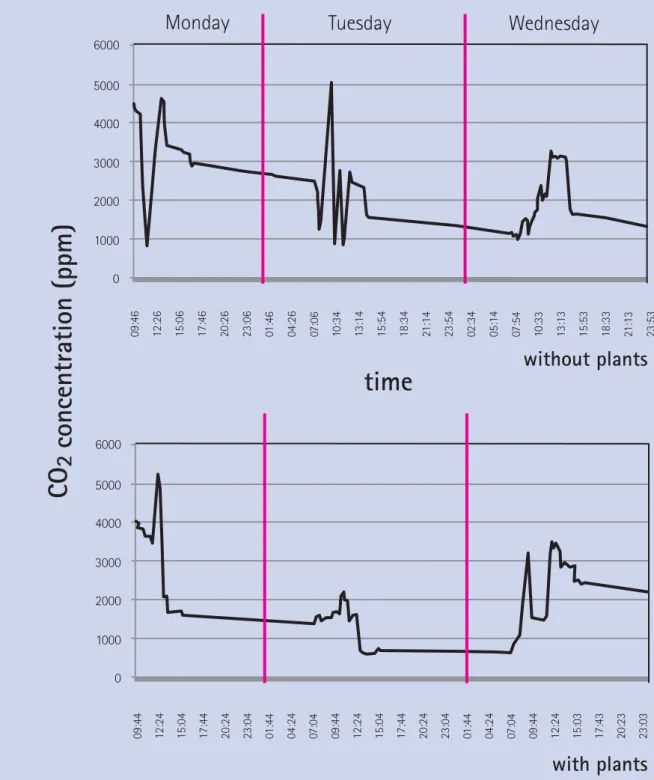
Figure 2:
The baseline shows regular fluctuations of the CO2 concentration in the classroom under “normal conditions”. As soon as a pupil enters the room in the morning, the CO2 concentration starts to rise. It is interesting to observe the fluctuations due to the class changing rooms for the different subjects. In the afternoon, when classes are over, the CO2 concentration starts to decline.
Monday
Tuesday
Wednesday
5000 6000
4000
2000 3000
1000
0
09:46 11:26 13:06 14:36 16:26 18:06 19:46 21:26 23:06 00:46 02:26 04:06 05:46 07:26 09:06 11:34 13:14 14:54 16:34 18:14 19:54 21:34 23:14 00:54 02:34 04:14 05:54 07:34 09:14 10:53 12:33 14:13 15:53 17:33 19:13 20:53 22:33
CO
2
concentration (ppm)
5a. How do plants affect the CO2 concentrations inside the classroom?
Ask the pupils to each bring a potted plant to school. Place the plants on the windowsill and measure the changes in the CO2 concentrations. Record the changes over one week and then the students can compare the CO2 levels with the baseline measurements (Figure 3).
Figure 3: Comparison of the CO2 concentration in the classroom with and without plants. The CO2 concentra-tion decreases to lower levels in the presence of plants.
Monday
Tuesday
Wednesday
5000 6000
4000
2000 3000
1000
0
09:46 12:26 15:06 17:46 20:26 23:06 01:46 04:26 07:06 10:34 13:14 15:54 18:34 21:14 23:54 02:34 05:14 07:54 10:33 13:13 15:53 18:33 21:13 23:53
CO
2
concentration (ppm)
time
5000 6000
4000
2000 3000
1000
0
09:44 12:24 15:04 17:44 20:24 23:04 01:44 04:24 07:04 09:44 12:24 15:04 17:44 20:24 23:04 01:44 04:24 07:04 09:44 12:24 15:03 17:43 20:23 23:03
without plants
5b. How do we simulate the burning of fossil fuels in the classroom?
Let the pupils light candles and extinguish them after 15 minutes. This should be done with supervision of a teacher to avoid the children playing with the fire. To combine this with the first experiment (5a), they can light candles with plants and without plants in the classroom (Figure 4 and 5).
Figure 4: Results of different experiments. The profiles show CO2 concentrations inside the classroom on the same day of the week so that the classroom activities are the same during each experiment. (a) baseline without plants and candles: up to 3000 ppm CO2 (ppm: parts per million). (b) without plants, with candles: increase of CO2 up to 5000 ppm. (c) with plants, without candles: increase of CO2 up to 3000 ppm, but decrease to less than 1000 ppm after class which is lower than the baseline. (d) with plants, with candles: increase of CO2 up to 5000 ppm but faster decrease after the candles were blown out.
5000 6000 4000 2000 3000 1000 0
07:08 07:23 07:38 07:53 08:08 08:23 08:38 08:53 09:08 09:23 09:38 09:53 10:08 10:23 10:38 10:53 11:08
CO
2
concentration (ppm)
5000 6000 4000 2000 3000 1000 007:03 07:23 07:43 08:03 08:23 08:43 09:03 09:23 09:43 10:03 10:23 10:43 11:03
07:0
7
07:27 07:47 08:0
7
08:27 08:47 09:0
7
09:27 09:47 10:0
7
10:27 10:47 11:0
7
07:03 07:23 07:43 08:03 08:23 08:43 09:03 09:23 09:43 10:03 10:23 10:43 11:03
without plants, without candles
without plants, with candles
with plants, without candles
with plants, with candles
time
a
b
c
d
candles blown out
Figure 5:
The effect of the presence of plants in the classroom: When candles are lit, the CO2 concentration rises up to 5000 ppm with or without plants. After the candles have been extinguished, the CO2 level decreases quickly if plants are in the room.
The effect of plants in the classroom
5000 6000
4000
2000 3000
1000
0
5000 6000
4000
2000 3000
1000
0
08:03 08:13 08:23 08:33 08:43 08:53 09:03 09:13 09:23 09:33 09:43 09:53 10:03 10:13 10:23 10:33 10:43
CO
2
concentration (ppm)
without plants
with plants
candles
burning break
5c. How do increased CO2 concentrations affect the ocean?
Set up an aquarium at the back of the classroom. Fill the aquarium with distilled water (or seawater). Aerate the aquarium with a pump to ensure that the water is aerated with the surrounding air. Place the probe of a pH-Meter in the water and measure the pH continuously (Figure 6). Correlate the pH values of the water with the CO2 concentrations in the air (Figure 7).
experimental setup
Figure 6:
Figure 7: Effect of CO2 on the pH of water. When the CO2 concentration in the air rises, the pH of the water sinks i.e. it becomes more acidic.
pH meter pH probe airstone aquarium pump 3000 2500 2000 1500 1000 500 10:34 0 5,55 5,5 5,45 5,4 5,35 5,3 5,25 5,2 11:24 11:44 5000 4000 3000 2000 1000 10:43 0 5,85 5,8 5,75 5,7 5,65 11:33 13:13 10:23 11:53 6000 5000 4000 3000 2000 1000 09:23 0 6 5,95 5,9 5,85 5,8 5,75 5,7 5,65 10:23 12:13 5,6 07:53
CO
2
pH
pH of the water in
side the aquarium
CO
2
concentr
ation in
side the class
room
The gas exchange between ocean and atmosphere
The oceans exchange gases such as oxygen and carbon dioxide (CO2) with the atmosphere. This occurs at the boundary layer where the air and water surface meet. In addition to temperature, the corresponding CO2 pressure and chemical reactions between previously dissolved carbon dioxide and other dissolved material in the water determine how much CO2 the ocean can absorb. Various other biological and physical processes determine if CO2 is released or taken up.
This experiment illustrates the exchange of gases between water and the atmosphere and how the concentration of gases in these media is always in balance. The effect of temperature on this process will also be observed. At the end of the experiment, you will use your observations to explain where the oceans release CO2 and where the oceans absorb CO2.
you will need
3 bottles or flasks of the same size (any material or size will do) 3 beakers or drinking glasses large enough for the bottles to fit in 1 drinking straw
1 small pipette
universal indicator (McCrumb)
water: distilled water, tap water or seawater are suitable hot water
ice cubes
procedure
Figure 1: The bottles with distilled water and McCrumb indicator.
1. Fill the bottles half-full with water. Use either dis-tilled water, tap water or seawater for all three bottles. Put several drops of indicator solution into the bottles using the pipette until the water in the bottles has reached the same shade of green. Make sure you add the same amount of indicator in all bottles. The amount of indicator required depends on what water is used and its volume.