www.ijemst.com
Estimating Survival Rates in Engineering
for Community College Transfer
Students Using Grades in Calculus and
Physics
Marcia Laugerman, Mack Shelley, Diane Rover, Steve Mickelson
Iowa State University
To cite this article:
Laugerman, M., Shelley, M., Rover, D., & Mickelson, S. (2015). Estimating survival rates
in engineering for community college transfer students using grades in calculus and physics.
International Journal of Education in Mathematics, Science and Technology, 3
(4), 313-321.
This article may be used for research, teaching, and private study purposes.
Any substantial or systematic reproduction, redistribution, reselling, loan, sub-licensing,
systematic supply, or distribution in any form to anyone is expressly forbidden.
Authors alone are responsible for the contents of their articles. The journal owns the
copyright of the articles.
Volume 3, Number 4, October 2015, Page 313-321
ISSN: 2147-611X
Estimating Survival Rates in Engineering for Community College Transfer
Students Using Grades in Calculus and Physics
Marcia Laugerman*, Mack Shelley, Diane Rover, Steve Mickelson
Iowa State University
Abstract
This study uses a unique synthesized set of data for community college students transferring to engineering by combining several cohorts of longitudinal data along with transcript-level data, from both the Community College and the University, to measure success rates in engineering. The success rates are calculated by developing Kaplan-Meier survival curves measuring retention in engineering over time by grades received in Calculus and Physics courses at both institutions. For each course, survival curves are compared to determine if statistically significant differences exist between levels of grades received. The levels of course grades at which statistically significant differences in retention rates exist are documented. To validate these findings the actual graduation rates in engineering for the same groups of students are estimated using grades received in Calculus and Physics. Policy recommendations based on these findings, including the best time to transfer for this group of community college students, are incorporated.
Key words: Engineering education, Community college transfer students, Calculus grades, Physics grades, Survival rates.
Introduction
Data about community college (CC) student achievement and success in engineering is lacking (Starobin & Laanan, 2010; Tyson, 2011). Understanding the academic preparation component and the number of credits and grades obtained is needed to add to the literature (Jackson & Laanan, 2011). CC transfer students have the potential to increase both the number and the diversity of engineering graduates (Starobin, Laanan, & Burger, 2010; Laanan & Starobin, 2008; Tsapogas, 2004). Research supports the assertion that, compared to men, women scientists and engineers are more likely to have attended a CC at some point in their academic career (Tsapogas, 2004). The difficulty of obtaining, synthesizing, and analyzing trans-institutional data has resulted in few studies that address key retention variables and engineering persistence for the CC transfer student. This study addresses: 1) retention, by analysis of the survival function based on grades in key academic coursework, using significant quantitative measures that have high correlations to success; 2) correlation of success in these key courses with graduation success rates; and 3) the best time to transfer in terms of Calculus and Physics courses completed at the CC. The results of this study will inform faculty, administrators, students, and student affairs professionals in CCs and universities about strategies to increase the success of CC transfer students to engineering.
Background
Students’ early academic momentum is very influential for their ultimate degree completion (Attewell, Heil, & Reisel, 2012). Therefore, failing courses, especially early in the program, is a deterrent to succeeding in the study of engineering. According to Suresh (2006), “It is hard to quantify the effect of failing a course on student persistence. At the minimum, it causes students to question if the degree they are seeking is right for them and perhaps if they could be successful in any degree program” (p. 235). This perspective was borne out in a retention analysis at Iowa State University, which found that CC transfers who left engineering also left the University at significantly higher rates than those who entered directly from high school (Laugerman, Rover, Bruning, Laanan, Mickelson, & Shelley, 2011).
*
314 Laugerman, Shelley, Rover & Mickelson
The correlation between academic variables and retention in engineering has been examined in numerous studies (Budny, LeBold, & Bjedov, 1998; Levin & Wyckoff, 1990; Strenta, Elliot, Adair, Matier, & Scott, 1994; Suresh, 2006; Tyson, 2011; Veenstra, Dey, & Herrin, 2009; Whalen & Shelley, 2010; Zhang, Min, Ohland, & Anderson, 2006). Of these studies, only Tyson (2011) included CC transfer students in the data. His study hypothesized “high school accelerated physics and calculus course taking and grades influence grades earned in college physics and calculus and both sets of factors influence engineering degree attainment” (Tyson, 2011, p. 760). Pre-college characteristics linked to persistence in engineering usually include high performance in mathematics on standardized test scores. A similar survival rate analysis of undergraduate engineering students (Min, Zhang, Long, Anderson, & Ohland, 2011) found higher SAT mathematics scores were significantly linked to persistence in engineering.
Mathematics skill has been proposed as one of the primary variables influencing retention in the science, technology, engineering, and mathematics (STEM) fields, especially engineering (Astin & Oseguera, 2005). The rigor of engineering curricula is cited as one of the most important variables contributing to student attrition, with Calculus being the largest obstacle (Li, Swaminathan, & Tang, 2009). Students with a C average or less in Calculus are much more likely to leave engineering (Levin & Wyckoff, 1990;Veenstra et al., 2009; Zhang, Min, Ohland, & Anderson, 2006). Performance in Calculus impacts success in sequential courses that rely on Calculus (Levin &Wykoff, 1990). Therefore, Calculus-based Physics also presents a significant barrier to achieving an engineering degree. Comments by Suresh (2006) support this idea: “Performance in barrier courses often determines whether or not a student persists in engineering. At the very least, it causes some students to question their ability to make it through the program. While it is important that only students who can cope with the academic requirements of the program should continue in it, the challenge of barrier courses may cause otherwise able students to also transfer out” (Suresh, 2006, p. 217).
Most of the students who leave engineering do so before they have completed these difficult courses (Levin & Wyckoff, 1990). Data show that students must acquire proficiency in these key foundational areas to succeed in engineering. In a longitudinal study of over 35,000 pre-engineering students at Purdue, 84% of those who left engineering did so before they completed their pre-professional program (which included Calculus and Physics) (Budny, LeBold, & Bjedov, 1998). Not all students who leave engineering do so because of low grades; many students leave engineering in good academic standing (Zhang, Anderson, Ohland, Carter, & Thorndyke, 2004). And not all students who stay in engineering have good grades. Despite finding specific effects of academic achievement in prerequisite courses, retention is also linked to persistence and motivation (Suresh, 2006)and conscientiousness (Hall, Kauffmann, Wuensch, Swart, Deurquidi, Griffin, & Duncan, 2015).
Therefore this study uses a unique synthesized set of data for CC students transferring to engineering in a four-year university program by combining several cohorts of longitudinal data along with transcript-level data from both the CC and the University to measure success rates in engineering. The success rates are calculated by developing Kaplan-Meier survival curves measuring retention in engineering over time by grades received in Calculus and Physics courses at both institutions. For each course, survival curves are compared to determine if statistically significant differences exist between mean grades received. The grades at which statistically significant differences exist are documented. To validate these findings, the actual graduation rates in engineering for the same groups of students are estimated by grades received in Calculus and Physics. Policy recommendations based on these findings, including the best time to transfer for this group of CC students, are incorporated.
Methods
Since transfer students have the option of taking these engineering courses at the CC or transferring and taking these courses at the University post-transfer, retention rates are separated by where a student completed the course. Considering these two options reduces the variability in grades between institutions. The timing of the credits earned by the student determines the University classification as either a transfer or direct from high school admit. Students entering college during the semester directly following high school are considered a direct from high school admit even if they bring “transfer credit” for dual-enrolled or advanced placement courses. Students transferring from another four-year university were not included in this study.
the most recent institution attended, not necessarily the institution where the student completed the most credits. It is not unusual for transfer students to have credit from multiple institutions (McCormick, 2003).
Demographics
The retention rates were estimated for a group of 1,191 in-state CC students who transferred to the College of Engineering (CoE) between 2002 and 2010 (inclusive). The demographics were as follows:
Female: 6.8%
Black: 3.5%
White, non-Hispanic: 84.5%
Hispanic: 1.6%
American Indian: 0.9%
Asian: 3.8%
US Citizen: 92.9%
Survival (or retention) in the CoE was determined by a student’s grades in Calculus I, Calculus II, or Physics I. The results are separated by where a student completed the course.
In addition to the active retention data, a subset of the data was used to determine empirical graduation rates. The subset included 472 in-state CC transfers to the CoE from 2002-2005 (inclusive), allowing for a sufficient length of time for graduation to have occurred. There were no statistically significant differences in demographics (p>0.01) between this subset and the entire data set. The sample is large enough for the observations to be reliable and give sufficient power to statistical tests (Levine, 2008). These data were also separated by where a student completed the course.
Graduation Rates
Actual graduation rates that were based on the individual course grade in Calculus I, Calculus II, and Physics I were computed at increments on 0.05 on a 4.0 GPA scale. These data were compared statistically with the overall average graduation rate for this group of students to discover if there was a grade in each single course that resulted in a statistically significantly higher than average graduation rate (p<0.01). The results were used to advise students of recommended thresholds of achievement that resulted in statistically significantly higher than average graduation rates. To determine statistical significance Pearson chi-square analysis was used. In each test, the expected frequency assumption, which allows for the normal approximation to a binomial distribution, was met, even where sample sizes are smaller than 30. The chi-square analysis also assumes large populations and sampling without replacement. For numerical variables, the t-test for the equality of two means assuming equality of variance was used. The assumption of equality of variance between the groups was assessed using an F-test for the ratio of variances before the t-test for equal variance was used. The resulting p-value (attained level of significance) is reported (Levine, 2008).
Retention Rates
To determine retention rates in engineering over time based on grades received in Calculus and Physics for this group of CC transfer students, we used the Kaplan-Meier estimate (McGready, 2006). The Kaplan–Meier estimator is the nonparametric maximum likelihood estimate of S(t). It is a product of the form
where ni is the number of survivors less the number of losses di.
A significant advantage of the Kaplan–Meier curve is that the method can take into account some types of censored data, particularly right-censoring, which occurs if a student withdraws from a study or is lost from the sample before the final outcome is observed (Kaplan & Meier, 1958). Students who graduate are removed from the survival graphs over time and do not impact the percentage who failed to succeed. Without censoring, ni is
316 Laugerman, Shelley, Rover & Mickelson
losses di (censored cases). It is only those surviving cases that are still being observed (have not yet been
censored) that are “at risk” of not surviving. Right censoring enabled us to get accurate, updated student data.
A plot of the Kaplan–Meier estimate of the survival function is a series of horizontal steps of declining magnitude which, when a large enough sample is taken, approaches the true survival function for that population. The value of the survival function between successive distinct sampled observations is assumed to be constant.
Comparing Survival Curves
A common statistical test to compare survival curves is the generalized Wilcoxon, Breslow, and Gehan test (McGready, 2006). This test compares two survival curves across multiple time points to answer the question: Is there an overall survival difference between the groups? The null and alternative hypotheses are shown below:
Ho: S1(t) = S2(t)
Ha: S1(t) ≠ S2(t)
The Wilcoxon, Breslow, and Gehan test is sensitive to early survival differences, which is consistent with finding variables that significantly influence retention in the two years after transfer. This test calculates the difference between what is observed at each event time and what would be expected under the null hypothesis. These differences are aggregated across all event times into one overall “distance” measure i.e., how far sample curves differ from the presumed results in the null hypothesis after accounting for sampling variability. The test gives a p-value to indicate whether significant differences exist between the curves. A lower p-value indicates a more significant difference between the curves (McGready, 2006).
Limitations
This was a quasi-experimental study using retrospective data to address retention based on grades in key engineering courses; therefore, there are numerous limitations in the claims that can be implied. This study was limited by the amount of information available from the transfer institution. It did not include data on the completion of an Associate’s degree since the focus was on individual Calculus and Physics courses and how they corresponded to success in engineering. It was also limited to information about a select group of transfer students from one state, acknowledging that STEM success varies across student demographic categories and ethnic groups, as well as between men and women (Hagedorn & Purnamasari, 2012). Although grades are a quantitative measure of success, there is measurement error and variability that we were not able to control for. This study used the final course grades a student received and did not count the number of times a course was repeated if at all.
Results
The 472 CC students who transferred into the CoE at the University between 2002 and 2005 (inclusive) had an overall graduation rate in engineering of 53%. Actual graduation rates that were based on the individual course grade in Calculus I, Calculus II, and Physics I were computed at increments on 0.05 on a 4.0 GPA scale. These data were compared statistically with the overall average graduation rate for this group of students to discover if there was a grade in each single course that resulted in a statistically significantly higher graduation rate (p<0.01). The resulting graduation rates were estimated based on the student grades in Calculus I, Calculus II, and Physics I. The data were further disaggregated by the institution (CC or University) where the transfer student completed the course. Retention rates were estimated for the group of 1,191 in-state CC students who transferred to the CoE between 2002 and 2010 (inclusive).
Calculus I
If a student completed Calculus I at the University, the grade break at which there was a significant difference between students’ retention rates occurred for students obtaining a B (3.0 out of 4.0) or better compared with students obtaining less than a B as shown in Table 4. At this break-point, the Wilcoxon test between the curves resulted in a statistically significant difference (p<0.001) between the retention rates. If a student completed Calculus I at the CC, the break-point was the same: for students obtaining a B (3.0) or better and for students obtaining less than a B. At this break-point, the Wilcoxon test between the curves resulted in a statistically significant difference (p<0.01) between the retention rates.
The retention rate analysis is supported by the graduation data. The impacts of different levels of the Calculus I grade on graduation in engineering are listed in Table 1. The results show that the jump in graduation rates at both institutions occurred above a grade of 2.5 out of 4.0 (that is, above a C+ (2.33), but not quite a B- (2.67)). The graduation rates are similar for each institution at each level of grades in Calculus I.
Table 1. Percent earning a degree in engineering for CC transfers based on Calculus I grade and institution Calculus I Completed at the University Completed at the CC
Grade Graduation rate n Graduation rate n
1.0-2.0 7% 15 33% 6
>2.0-2.5 32% 25 47% 99
>2.5-3.0 56% 9 67% 21
>3.0-3.5 56% 16 58% 76
>3.5-4.0 67% 18 69% 132
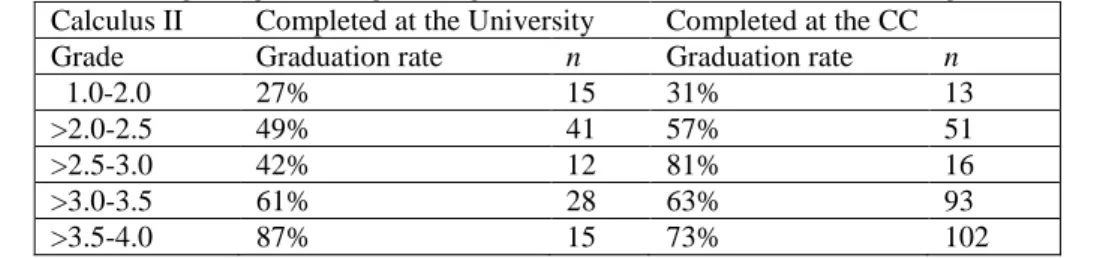
Calculus II
For Calculus II, the grade at which there was a statistically significant difference in retention rates was the same as for Calculus I, as shown in Table 4. If a student completed Calculus II at the University, the break-point occurred for students obtaining a B (3.0) or better compared to students obtaining less than a B. The Wilcoxon test for differences between the curves resulted in a statistically significant difference (p<0.01) between the retention rates. If a student completed Calculus II at the CC, the break-point occurred for students obtaining a B (3.0) or better compared with students obtaining less than a B. At this break-point the Wilcoxon test between the curves resulted in a statistically significant difference (p<0.05) between the retention rates.
The retention rate analysis is supported by the graduation data. The impact of the Calculus II grade on graduation in engineering is shown in Table 2. The table shows a jump in graduation rates at the University occurring above a grade of 3.0 (B), and at the CC occurring above a grade of 2.5 (C+/B-). At the 3.0 level of Calculus II grade, the graduation rates are similar for each institution (61% for the University and 63% for the CC), and significantly higher (p<0.01) than the average rate of 53%. At higher levels of grades in Calculus II, the graduation rates in engineering are higher for students who completed Calculus II at the University, but both are significantly higher than average.
Table 2. Percent earning a degree in engineering for CC transfers based on Calculus II grade and institution Calculus II Completed at the University Completed at the CC
Grade Graduation rate n Graduation rate n
1.0-2.0 27% 15 31% 13
>2.0-2.5 49% 41 57% 51
>2.5-3.0 42% 12 81% 16
>3.0-3.5 61% 28 63% 93
>3.5-4.0 87% 15 73% 102
Physics I
318 Laugerman, Shelley, Rover & Mickelson
completed Physics I at the CC, there was no break-point at which the Wilcoxon test between the curves resulted in a statistically significant difference (p=0.910) between the retention rates.
Table 3. Summary of survival rate studies
Calculus I Calculus II Physics I University Grade B (3.0)** B (3.0)* 2.0*** Transfer CC Grade B (3.0)* B (3.0)* none
Grade point level where survival analysis indicates a significant difference in retention. *p<0.05
**p<0.001 ***p<0.0001
The impact of the Physics I grade on graduation in engineering is shown in Table 4. The retention rate analysis is supported by the graduation data. The table shows that enhanced graduation rates at both institutions occur above a grade of 2.0 (C). At this level of grade in Physics I, the graduation rates are similar for each institution and significantly (p<0.01) greater than the average (53%) graduation rate. At Physics I grades above B (3.0), the graduation rates in engineering are higher for students who completed Physics I at the University, although both are significantly (p<0.01) higher than the average rate.
Table 4. Percent earning a degree in engineering for CC transfers based on Physics I grade and institution Physics I Completed at the University Completed at the CC
Grade Graduation rate n Graduation rate n
1.0-2.0 55% 49 38% 8
>2.0-2.5 60% 40 62% 52
>2.5-3.0 64% 11 64% 11
>3.0-3.5 76% 41 63% 54
>3.5-4.0 89% 19 78% 74
Best time to transfer
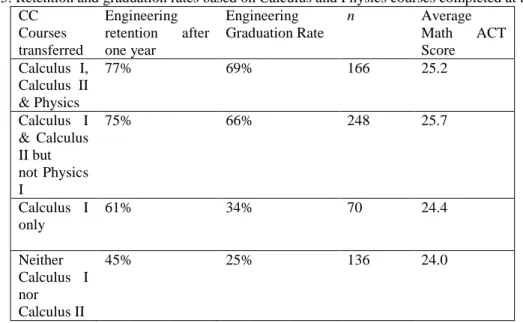
To determine the best time to transfer from the CC to the University in terms of Calculus and Physics, Table 5 lists actual retention and graduation information for in-state CC transfers based on the sequence of courses taken at the CC. Table 5 shows how the completion of Calculus I, Calculus II, and Physics I at the CC affected retention and graduation rates. Students who transfer the sequence of courses (a) Calculus I, Calculus II, and Physics I or (b) Calculus I and Calculus II from the CC have higher retention and graduation rates in engineering than those who transfer fewer Calculus and Physics courses. These groups have not been matched based on demographic characteristics due to missing data; however, mean mathematics ACT scores associated with each group are similar.
Table 5. Retention and graduation rates based on Calculus and Physics courses completed at the CC CC
Courses transferred
Engineering retention after one year
Engineering Graduation Rate
n Average
Math ACT Score
Calculus I, Calculus II & Physics
77% 69% 166 25.2
Calculus I & Calculus II but not Physics I
75% 66% 248 25.7
Calculus I only
61% 34% 70 24.4
Neither Calculus I nor Calculus II
Summary and Conclusions
A number of internal, external, and demographic characteristics affect student retention in engineering. Among the external characteristics, the rigor of engineering curricula is cited as one of the most important variables contributing to student attrition, with Calculus being the largest obstacle (Li, Swaminathan, & Tang, 2009). To the degree that grades represent a command of the subject areas that are necessary to succeed in engineering, the results of this research provide a plan for engineering success for CC transfer students.
Survival charts show a “real time” picture of retention; students who graduated or dropped out of engineering were “right-censored” so as not to continue to affect the survival functions. In this study, the data included students entering engineering from 2002 through 2010. The survival charts indicate that a 3.0 (B) in Calculus I and in Calculus II at either institution significantly increased retention rates over students earning less than a B. This outcome was not dependent on whether the CC transfer student completed the course at the CC pre-transfer or the University post-transfer. GPA increments of 0.50 were investigated. Perhaps at smaller increments differences would occur, but the sample sizes were not large enough for smaller increments to be able to attain statistical significance. With graduation rate data, the point at which the rates increased significantly was slightly lower for Calculus I (above 2.5), than for Calculus II (above 3.0). A possible explanation could be the persistence of better students and the interconnectedness of Calculus I and II.
A Physics I grade of C (2.0) at the University significantly increased retention rates over students earning less than a C. It is possible that a lower grade in Physics I was acceptable due to either the difficulty or the timing of the course. Students do not take Physics I until they have successfully completed Calculus I. This could present a barrier, as completing Physics with a passing grade is necessary to succeed in engineering. It was interesting that no such demarcation line could be found for the CC transfer student who completed Physics at the CC. A possible explanation for that discrepancy may be that transfer grades below D were not recorded in the transcript (only transfer credits above a C- are accepted at the University) and therefore not enough differentiation existed to measure.
For students who chose the CC pathway to the engineering degree, the best time to transfer was after they had completed at least Calculus I, Calculus II, and possibly Physics I. This makes sense because academic momentum is critical to early success in engineering. One unexpected finding was that the difference between institutions was not a significant indicator of success except at the highest level of grades (above 3.5). Retention and graduation analysis found that similar course grades determined success in engineering for this group of CC transfer students. This finding could be due to the proximity of the CC to the University, and the strength of the CC faculty teaching Calculus and Physics.
Recommendations
As measured by grades in Calculus and Physics, success in engineering corresponds to grades of B or better in Calculus and C or better in Physics for this group of CC transfer students, whether they chose to take the course at the CC or the University. It is important to note that Physics is a Calculus-based course. Further study is warranted about math unpreparedness for Calculus. In addition to successfully passing Calculus, passing remedial mathematics classes preparing for Calculus presents a barrier to success in engineering. That area of inquiry was not included in this study and warrants further research.
320 Laugerman, Shelley, Rover & Mickelson
Acknowledgement
This material is based upon work supported by the National Science Foundation under Grant No. 0653236. Any opinions, findings, and conclusions or recommendations expressed in this material are those of the author(s) and do not necessarily reflect the views of the National Science Foundation. We also acknowledge the cooperation and support of Kari Henson and other faculty, staff, and administrators at Des Moines Area Community College as well as Jason Pontius at Iowa State University for research support.
References
Astin, A., & Oseguera, L. (2005). Pre-college and institutional influences on degree attainment. In A. Seidman (Ed.), College student retention: Formula for student success (pp. 245–276). Westport, CT: American Council on Education, Praeger.
Attewell, P., Heil, S. C., & Reisel, L. (2012). What is academic momentum? And does it matter? Educational Evaluation and Policy Analysis, 34(1), 27-44.
Budny, D., LeBold, W., & Bjedov, G. (1998). Assessment of the impact of freshman engineering courses. Journal of Engineering Education, 87(4), 405–411.
Hagedorn, L., & Purnamasari, A. (2012). A realistic look at STEM and the role of community colleges. Community College Review 40(2), 145-164.
Hall, C., Kauffmann, P., Wuensch, K., Swart, W., Deurquidi, K., Griffin, O., & Duncan, C. (2015). Aptitude and personality traits in retention of engineering students. Journal of Engineering Education 104(2), 167-188.
Jackson, D., & Laanan, F. (2011). The role of CC in attracting women. New Directions for Institutional
Research, 152: Wiley Periodicals, Inc. Published online in Wiley Online Library
(wileyonlinelibrary.com) DOI: 10.1002/ir.407).
Kaplan, E., & Meier, P. (1958). Nonparametric estimation from incomplete observations. Journal of American Statistical Association, 53(282), 457–481.
Laanan, F., & Starobin, S. (2008). Broadening female participation in science, technology, engineering, and mathematics: Experiences at community colleges. In J. Lester (Ed.), Gendered perspectives on community colleges. New Directions for Community Colleges, 142. San Francisco: Jossey-Bass. Levin, J., & Wyckoff, J. (1990). Identification of student characteristics that predict persistence and success in
an engineering college at the end of the sophomore year: Informing the practice of academic advising. Division of Undergraduate Studies Report No. 1990. Pennsylvania State University.
Li, Q., Swaminathan, H., & Tang, J. (2009). Development of a classification system for engineering student characteristics affecting college enrollment and retention. Journal of Engineering Education, 98(4), 361-376.
McCormick, A. (2003). Swirling and double-dipping: New patterns of student attendance and their implications for higher education. New Directions for Higher Education, 2003(121), 13-24.
McGready, J. (2006). When time is of interest: The case for survival analysis. Baltimore, MD: Johns Hopkins University. Retrieved from http://distance.jhsph.edu/breezeContent/537/6.pdf.
Min, Y., Zhang, G., Long, R. A., Anderson, T. J., & Ohland, M. W. (2011). Nonparametric survival analysis of the loss rate of undergraduate engineering students. Journal of Engineering Education, 100(2), 349-373.
Starobin, S., & Laanan, F. (2010). From community college to Ph.D.: Educational pathways in science, technology, engineering, and mathematics. Journal of Women and Minorities in Science and Engineering, 16(1), 67–84.
Starobin, S., Laanan, F., & Burger, C. (2010). From community college to Ph.D.: Educational pathways in science, technology, engineering, and mathematics. Journal of Women and Minorities in Science and Engineering, 16(1), 1–5.
Strenta, C., Elliot, R., Adair, R., Matier, M., & Scott, J. (1994). Choosing and leaving science in highly selective institutions. Research in Higher Education, 35(5), 513-547.
Suresh, R. (2006). The relationship between barrier courses and persistence in engineering. Journal of College Student Retention, 8(2), 215–239.
Tsapogas, J. (2004). The role of community colleges in the education of recent science and engineering graduates. (NSF 04-315). Arlington, VA: National Science Foundation.
Tyson, W. (2011). Modeling engineering degree attainment using high school and college physics and calculus course taking and achievement. Journal of Engineering Education, 100(4), 1-18.
Whalen, D., & Shelley, M. (2010). Academic success for STEM and non-STEM majors. Journal of STEM Education, 11(1 & 2), 45-60.
Zhang, G., Anderson, T., Ohland, M., Carter, R., & Thorndyke, B. (2004). Identifying factors influencing engineering student graduation and retention: A longitudinal and cross institutional study. Journal of Engineering Education, 93(4), 313–320.