Chemotactic cell trapping in controlled
alternating gradient fields
Börn Meiera, Alejandro Zielinskib, Christoph Weberb, Delphine Arcizeta, Simon Youssefa, Thomas Franoschb,c, Joachim O. Rädlera, and Doris Heinricha,1
aFaculty of Physics and Center for NanoScience, Ludwig-Maximilians-Universität in Munich, Geschwister-Scholl-Platz 1, 80539 Munich, Germany;bArnold
Sommerfeld Center for Theoretical Physics and Center for NanoScience, Ludwig-Maximilians-Universität in Munich, Theresienstrasse 37, 80333 Munich, Germany; andcInstitut für Theoretische Physik, Friedrich-Alexander Universität of Erlangen-Nuremberg, Staudtstrasse 7, 91058 Erlangen, Germany
Edited* by L. B. Freund, Brown University, Providence, RI, and approved May 16, 2011 (received for review October 5, 2010)
Directed cell migration toward spatio-temporally varying chemo-tactic stimuli requires rapid cytoskeletal reorganization. Numerous studies provide evidence that actin reorganization is controlled by intracellular redistribution of signaling molecules, such as the PI4,5P2/PI3,4,5P3 gradient. However, exploring underlying me-chanisms is difficult and requires careful spatio-temporal control of external chemotactic stimuli. We designed a microfluidic setup to generate alternating chemotactic gradient fields for simulta-neous multicell exposure, greatly facilitating statistical analysis. For a quantitative description of intracellular response dynamics, we apply alternating time sequences of spatially homogeneous concentration gradients across 300μm, reorienting on timescales down to a few seconds.Dictyostelium discoideum amoebae re-spond to gradient switching rates below 0.02 Hz by readapting their migration direction. For faster switching, cellular repolariza-tion ceases and is completely stalled at 0.1 Hz. In this“ chemotacti-cally trapped” cell state, external stimuli alternate faster than intracellular feedback is capable to respond by onset of directed migration. To investigate intracellular actin cortex rearrangement during gradient switching, we correlate migratory cell response with actin repolymerization dynamics, quantified by a fluorescence distribution moment of the GFP fusion protein LimEΔcc. We find two fundamentally different cell polarization types and we could reveal the role of PI3-Kinase for cellular repolarization. In the early aggregation phase, PI3-Kinase enhances the capability of
D. discoideumcells to readjust their polarity in response to spatially alternating gradient fields, whereas in aggregation competent cells the effect of PI3-Kinase perturbation becomes less relevant.
eukaryotic chemotaxis∣pseudopod-based motility∣gradient sensing∣ flow chamber
A
prime example for combined intracellular feedback mechan-isms on fast timescales is chemotaxis, where cells sense, polarize, and migrate toward an external chemical stimulus (1). Chemotactic ability plays a crucial role, for example, in cancer metastasis (2), neuron guidance (3), and inflammatory response (4). Identifying and classifying key proteins in these intracellular signaling events is vital for understanding cellular mechanisms and disease development. Exciting progress has been made by the discovery that actin polymerization dynamics in migrating cells are controlled by PI4,5P2/PI3,4,5P3 gradients, allowing for direc-ted chemotactic migration (5–7). Recent publications introduce parallel pathways like PI3-Kinase-based pseudopod formation and phospholipase A2-induced pseudopod splitting at the front of the cell, which enhance chemotactic efficiency (8). However, profound insight into these signaling networks is complicated by rapid reorganization of protein distributions in living cells (9).To stimulate eukaryotic cells, various experimental setups generate chemotactic gradients by utilizing micropipettes (10) or diffusion chambers (11, 12). In recent years, microfluidic mixing in labyrinth-like structures and optically manipulated nanocap-sules improved definition and manipulation of chemical gradients (13–16), whereas microfluidic T-junctions or photoinduced
re-lease of chemotactic stimulants expose individual cells to a rapid, global rise in chemoattractant (17, 18). To evaluate the statistical spread of cellular responses (19), rapidly tunable but spatially homogeneous external stimuli need to be applied to large cell ensembles, while monitoring the upstream and downstream sig-naling events in single cells by fluorescence (20). The influence of the shape of chemotactic stimulation on intracellular protein redistribution and gradient sensing in general has been estab-lished theoretically (21–24), which demonstrate the need to ex-perimentally validate these predictions by systematic, controlled measurements.
Here, we report a microfluidic function generator, producing spatio-temporally tunable but homogeneous gradient fields across 300μm, to analyze the statistical behavior of many cells simultaneously. Based on hydrodynamic focusing, this microflui-dic generator modifies the shape and position of the concentra-tion gradients in a time-dependent manner, which opens unique possibilities for systematic studies of cell polarization response, as a function of switching frequency. Experiments are conducted for a low flow velocity of100μm∕s at the site of the cell ensemble, permitting a diffusive broadening of the concentration interfaces and leaving cells undisturbed by shear stress. Statistical analysis of single-cell response is performed employing the amoeboid model systemDictyostelium discoideum(25). This fast migrating, chemotactic cell type is ideally suited to test experimental limits of fast gradient switching in our setup. We succeeded in increas-ing the switchincreas-ing rate up to the point where cell migration is in-creasingly stalled and finally inhibited. In this chemotactically trapped cell state the external stimulus alternates faster than intracellular feedback is capable to adapt the migration direction. Cell shape analysis is performed to describe the degree of cell polarization, and to elucidate the influence of gradient steepness and PI3-Kinase perturbation on chemotactic response. Further-more, we used a Lim-GFP label to monitor actin polymerization dynamics on the protein level, analyzing the spatio-temporally changing F-actin distribution.
Results
Microfluidic Device Design. We control spatio-temporal changes
in homogeneous chemotactic gradients to investigate both, sin-gle-cell migration and intracellular protein redistribution. Our microfluidic function generator consists of a double T-junction chamber with three separate inlets of variable pressure applica-tion (Fig. 1). A central flow without stimulant (CF) and two side flows (SF1 and SF2), containing the chemotactically active agent,
Author contributions: B.M., D.A., J.O.R., and D.H. designed research; B.M. performed research; A.Z., C.W., S.Y., and T.F. contributed new reagents/analytic tools; B.M., A.Z., C.W., D.A., S.Y., and D.H. analyzed data; and B.M., T.F., J.O.R., and D.H. wrote the paper. The authors declare no conflict of interest.
*This Direct Submission article had a prearranged editor.
1To whom correspondence should be addressed. E-mail: [email protected].
This article contains supporting information online at www.pnas.org/lookup/suppl/ doi:10.1073/pnas.1014853108/-/DCSupplemental.
BIOPHY
SICS
AND
COMPUT
A
T
IONAL
BIOLOGY
APPLIED
PHY
SICAL
SCIENC
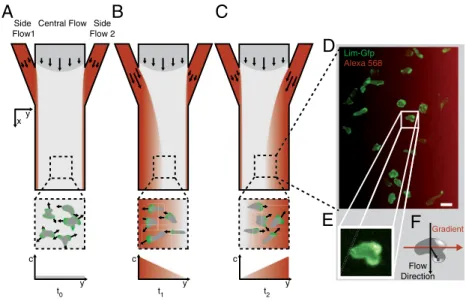
are defined by the hydrodynamic focusing effect (26). In the laminar flow regime, diffusive broadening at their interfaces re-sults in homogeneous gradient profiles with reduced gradient steepness downstream the microfluidic chamber (Fig. S1). Fig. 1
A–Cshow the principle of gradient switching: Initially, cells probe their surroundings by pseudopod extension, a stochastic process inherent to unstimulated cells (t0, Fig. 1A). When a chemotactic stimulus is applied by a controlled displacement of the flow inter-faces, all cells are exposed to a homogeneous chemotactic gradi-ent (t1, Fig. 1B). The stimulated cells polarize and initiate directed migration up the chemotactic gradient for sufficiently long lasting stimuli. A change in gradient direction forces the cells to repolarize and to adjust migration in the new gradient direc-tion (t2, Fig. 1C). Chemotactic gradient and cell fluorescence can
be visualized simultaneously by the DualView technique, allow-ing for quantitative measurements durallow-ing alternatallow-ing chemotactic exposure in live cell experiments (Fig. 1D). We produce very stable gradients with standard deviations of less than 5% over the course of a 2 h experiment (Fig. S2). Furthermore, we implemen-ted automaimplemen-ted image processing to quantitatively analyze the entire cell ensemble on a single cell basis (Fig. 1EandF).
Spatio-temporally Alternating Chemical Gradients.Our setup
en-sures independent control of inflow speeds at all three inflows, which enables us to shape the chemotactic gradients in subtle ways. By alternating inflow speeds of the SFs, the CF is alternat-ingly shifted sideways and all cells experience transitions between changing gradient directions (Movie S1). We compare measured gradient profiles with numerical finite element calculations (FECs) (SI Text), finding them in remarkable agreement in the stationary state (Fig. S1C), and consistently reproducing the tem-poral evolution of the concentration gradients within the flow chamber (Movie S2). To enable homogeneous gradients, a low flow velocity ofv¼100μm∕s is necessary (Fig. S3), which results in a shear stress of less than 0.01 Pa at the position of the cell ensemble. Therefore, undesirable effects that are known to occur at 1–2 Pa, like shear flow induced migration (27) or gene
regula-tion (28), and reducregula-tion of the chemical gradient across the cell diameter (29) can be neglected (Fig. S4). FECs yield a theoretical lower limit oft¼1.5s as transition times between two opposing gradient directions (Fig. S5). In a typical control experiment, 90% of all cells show directed migration toward a stable gradient, prov-ing the viability of our setup (Fig. S6A). For alternating gradients with an exposure time oftE¼600s, 11 out of 15 cells exhibit
pro-nounced directed migration, as displayed in our sample plot in
Fig. S6B, indicating the statistical spread in cell response.
Chemotactic Trapping of Fast Migrating Cells. We explore the
re-sponse times of intracellular signal transduction by reducing gra-dient switching periods fromtE¼300s totE¼10s, investigating
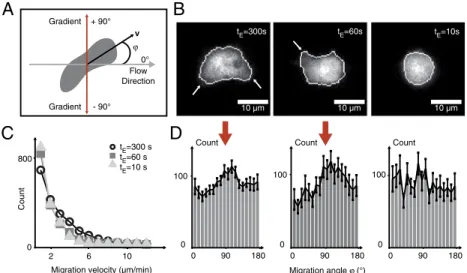
410 gradient switching events out of 42 cells with free GFP label (Movie S3). Cell migration is analyzed by tracking the geometri-cal center of the cell’s projection onto the focal plane, referred to as “cell center of mass”(SI Text). As defined in Fig. 2A, we investigate the migration angle φ between flow and migration direction. Thus,φ¼0corresponds to the flow direction, andφ¼ j90°jto the direction of the chemotactic gradient. For exposure times oftE¼300s, we observe elongated cells, forming
pseudo-pods toward the chemotactic stimulus (Fig. 2B,Left) and migrat-ing with velocities above 6μm∕min (Fig. 2C, circles). The distribution of migration angles displays a distinct peak at φ¼ j90°j, indicating directed migration (Fig. 2D,Left). For reduced exposure times of tE¼60s, cells respond by less pronounced
pseudopod formation (Fig. 2B, Center). We find migration velocities below 6μm∕min for 95% of the cells (Fig. 2C, squares), but theφ-distribution still exhibits a distinct peak in the direction of the stimulus (Fig. 2D, Center). AttE¼10s, cells
round up (Fig. 2B,Right). Few cells exhibit migration velocities of more than2μm∕min (Fig. 2C, triangle), and we find a random distribution ofφ(Fig. 2D, Right). We refer to this cell state as chemotactic cell trapping, characterized by stalled cell migration.
Analysis of Intracellular Protein Redistribution. To correlate the
intracellular F-actin redistribution with the reorientation of cell
Central Flow Side Flow 2
xy
A
Side Flow1
B
C
D
E
F
c c
c
y y
y
t0 t1 t2
Flow Direction
Gradient Lim-Gfp
Alexa 568
locomotion in spatio-temporally varying chemotactic stimuli, we visualize the fusion protein GFP-LimEΔcc, that has been shown to bind to freshly polymerized actin (30) and allows for a quan-titative analysis of protein reorganization during chemotactic cell response. All experiments are performed for exposure times of
tE¼600s, to ensure that cells fully adjust to the respective
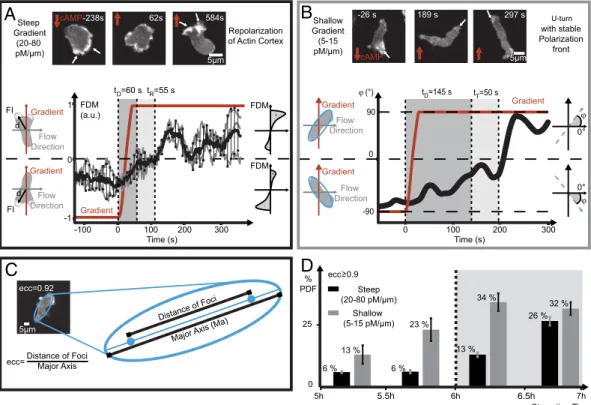
gra-dient direction. We find two characteristic types of cellular migra-tion response (Fig. S6CandD,Movies S4andS5): The major portion of cells in steep gradients (20–80pM∕μm) show internal actin reorganization by continuous formation of new pseudopods (Fig. 3A). While the new polymerization front forms, the prior leading edge becomes the rear of the cell, reversing cell polarity (Fig. 3A, arrows). In contrast, in shallow gradients (5–15pM∕μm) permanently polarized cells are observed primarily (Fig. 3B). These cells maintain their actin front in response to gradient switching, and no dynamic reorganization of the actin network occurs during the U-turn-like cell motion (Fig. 3B, arrows), con-firming previous observations (31, 32). To quantify intracellular reorientation of the actin cytoskeleton architecture, we introduce a fluorescence distribution moment (FDM) as described inSI Text(Fig. 3A,Lower LeftandRight). The FDM is the integrated product of the GFP fluorescence intensityFIof each pixel and its displacement from the cell center of massd. The FDM becomes positive if its vector points parallel to the direction of the gradient and negative if oriented in the opposite direction. A cell, migrat-ing in gradient direction, exhibits pronounced fluorescence inten-sity at the leading edge, which translates into a large positive FDM value. The amplitude of the FDM vector is displayed over time for a repolymerizing cell during three consecutive gradient switches, well reproducible within tight error margins (Fig. 3A,
Center). Temporal analysis of the FDM at the single cell level reveals three distinct regimes of actin polymerization activity: The first phase of cell repolarization is characterized by a delay in response time oftD¼60s, where initial polarity persists after
gradient switching. In the second phase a uniform intensity dis-tribution is found resulting in a reduced FDM. This reorganiza-tion time is observed to last fortR¼55s. In a third phase, the cell
adapts to the new stimulus by forming new protrusions in gradient direction about 3 min after gradient switching. To describe the
migration type of permanently polarized cells, we refine the migration angleφas the angle between the major axis of the cell and the flow direction (Fig. 3B,Lower LeftandRight). The tem-poral evolution ofφshows a response delay oftD¼145s and a
turning time of tT¼50s after a switch in gradient direction
(Fig. 3B,Center).
Influence of Gradient Steepness on Cell Polarization During
Starva-tion.InD. discoideuma starvation time of 6 h is perceived as the
onset of chemotactic aggregation (33). We distinguish between preaggregating cells, starved for 5–6 h, and aggregation compe-tent cells, starved for 6–7 h. Monitoring cells before they enter the aggregation phase defines precise starting conditions in our ex-periments. This approach enables us to distinguish molecular me-chanisms, which initiate a chemotactic response, from cellular behavior, which is influenced by an already existent polarization. We quantify changes in the ratio of transiently polarized cells (Fig. 3A) to highly elongated cells with stable polarization fronts (Fig. 3B), in steep and shallow alternating gradients for 150 and 154 cells, respectively (Fig. S7AandB). Therefore, we determine cell eccentricity (ecc) as the ratio between the major axis of an ellipse, fitted to the cell perimeter, and the foci distance (Fig. 3C). Cells with a stable polarization front yield ecc>0.9(Fig. 3D).
In steep gradients (20–80pM∕μm), 6% of preaggregating cells show ecc>0.9. In shallow gradients (5–15pM∕μm), 13% of the cells show ecc>0.9after 5 h of starvation and 23% at 6 h of starvation. In aggregation competent cells, the percentage of cells with ecc>0.9rises to 13% (after 6 h of starvation) and to 26 % (at 7 h of starvation) in steep gradients. In shallow gradients, we find 34% (after 6 h) and 32% (at 7 h). Overall, more highly elongated cells are observed in the shallow gradient regime. With ongoing starvation, an increase in the ratio of highly polarized cells is found for both gradient regimes.
Starvation Time-Dependent Influence of PI3-Kinase on Cell
Eccentri-city.D. discoideum cells rapidly orient toward the chemotactic
source by establishing a PIP2/PIP3 gradient, inducing the forma-tion of new pseudopods. To gain molecular insight into this intra-cellular control mechanism, we incorporated a pharmacological
A
C
10 µm 10 µm
tE=60s tE=10s
10 µm tE=300s
ϕ
v Gradient + 90°
- 90° 0° Flow Direction
Gradient
B
D
2 6 10
0 800
Migration velocity (µm/min)
Count
tE=300 s tE=60 s tE=10 s
0 90 180
0
0 90 180
0
0 90 180
0
Count Count Count
100 100
100
Migration angle ϕ (°)
Fig. 2. Decrease in gradient exposure times (fromtE¼300s totE¼10s) leads to chemotactically trapped cells (Movie S3). (A) Center of mass motion of migrating cells is analyzed in terms of migration velocityvand migration angleφ, with respect to the flow direction, entailing the direction of the chemotactic gradient atφ¼ 90°. (B) For chemotactic gradient exposure times oftE¼300s, cells show directed pseudopod formation (arrows,Left) and subsequent migration in gradient direction. For shorter exposure times oftE¼60s, pseudopod extension is less pronounced (arrow,Center). For more rapid switching (tE¼10s) cells round up and pseudopod formation is absent (Right). (C) Motion analysis for 410 switching events out of 42 cells with free GFP label reveals a decrease in migration velocities for exposure times oftE¼60s andtE¼10s, whereas for an exposure time oftE¼300s, a large number of cells exhibits migration velocities above6μm∕min. (D) Analysis of the cellular migration angle for 410 switching events out of 42 cells with free GFP label: A distinct peak in the direction of the chemotactic gradients atφ¼ 90° is observed for exposure times oftE¼300s andtE¼60s (red arrow), whereas a nearly uniform angle distribution is observed for rapid switching withtE¼10s, indicating a chemotactically trapped cell state, where cells cannot follow the fast gradient switching due to slower internal repolarization times.
BIOPHY
SICS
AND
COMPUT
A
T
IONAL
BIOLOGY
APPLIED
PHY
SICAL
SCIENC
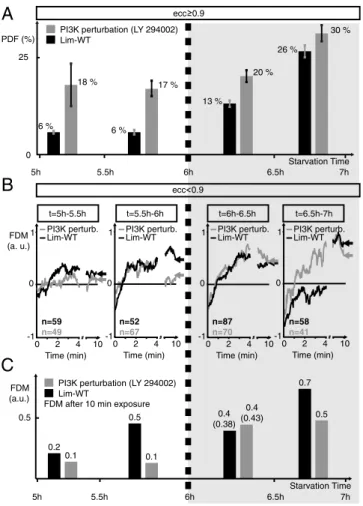
perturbation of PIP2 phosphorylation. The drug LY 294002 disturbs multiple isoforms of PI3-Kinases (34), having a strong impact on PIP2/PIP3 conversion. We perform measurements on 150 untreated cells and 185 drug treated cells in steep gradients (20–80pM∕μm) for starving times from 5–7 h, constituting the transition period from preaggregating cells to aggregation com-petent cells (Fig. S7AandC). In preaggregating cells, perturba-tion of PI3-Kinase results in 18% of highly elongated cells with ecc>0.9after 5 h of starvation and 17% at 6 h of starvation (Fig. 4A). In contrast, we only observe 6% for unperturbed cells. In aggregation competent cells (6–7 h), the influence of PI3-Kinase perturbation on cell polarization is strongly reduced. We observe 13% (after 6 h) and 26% (at 7 h) strongly polarized cells with PI3-Kinase fully functional, and 20% (after 6 h) and 30% (at 7 h) with PI3-Kinase perturbation. The perturbation of PIP2 phosphorylation by PI3-Kinase results in more stably polarized cells at the start of our experiments, before cells enter the aggre-gation phase.
Starvation Time-Dependent Influence of PI3-Kinase on
Chemotacti-cally Induced Cell Repolarization.In repolarizing cells (ecc <0.9),
rearranging their actin cortex in response to switches in gradient direction, the FDM is investigated for advancing starvation times (5–7 h) (Fig. 4B). In preaggregating cells, we find that PI3-Kinase perturbation impedes cell repolarization, whereas significant ac-tin reorganization is found in unperturbed cells (Fig. 4B,Left). After 6 h of starvation, the influence of PI3-Kinase perturbation ceases and both cell types show pronounced repolarization
beha-vior (Fig. 4B,Center Right). Untreated cells show a slowing down in readjustment to the new gradient direction at 7 h of starvation, eventually reaching comparable FDM values after 10 min (Fig. 4B,
Right). For clarity, Fig. 4C shows FDM values after 10 min of chemotactic stimulus (as indicated by the black and gray arrows in Fig. 4B). More than 40 switches in chemotactic gradient exposure are averaged for each cell type and starvation period.
Discussion
We developed a microfluidic device for controlled application of alternating chemotactic gradient fields to large cell ensembles. This setup exhibits key innovative features: (i) control over ra-pidly alternating but homogeneous gradients, and (ii) exposure of entire cell populations to homogeneous gradients, extending across 300μm. We study subtle differences of cell shapes and the fluorescence distribution of actin polymerization activity FDM inD. discoideumcells by evaluating a large number of cells. All cells are subjected to the same homogeneous gradient, as com-pared to reported experiments (16, 17) addressing cells one by one. The steady, reproducible flow in our microfluidic setup pre-vents distortions of the gradient profile by remnants of previous chemotactic stimuli or by a global rise in background chemoat-tractant concentration (9, 16). Our reproducible and stable gra-dients can switch directions with a theoretical lower limit of
t¼1.5s. Insight into the control of cell locomotion by cytoske-leton reorganization, which is mediated by intracellular signaling, is gained by combined observation (i) of polarized actin gelation
A
B
D
C
via microfluorescence and (ii) of cell shape changes during migra-tion in chemotactic gradients.
For gradient switching frequencies of 0.02 Hz, we observe di-rected cellular motion toward the new direction of chemotactic stimulus, whereas at 0.1 Hz cells are trapped chemotactically. The external chemotactic gradient field alternates faster than in-tracellular signaling is capable to respond by cell reorientation. This observation agrees well with previously reported F-actin dynamics inD. discoideumcells, induced by global chemotactic stimulation (5, 17). They show that cAMP induces an actin poly-merization peak at approximately 10 s (0.1 Hz) and persistent actin polymerization after roughly 1 min (0.02 Hz), in good agree-ment with our values for the onset of frustrated cell migration, and therefore, chemotactic cell trapping in alternating gradient fields. When correlating actin repolymerization dynamics with cell migration after a switch in gradient direction, we observe an adaptation time of approximately 3 min forD. discoideumcells to completely rearrange their actin polymerization activity before
initiating migration in the reversed direction. This adaption time is in good agreement with an average periodicity of approximately 3 min, observed for repetitive elongated and cringed motion states in migrating cells without external stimuli (35, 36).
Analysis of cell shape and FDM reveal fascinating results, implying that the impact of PI3-Kinase strongly depends on star-vation time. PI3-Kinase is known to stimulate the formation of new pseudopods in steep chemotactic gradients (37). Yet, in shallow gradients, perturbation of PI3-Kinase influences D. dis-coideumchemotaxis weakly (32). Hence, parallel molecular me-chanisms are proposed for D. discoideum chemotaxis signaling (8). Now our results imply that the balance between the PI3-Ki-nase pathway, which allows for fast reorientation of the cell, and the phospholipase A2 (Pla2) pathway, which mediates persistent cell migration, strongly depends on gradient steepness as well as on starvation time. Because of the intrinsic behavior of cells and those parallel pathways, an absolute threshold, deciding which pathway is preferred cannot be expected. Instead both response behaviors are observed in parallel, but with a changing ratio be-tween repolymerizing cells and cells that perform U-turns. In steep gradients we primarily find PI3-Kinase based formation of new pseudopods after 5 h of starvation. This effect decreases with ongoing starvation time, as well as with a reduction of gradient steepness. The shift away from a PI3-kinase-based intracellular signaling to a persistent cell polarization, as proposed by the Pla2 pathway, is also observed when PI3-Kinase is perturbed through the addition of drugs. Here, we explicitly find a strong depen-dence of PI3-Kinase perturbation on starvation time, as shown in Fig. 4. We identify a higher ratio of elongated cells in early starvation but a decreased impact for starvation times of more than 6 h. One possible explanation for this starvation time depen-dence could be that a rapid change in migration direction, as mediated by PI3-Kinase, is important forD. discoideumcells dur-ing early starvation, whereas it is more important for aggregatdur-ing cells to persistently migrate toward the initial chemotactic source. Consecutive experiments will help to advance the understand-ing of the dynamic and spatial redistribution of other chemotactic key regulators like Rac GTPase and PI3 phosphatase PTEN. In principle, this microfluidic gradient generator allows for the local stimulation of single cells or whole developing organisms (2, 38) with specific molecular gradients, which is necessary in a broad range of research areas, notably in cell and developmen-tal biology. Ensembles of cells can be subjected simultaneously to chemotactic gradients and biochemical agents, by large scale bidirectional chemical gradients. The spatial, temporal, and chemical flexibility makes it applicable not only to gain insights into complex intracellular feedback schemes, but it may also lay the ground for advanced assays in drug delivery, inflammatory response, embryogenesis, and angiogenesis.
Materials and Methods
Microfluidic Function Generator.We useμ-slide 3-in-1 microfluidic chambers (Ibidi) with three0.4×1.0mm2inflows, that converge under an angle of α¼32° to the main channel of dimension0.4×3.0×23.7mm3. Both SFs are connected to reservoirs, built from two 50 mL syringes (Braun Melsungen AG), separately connected to a customized suction control pressure pump (Nanion). Two micrometer valves (Upchurch Scientific) reduce the flow velocities at the SFs. The CF is connected to an infusion syringe pump (TSE Systems), which generates a stable flow of1mL∕h. Measurements were per-formed with an Axiovert 135 TV microscope (Zeiss), with LD Plan-Neofluar objectives20x∕0.50N:A:and 40x∕0.75N:A:(Zeiss) in combination with a DV2 DualView system (Photometrics).
A solution of 1μM Alexa Fluor 568 hydrazide (Invitrogen) was used to characterize the concentration profile of cAMP (Sigma-Aldrich) because of their comparable molecular weight.
Cell Culture.All cells are derived from theD. discoideumAX2 strain. Cells with free GFP expressed in AX2 background (39) are used for cell tracking, whereas cells with LimEΔcc-GFP expressed in a LimEΔcc-null AX2 background (40) are used for FDM analysis (SI Text). LimEΔcc mutant cells are grown in 5.5h
0
0 2 4 10
1 -1 FDM (a. u.) Time (min) 0
0 2 4 10
1
-1
Time (min) 0
0 2 4 10
1 -1 Time (min) 25 0 PDF (%) ecc 0.9
5.5h 6h 6.5h
5h 7h
Starvation Time
0
0 2 4 10
1
-1
Time (min) Lim-WT
PI3K perturbation (LY 294002)
ecc 0.9
A
B
n=59 n=49 n=52 n=67 n=87 n=70 n=58 n=416 % 6 %
13 %
26 %
18 % 17 %
20 % 30 % Lim-WT PI3K perturb. Lim-WT PI3K perturb. Lim-WT PI3K perturb. Lim-WT PI3K perturb. 0.2 0.1 0.5 0.1 0.4 (0.38) 0.4 (0.43) 0.7 0.5 0.5 6h 6.5h 5h 7h Starvation Time FDM (a.u.)
FDM after 10 min exposure
t=5h-5.5h t=5.5h-6h t=6h-6.5h t=6.5h-7h
C
Lim-WT
PI3K perturbation (LY 294002)
Fig. 4. Impact of PI3-Kinase perturbation on cell polarization and repoly-merization dynamics for advancing starvation time. (A) Changes in ratio of permanently polarized cells (ecc>0.9), depending on starvation times from 5–7 h. We average over 185 cells treated with the drug LY 294002 per-turbing PI3-Kinase (gray), and over 150 untreated cells (black). Error bars display the variance. (B) Temporal evolution of the FDM for 150 untreated cells (black) and for 185 cells treated with LY 294002 (gray) during alternating gradient exposure fortE¼10min. The number of gradient switches ana-lyzed in each plot is given byn. In cells starved for 5–5.5 h, only unperturbed cells show a slight repolymerization behavior. After 5.5–6 h of starvation, both cell types show initial repolymerization, but drug treated cells loose stable polarization after 10 min. After 6 h of starvation, polarization of both cell types is pronounced and comparable. After 6.5 h of starvation, drug treated cells repolarize faster, whereas untreated cells show delayed re-sponse, reaching comparable polarization states after 10 min of chemotactic gradient exposure. (C) Mean FDM values aftertE¼10min of chemotactic exposure in alternating gradient fields, as indicated by the arrows inB.
AX2 nutrition medium, containing10μg∕mL Geneticin 418 disulfate salt (G418) (Sigma-Aldrich) and10μg∕mL Blasticidine S hydrochloride (Sigma-Aldrich), whereas free GFP mutants are treated with20μg∕mL G418.
Live Cell Experiment.Cells are concentrated toc¼5×10⁶cells∕mL in shaking culture (150 rpm). Five hours prior to the experiment, cells are washed with 17 mM K-Na PBS pH 6.0 (Sigma-Aldrich). Cells are introduced into the micro-fluidic chamber atc¼2.5×10⁵cells∕mL. cAMP atc¼1×10⁻⁶M is added as chemoattractant for measurements displayed in Fig. 2 andMovies S1,S3,S4, S5, and atc¼2×10⁻⁴M for measurements displayed in Fig. 3 and Fig. 4. PI3-Kinase was inhibited using 50μM (0.17% DMSO) LY 294002 (L9908, Sigma-Aldrich). Measurements are performed with cells starved for 5–7 h. Cell center of mass is extracted using the CellEvaluator algorithm (SI Text).
Velocity and angle distributions in Fig. 2 are calculated over 10 frames, with a frame rate ofð2.5sÞ−1. A frame rate ofð2sÞ−1is used for FDM and eccentricity analysis in Fig. 3 and Fig. 4. Cell eccentricity is obtained using the regionprops function in Matlab 2010a (Mathworks).
ACKNOWLEDGMENTS.We acknowledge support from the Statistical and
Bio-logical Physics Chair , E. Frey, at the Arnold Sommerfeld Center of Theoretical Physics at Ludwig-Maximilians-Universität in Munich and we thank G. Gerisch (Max Planck Institute of Biochemistry) for providing us withD. discoideum cells. This work was funded by the German Excellence Cluster Nanosystems Initiative Munich, Deutsche Forschungsgemeinschaft Grant HE 5958/2-1 (to B.M. and D.H.), a Microsoft Research European PhD scholarship (S.Y.), and Volkswagen Foundation Grant I/85100.
1. Weiner OD (2002) Regulation of cell polarity during eukaryotic chemotaxis: The chemotactic compass.Curr Opin Cell Biol14:196–202.
2. Coultas L, Chawengsaksophak K, Rossant J (2005) Endothelial cells and VEGF in vascular development.Nature438:937–945.
3. Gundersen RW, Barrett JN (1979) Neuronal chemotaxis—chick dorsal-root axons turn toward high-concentrations of nerve growth-factor.Science206:1079–1080. 4. Martin P, Leibovich SJ (2005) Inflammatory cells during wound, repair: The good, the
bad and the ugly.Trends Cell Biol15:599–607.
5. Chen L, et al. (2003) Two phases of actin polymerization display different dependen-cies on PI(3,4,5)P-3 accumulation and have unique roles during chemotaxis.Mol Biol Cell14:5028–5037.
6. Insall RH, Weiner OD (2001) PIP3, PIP2, and cell movement—similar messages, differ-ent meanings?Dev Cell1:743–747.
7. Sackmann E, Keber F, Heinrich D (2010) Physics of cellular movements.Annu Rev Con-dens Matter Phys1:257–276.
8. Boosgraf L, van Haastert PJM (2009) Navigation of chemotactic cells by parallel signaling to pseudopod persistence and orientation.PloS One4(8):e6842. 9. Samadani A, Mettetal J, van Oudenaarden A (2006) Cellular asymmetry and
individual-ity in directional sensing.Proc Natl Acad Sci USA103:11549–11554.
10. Futrelle RP (1982) Dictyostelium chemotactic response to spatial and temporal gradients—theories of the limits of chemotactic sensitivity and of pseudo-chemotaxis.
J Cell Biochem18:197–212.
11. Zicha D, Dunn GA, Brown AF (1991) A new direct-viewing chemotaxis chamber.J Cell Sci99:769–775.
12. Boyden S (1962) The chemotactic effect of mixtures of antibody and antigen on polymorphonuclear leucocytes.J Exp Med115:453–466.
13. Dertinger SKW, Chiu DT, Jeon NL, Whitesides GM (2001) Generation of gradients having complex shapes using microfluidic networks.Anal Chem73:1240–1246. 14. Irimia D, et al. (2006) Microfluidic system for measuring neutrophil migratory
responses to fast switches of chemical gradients.Lab Chip6:191–198.
15. Kamholz AE, Yager P (2001) Theoretical analysis of molecular diffusion in pressure-driven laminar flow in microfluidic channels.Biophys J80:155–160.
16. Krees H, et al. (2009) Cell stimulation with optically manipulated microsources.Nat Methods6:905–909.
17. Beta C, Wyatt D, Rappel W, Bodenschatz E (2007) Flow photolysis for spatio-emporal stimulation of single cells.Anal Chem79:3940–3944.
18. Kuczenski B, Ruder WC, Messner WC, LeDuc PR (2009) Probing cellular dynamics with a chemical signal generator.PloS One4(3):e4847.
19. Muzzy D, van Oudenaarden A (2009) Quantitative time-lapse fluorescence microscopy in single cells.Annu Rev Cell Dev Biol25:301–327.
20. Brandman O, Meyer T (2008) Feedback loops shape cellular signals in space and time.
Science322:390–395.
21. Xiong Y, Huang C-H, Iglesias PA, Devreotes PN (2010) Cells navigate with a local-excitation, global-inhibition-biased excitable network. Proc Natl Acad Sci USA
107:17079–17086.
22. Parent CA, Devreotes PN (1999) A cell’s sense of direction.Science284:765–770. 23. van Haastert PJM, Postma M (2007) Biased random walk by stochastic fluctuations
of chemoattractant-receptor interactions at the lower limit of detection.Biophys J
93:1787–1796.
24. Endres RG, Wingreen NS (2008) Accuracy of direct gradient sensing by single cells.Proc Natl Acad Sci USA105:15749–15754.
25. Janetopoulos C, Firtel RA (2008) Directional sensing during chemotaxis.FEBS Lett
582:2075–2085.
26. Lee GB, Chang C-C, Huang S-B, Yang R-J (2006) The hydrodynamic focusing effect inside rectangular microchannels.J Micromech Microeng16:1024–1032.
27. Decave E, Garrivier D, Bréchet Y, Fourcade B, Bruckert F (2002) Shear flow-induced detachment kinetics ofDictyostelium discoideumcells from solid substrate.Biophys J82:2383–2395.
28. Papadaki M, Eskin SG (1997) Effects of fluid shear stress on gene regulation of vascular cells.Biotechnol Prog13:209–221.
29. Beta C, Fröhlich T, Bödeker HU, Bodenschatz E (2008) Chemotaxis in microfluidic devices—a study of flow effects.Lab Chip8:1087–1099.
30. Prassler J, et al. (1998) DdLim is a cytoskeleton-associated protein involved in the protrusion of lamellipodia inDyctiostelium.Mol Biol Cell9:545–559.
31. Kay RR, Langridge P, Traynor D, Hoeller O (2008) Changing directions in the study of chemotaxis.Nat Rev Mol Cell Biol9:455–463.
32. Andrew N, Insall RH (2007) Chemotaxis in shallow gradients is mediated indepen-dently of PtdIns 3-kinase by biased choices between random protrusions.Nat Cell Bio9:193–200.
33. Fisher PR, Merkl R, Gerisch G (1989) Quantitative analysis of cell motility and chemo-taxis inDictyostelium discoideumby using an image processing system and a novel chemotaxis chamber providing stationary chemical gradients.J Cell Biol108:973–984. 34. van Haastert PJM, Keizer-Gunnink I, Kortholt A (2007) Essential role of PI3-kinase and phospholipase A2 inDictyotelium discoideumchemotaxis.J Cell Biol177:809–816. 35. Schindl M, et al. (1995) Cell-substrate interactions and locomotion ofDictyostelium
wild-type and mutants defective in three cytoskeletal proteins: A study using quanti-tative reflection interference contrast microscopy.Biophys J68:1177–1190. 36. Etzrodt M, et al. (2006) Time-resolved responses to chemoattractant, characteristic of
the front and tall ofDictyosteliumcells.FEBS Lett580:6707–6713.
37. Loovers HM, et al. (2006) Distinct roles of PI(3,4,5)P3 during chemoattractant signaling inDictyostelium: A quantitative in vivo Aanalysis by inhibition of PI3-Kinase.Mol Biol Cell17:1503–1513.
38. Gregor T, Wieschaus EF, McGregor AP, Bialek W (2007) Tank DW stability and nuclear dynamics of the bicoid morphogen gradient.Cell130:141–152.
39. Gabriel D, et al. (1999) The contractile vacuole network ofDictyosteliumas a distinct organelle: Its dynamics visualized by a GFP marker protein.J Cell Sci112:3995–4005. 40. Bretschneider T, et al. (2004) Dynamic actin patterns and Arp2/3 assembly at the