5
XI
November 2017
559
©IJRASET (UGC Approved Journal): All Rights are ReservedAdvanced and Improved Non-Destructive
Method for Rail Axle Inspection
Venkatesh C Bhagwat1
1
Assistant Professor, Mechanical Engineering Department Sreenidhi Institution of Science and Technology, Yamnampet, Ghatkesar, Hyderabad, Telangana 501301
Abstract: The increasing use of high-speed trains, resulting in higher stress to the material and serious accidents with human injuries in the past, lead to a demand for shorter inspection intervals, extended scope of inspection and more stringent test requirements to be applied to the critical components. One component, which is inspected in regular intervals, is the axle of the railway wheel set. The manual ultrasonic inspection of used axles by experienced personal is time consuming (since several sound beam angles have to be used to cover the complete test area), expensive, and of course, subjective.
Rail axles Inspection is carried out in depot, and methods used are magnetic particle inspection, ultrasonic and eddy current methods. However, manual intervention is required for all these methods. One alternative method of crack detection for railway axle inspection has been proposed. AC Thermography method is for the exposed body of the axles and aims to improve the speed of the inspection and improve crack detection reliability. Using the rail axle by passing an alternating current and observing the heat patterns produced on a thermal camera is a potential method of carrying out this project. The project describes modelling and experimental work showing how the method could be deployed in the workshop.
I. INTRODUCTION
Non-destructive Testing is one part of the function of Quality Control and is complementary to other long established methods. By definition non-destructive testing is the testing of materials, for surface or internal flaws or metallurgical condition, without interfering in any way with the integrity of the material or its suitability for service.
Whilst being a high technology concept, evolution of the equipment has made it robust enough for application in any industrial environment at any stage of manufacture - from steel making to site inspection of components already in service. A certain degree of skill is required to apply the techniques properly in order to obtain the maximum amount of information concerning the product, with consequent feedback to the production facility. Non-destructive Testing is not just a method for rejecting substandard material; it is also an assurance that the supposedly good is good.
In order to truly understand the effects, benefits and need of non-destructive testing when compared to other forms of testing we have to understand the basics and types of non-destructive testing.
Radiography Magnetic Particle Crack Detection Dye Penetrant Testing Ultrasonic Flaw Detection Eddy Current and Electro-magnetic Testing
A. Experimental Details 1) Proposed Method. 2) One method is described, 3) AC thermography.
4) The principle of the method is described below.
B. AC Thermography.
560
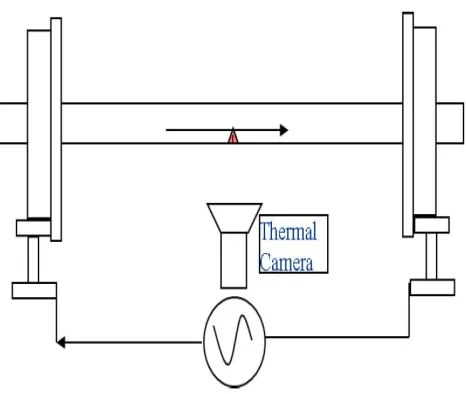
©IJRASET (UGC Approved Journal): All Rights are ReservedFig 1 Principle of AC thermography technique
A high frequency electric current is passed through the axle when it passes over the inspection station, causing it to heat slightly. The current flow is distorted near a crack and this result in a different heating pattern. This method which is very sensitive and capable of detecting cracks of 0.8mm deep, only if the right conditions can be reached.
It has been shown by some workers that the heat is generated at the crack corners formed between the metal surface and the crack, whereas others show a pattern is similar to the current distribution assumed by the AC Field Measurement (ACFM)technique, giving a lower temperature at the crack centre and hot spots at the crack ends.
To deploy it through the wheel using a direct application of the current rather than induced current solves the problem of the inducing coil being in the way of the camera, but introduces some additional technical problems.
AC Thermography. The original concept of this project was to carry out an inspection of a train axle as it passes an inspection station. The present proposed method works by detecting the heat patterns due to the propagation of electric current past a crack. This process has been described many times for the ACFM method and the detection of cracks has been described recently. The latter reference uses an induction method for producing the current, so it was decided to include this method albeit on a much larger scale than had been attempted previously, and to be used in a workshop.
However, to inspect a moving axle, the electric current has to be passed directly through the axle and this can be shown in below figure.
Figure 1 Configurations of the induction system
561
©IJRASET (UGC Approved Journal): All Rights are ReservedLeft: track mounted system using direct AC. Right: axle mounted on rollers and workshop using induced AC. he project was attempted using modelling and with practical trials, which are described below.
II. MODELING OF AC THERMOGRAPHY.
The modeling of the process was one of the first main important steps required to carry out the project and this was done by thorough understanding the level of current and best frequency required for the heating process and also to understand the geometry of the indication from the point of view of detecting it thermally.
Several important investigations about aspects of the technique have been made by following three simple steps. Step 1: Amplitude of the required current and its Frequency.
Step 2: Mode of technique of generating the required high current. Step 3: Total view of field of the thermal camera and its Sensitivity.
A. Amplitude of the required current and its Frequency.
Amplitude of the required current and its Frequency is one of the most important criteria to display the flaw that has been investigated by modelling. It was carried out using the COMSOL software ie 2D models were set up. Later 3D models were generated.
The crack gap was set at 100μm and the heating time was up to 3s. The potential at the electrodes was set at 1V (meaning that the current was less for higher frequency). 2D models were used first. Figure shows a typical result.
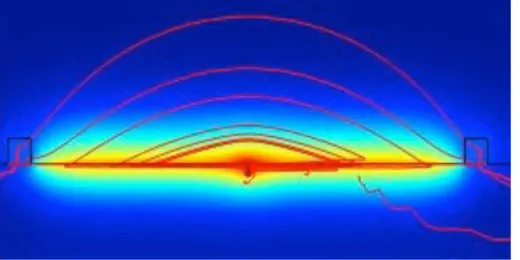
Fig 2 Showing heating and electric field for 20 KHz, 2 mm deep crack
[image:4.612.188.448.319.449.2]An Indication of crack through 2D models was successful to some extent but could not give a full explanation of crack depth so for this purpose 3D full size model was attempted. The potential shown by the 2D model resulted in 3D model for full axle which proved successful and this result output is shown in the following figure.
562
©IJRASET (UGC Approved Journal): All Rights are ReservedB. Mode of technique of generating the required high current.
The mode of generating the required optimum current of right frequency and potential was discussed earlier step 1, and this carried further in this step 2 of generating the current and this is done by validating the explained models by dealing the investigation initially with small scale tests of experiment that was carried out precisely for the expected results[15].
Along with the modeling work explained in step 1, a series of practical trials were carried out side by side. At first this set of trials was experimented on small scale later on full working axle was tested.
C. Carried Practical Trials of Experiment.
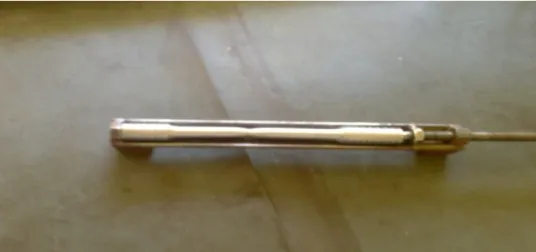
[image:5.612.182.450.206.332.2] [image:5.612.211.421.599.722.2]Experiments were carried out in two ways first on small scale, second on large scale full axle. This is as followed. Specimen used i.e. Steel bar of 20mm diameter is as shown in below figure
Figure showing the steel bar of 20mm diameter D. Small Scale Test
To carry out the small scale, set of three samples of 20mm steel bar were manufactured with fatigue crack of different size of 0.9mm, 1.7mm and 4.3mm deep. This fatigue crack depth was accurately measured by ACPD i.e. An ACPD method has been developed as an NDT technique that can accurately characterize surface breaking fatigue cracks in metal specimens. The required high current was able to pass through them by means of direct heating.
Direct Heating setup for a small scale sample
E. Full Axle Test Setup.
The mode of heating to this setup is through induction system. The full scale arrangements for an axle by induction heating system is shown in below figure
563
©IJRASET (UGC Approved Journal): All Rights are ReservedClear picture of the method is again shown with the below figure.
Figure showing the Induction type of heating system.
F. Total view of field of the thermal camera and its Sensitivity.
Investigations were carried out for the total view of field of the thermal camera. This was done by making a practical trial of experiment by conducting on full scale working axle. Application of direct current on full axle is as shown in figure.
Direct Heating of Complete Wheel set (Front View)
III. RESULTS AND DISCUSSION
The results of all the experiments described in the previous chapter are put forth in this chapter. Also explanations to some of the characters displayed by the 20mm steel bar specimen are discussed. Care has been taken to prevent any errors in data collection or in calculations.
By looking at the figure 1.6 we can’t understand the concept of the method and Probabality of crack detection, so to detect the crack in more easy way a cross section of the crack was taken to get a better idea and this is shown in the below figure .
Oscillator
Test
Specimen Full Axle
Oscillator Amplifier
Full Axle
564
©IJRASET (UGC Approved Journal): All Rights are ReservedGraph2.1 Showing Surface temperature with 2mm deep crack at 100 KHz.
From the above graph 5.1 we can clearly detect the crack.It shows in X-axis the applied Temperature in Kelvin, it shows that the surface temperature is 298.65°K and crack temperature to be 299.25°K. In Y-axis is the arc length ie the length of the crack depth from the surface. This is shown in below table 2.1.
Applied Frequency, Potential
Surface Temp (°K)
Crack Temp (°K) 100KHz,
1V
298.65 299.25
Table2.1 Showing the Surface Temperature and Crack Temperature at 100KHz1V.
Keeping this in mind, various sets of 2D trials were conducted and comparison was made particularly for crack. Comparison of crack was made starting with 20 KHz and there by varying the frequency to 100 KHz and 500 KHz by keeping the potential to 1 V. This is Shown in following Table 2.2.
Applied
Frequency,Potential
Surface Temp (°K)
Crack Temp (°K)
20KHz , 1V 299.8 300.7
100KHz , 1V 298.6 299.25
500KHz , 1V 298.4 299.5
565
©IJRASET (UGC Approved Journal): All Rights are ReservedThe above results were plotted in the graph 2.2 and the following results were obtained.
0 100 200 300 400 500
298.0 298.5 299.0 299.5 300.0 300.5 301.0 T e m p e ra tu re ( K ) Frequency (KHz)
1 V, Surface 1 V, Crack
Graph 2.2 Crack and Surface temperature Comparison of 2D models.
Next Comparison was made by changing the potential to 2V and varying the frequency 20 KHz, 100 KHz and 500 KHz. This is shown in below table 5.3.
Applied Frequency, Potential Surface Temp (°K) Crack Temp (°K) 20KHz , 2V
304 305.1
100KHz , 2V
303.6 306
500KHz , 2V
302.5 307
Table2.3 Comparisons of Surface and Crack Temperature at 2V.
The results were observed by plotting the contents of above table 2.3 in the graph
.
566
©IJRASET (UGC Approved Journal): All Rights are ReservedFrom the point of view of discrimination the 2D models Showing the Graph 5.2 and Graph 5.3 it appears to be advantage to use as a high a frequency of 500 KHz and potential of 2 V. This gives the better crack detecting probability i.e. Crack temperature being 307°K as the surface temperature being 302.5°K.
However, the results till now show only the internal temperature and it must be remembered that the main purpose of this project is to make sure a sufficient rise in temperature that is required to produce an effective infrared output. For this purpose sufficient required current i.e. frequency was set to 500 KHz and potential to be 2 V, which gave the optimum result that was necessary to capture heat patterns across crack gap associated areas. This was concluded by gradual increase in frequency from 20 KHz to 100 KHz to 500 kHz an potential from 1 V to 2 V.
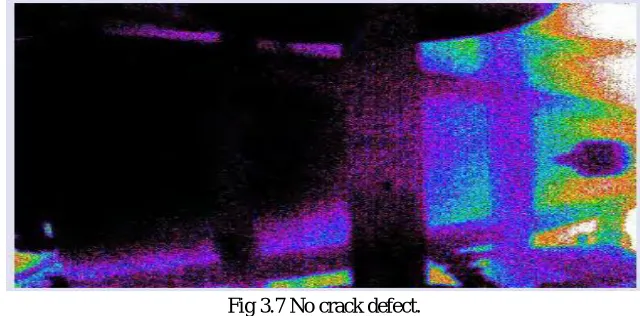
[image:9.612.183.447.235.313.2]The experiment was carried with direct heating starting with steel bar painted black for quick heating purposes so that it can be more visible in thermal camera, For this purpose Thermoteknix 310L camera was used to take thermal image. So steel bar of 0.9mm fatigue crack was used to check the possibility of visual which proved to be fatal i.e. no proper thermal image could be seen.As this can be seen in the below figure 3.1.
Fig 3.1Showing the fatigue crack of 0.7mm small scale sample of 20mm steel bar.
The above figure 5.1 was not pictorially clear to recognize the crack points, so the next sample of 1.7 mm fatigue crack was used again by direct heating. Again for this to no proper visibility was seen. This is shown in below figure 3.2.
Fig 3.2 Showing the fatigue crack of 1.7mm of 20mm diameter steel bar.
[image:9.612.221.410.560.720.2]So the final sample of 4.3mm fatigue crack of steel bar was taken and experiment was carried out with direct heating. Using Thermoteknix 310L camera the thermal image was taken and could get satisfaction result of detecting the crack tips, which were morenoticeable than the rest of the steel samples. This result is seen in the below figure 3.3.
567
©IJRASET (UGC Approved Journal): All Rights are ReservedFrom the above figure 5.3 we could easily distinguish between the three samples of steel bar of 20mm diameter. Crack can be easily noticeable in 4.3mm fatigue crack of steel bar because reason is simple, when current is passed across the steel bar by direct heating the crack gets heats up due to this reason the crack tips can be seen. This is shown in the above figure 3.3.
[image:10.612.186.448.157.289.2]An Axle is made to rotate on its axis as shown in figure 4.11 by a set of rollers connected at the end. This is done to completely cover the axle surface without missing any portion of the surface. A thermal image was taken to see any crack defect in the full axle, by scanning the whole axle. The visibility of hot spot from crack end was seen. This is shown in the below figure 3.4.
Fig 3.4 Clear view of Hot spot from crack end.
Through this set of experiments we could conclude that mode of generating the current was done by two ways. A. Direct Heating.
B. Induction Heating
C. Direct Heating was done for the small sale test and D. Induction Heating was carried for full scale axle setup.
Then AC Thermography Experiment was attempted on full scale axle and its methods and results are discussed in this topic.
By doing the various set of trials, the availability of axle was limited, axles with cracks were not available for this test but for the total field view of thermal camera an image is required. Hot spot on axle was seen by careful observation.
The above image was not still clear so it was magnified and again seen in the camera and could see a small thread like warm wire on an axle as shown in figure 3.5.
Fig 3.5 Showing warm wire on an axle surface.
[image:10.612.131.502.463.682.2]568
©IJRASET (UGC Approved Journal): All Rights are ReservedFurther for sake of experiment point of view to check the working of the method, field trials were carried out with real working axle and this is shown in below figure 5.6.
[image:11.612.154.474.129.287.2]The view from Thermal Camera of the above tests were taken and image was properly examined crack defect was not seen This is shown in below figure 3.7.
Fig 3.7 No crack defect.
With no crack seen other boogie of wheel set was tested and again the result was same that there was no crack on the working axle.
IV. CONCLUSIONS
On the basis of the above tests the following conclusions were derived.
A. AC Thermography Technique was shown to be more feasible by modeling studies. B. Sensitivity of crack detection increases with amplitude of frequency and current. C. Maximum Thermal Response was obtained from the crack ends.
D. Other than the Thermal Response from the crack ends additional effect was obtained from the crack center. E. Using AC Thermography size of the crack can easily be measured.
F. The 2D model indicating a hot spot at the crack location was seen to be much smaller in amplitude than the hot spot at the crack ends in the 3D model.
G. Mode of current generation was done by two ways. 1) Direct Heating.
2) Induction Heating.
H. Hot spot of the crack end was clearly seen in the large scale tests but was not clearly observed in the small scale tests.
I. Through Induction System of current generation the probability of crack detection was much higher but currently it is not in use for full scale axles.
REFERENCES
[1] WIDEM EU Project. ‘Wheelset Integrated Design and Effective Maintenance’.Website: www.widem.org.
[2] Kappes, W., Bähr, W., Kröning, M., Rockstroh, B., Rodner, C., Goetz, J., Nemec, D.,)‘Application of new front-end electronics for NDT of Railroad wheel sets’. Paper The 1.4.1 European Conference of NDT, Berlin 2006.
[3] Health and Safety Executive (HSE) ‘Railway accident at Rickerscote’. November1996. ISBN 071761171X. HMSO. [4] UK Health and Safety Executive ‘Programme for the Assessment of NDT in Industry’Parts 1,2,3 (1996,1999,2006) [5] TTCi, ‘Remotely Detecting Cracks in Moving Freightcar Axles’ TTCi ReportSAFETY-08 August 2006
[6] Hoddinot DS. ‘Railway axle failure investigations and fatigue crack growth monitoringof an axle’. J. Rail and Rapid Transit 2004;218:283-292.
[7] Transportation Safety Board of Canada. ‘Main track derailment: Canadian nationaltrain No.G-894-31-14’. Railway Investigation Report R01Q0010, 2001. [8] Schijve J. Fatigue of Structures and Materials. Kluwer Academic Publishers, NewYork, USA, 2004.
[9] Akid R, Miller KJ. ‘Short fatigue crack growth behaviour of a low carbon steel undercorrosion fatigue conditions’. Fatigue Fract. Engng Mater. Struct. 1991;14:637-649.
[10] Miller KJ. ‘Material science perspective of metal fatigue resistance’. Mat. ScienceTech. 1993;9:453-462.