A pair of bubbles
’
rising dynamics in a xanthan gum
solution: a CFD study
Md. Tariqul Islam, P. Ganesan* and Ji Cheng
The motion and interaction of a bubble pair in a non-Newtonian fluid (xanthan gum solution) were numerically simulated using a volume offluid (VOF) method, in which the continuous surface tension model and the power-law model were adopted to represent the surface tension and rheological properties of non-Newtonian fluids, respectively. The effects of the initial horizontal bubble interval, oblique alignment and rheological properties of non-Newtonianfluids on a pair of bubbles rising side-by-side are evaluated in this study. The results indicate that for the case with a non-dimensional initial horizontal bubble interval h* ¼ 4.0, the interaction between the bubbles shows a minimal repulsive effect. Moreover, for the oblique angle alignment a greater repulsive force between the bubbles was seen when the angle was reduced. However, oblique coalescence occurred due to the higher attraction between the bubbles at higher angles, which is independent of theflow index. It is also found that the repulsion effect as well as the variation of the bubble shape from spherical to irregular are more significant at a lowerflow index (n< 0.5) due to the shear-thinning effect as well as the differences in theirflowfield structures.
1.
Introduction
A bubble column reactor is a device in which gas is usually dispersed as bubbles which rise through a liquid. The overall performance of a bubble column mainly depends on the bubble ow characteristics, bubble coalescence and bubble break up phenomenon which alters the bubble size distribution and enhances the gas–liquid contact area by the action of vortices viastretching, tearingetc., resulting in a signicant increase in heat and mass transfer and chemical reaction rate.1–3Nowadays, bubble column reactors are widely used as gas–liquid interface equipment in various industrial sectors such as chemical, petrochemical, pharmaceutical etc., in reactions such as oxidation, chlorination, alkylation, polymerization and hydro-genation, and are employed as bioreactors to produce valuable products like enzymes, proteins, antibiotics,etc.1,2Recently, a number of experimental and theoretical studies4–10have been carried out on the formation and rise characteristics of single bubbles in stagnantuids under the buoyancy force in New-tonian uids. The literature provides almost complete infor-mation regarding single bubble formation and rise characteristics. However, in industrial environments, swarm bubbles or multiple bubbles are more commonly encountered than the single bubble. Thus, the obtained information on the single bubble might not be broadened to multiple bubble systems. On the other hand, most of the materials encountered
in both nature and industry are non-Newtonian uids. Compared to Newtonianuids, non-Newtonianuids usually show many peculiar properties, for instance, shear-thinning, viscoelasticity, rod-climbing and tubeless siphoning.11–13 Hence, the bubble rising behavior and interactions in non-Newtonian uids are more complex and also the relevant research is quite rare. Therefore, the fundamental knowledge of bubble rising behavior and interactions in non-Newtonian uids could be improved to more scientically conrm the modeling of gas–liquidow in bubble columns.14,15
Most experimental studies have focused on single or in-line bubble rise dynamics in non-Newtonianuids.16–19For example, Hassagar16investigated the rise dynamics of two in-line bubbles in non-Newtonian uids. It was found that a negative wake encouraged by elasticity pushes the liquid away from the bubble. Linet al.17also found that for two in-line bubbles, the acceleration of the trailing bubble to the leading bubble is caused by negative pressure; and the shear-thinning effect in addition to the pushing force is caused by viscoelastic effects. Hassanet al.20investigated the zigzag trajectory of bubbles with maximum amplitude for smaller bubbles in low xanthan gum concentration solutions.
Few attempts have been made to investigate experimentally the interaction between bubble pairs rising side-by-side in non-Newtonian uids.21–24 Sanada et al.21 experimentally investi-gated the motion of a horizontally aligned pair of rising bubbles in silicone oil. They found that the velocities of the bubbles decrease aer coalescence by as much as 50% when the bubbles rising side-by-side bounce offeach other. The bubble repulsion Department of Mechanical Engineering, University of Malaya, 50603 Kuala Lumpur,
Malaysia. E-mail: [email protected]
Cite this:RSC Adv., 2015,5, 7819
Received 3rd December 2014 Accepted 16th December 2014 DOI: 10.1039/c4ra15728a
www.rsc.org/advances
PAPER
Published on 16 December 2014. Downloaded by University of Malaya on 10/03/2015 03:48:36.
the bubbles using particle image velocimetry (PIV), and found that within a certain distance between two bubbles, the inter-action between two neighboring bubbles changes from mutual repellence to attraction with decreasing the angle of the line which links the two bubbles’centers to the vertical direction. Legendreet al.22investigated the rising behavior of two parallel spherical bubbles in a viscous uid. They reported that the hydrodynamic interactions between the bubbles would be cohesive or repulsive, primarily depending on the Reynolds number.
Recently, more and more researchers25–35are making use of various numerical methods such as the volume ofuid method (VOF), level set method (LS), lattice Boltzmann method (LB), and front tracking method (FT) to investigate bubble dynamics or interactions. In general, their results are in reasonable agreement with the existing experimental data. Fan et al.25 successfully analyzed the dynamics of two bubbles rising side-by-side in concentrated carboxymethyl cellulose (CMC) solu-tion by using the VOF method. The results showed a good agreement with the experimental measurements. They found that the repulsive effect between two bubbles decreases with increasing the initial center-to-center distance of the bubbles and an increase of the oblique angle between them. Similarly, Yuet al.26investigated two parallel bubbles’rising behavior in a viscousuid using an adapted LB method. The authors found that the repulsive behavior of two spherical bubbles occurs at lower Reynolds numbers, but cohesive behavior and nally coalescence of the bubbles occur at higher Reynolds numbers. Li Zhanget al.28studied the motion of a single bubble rising freely through a CMC sodium salt, sodium hydroxyl-ethyl cellulose (HEC) and xanthan gum (XG) solution using a level set method for tracking the bubble interface. They investigated the shear rate and viscosity distribution and shape of a bubble rising in the CMC, HEC, XG solution and compared them to those in a sodium acrylate polymer (SAP) shear-thinning solu-tion. Liuet al.32performed a numerical investigation on three parallel bubbles at equal intervals rising in CMC non-Newtonianuids. The governing equations were solved using the VOF method. It was seen that the three parallel bubbles coalesced when the horizontal interval between them was less than 1 mm, otherwise the bubbles would experience a repulsive effect.
In summary, a detailed study of a pair of bubbles’ rising dynamics in a pure concentrate of xanthan gum solution (i.e., non-Newtonian) and their change in shape is not available to the best of the authors’ knowledge. There are a few works in
lated in detail using the VOF method to study the interactions between bubble pairs and theoweld structures and pressure distribution around the bubbles. The knowledge from the present study could be useful for a multi-scale approach to predict bubble swarm behavior as well as to improve the understanding of the mechanisms of multiple bubble rising dynamics.31
2.
Numerical methods
In this work, the continuous surface tension model and the rheological properties of non-Newtonian uids are incorpo-rated into the VOF method for a pair of bubbles rising in shear-thinninguids.
2.1 Physical model
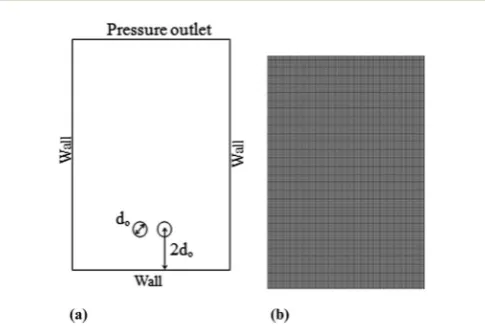
The physical model of the simulation was simplied to a 2D computational domain with dimensions of 120 mm height and 90 mm width, as shown in Fig. 1a. The bottom and two sides of the domain are assigned as no-slip wall boundary conditions. The top of the domain is assigned as a pressure outlet boundary condition. The operating pressure is set to be equal to ambient pressure,i.e.101 325 Pa, and a gravitational force (g) of9.81 m s2 is assigned along they-axis. At the initial stage of simulation, a pair of bubbles with diameters of 6 mm is imposed at the centre and 12 mm height from the bottom of the domain. The bubbles in quiescent non-Newtonian uids rise under the action of buoyancy and the bubbles’ rising dynamics are numerically
Fig. 1 (a) Physical model of the computational domain and (b) uniform structured grid.
[image:2.595.307.550.539.702.2]investigated. The effect of the column wall on the bubble is negligible since the bubble size is small in comparison to the column width. In the present study, a xanthan gum solution is used as the non-Newtonianuid. The non-Newtonianuid data are taken from Hassanet al.20The non-Newtonianuid has the following properties: density, rl¼ 997.0 kg m3 and surface tension,s¼0.063 N m1. Rheological data of the consistency coefficientK¼0.095 Pa snandow indexn¼0.548 were used to t the power-law model.
2.2 Governing equations
2.2.1 Equations of continuity and momentum.The conti-nuity and momentum equations for an incompressible uid can be written as:36
V$V~¼0 (1)
rðFÞ 0 @vV~
vt þVV~$V~ 1
A¼ VPþrðFÞ~gþV$2mðFÞD~þF~s (2)
whereris theuid density;~Vis the velocity vector of theuid;P is pressure; ~Fs is the body force; m is the dynamic viscosity coefficient. The strain rate tensor,~D is written as below:
~ D¼1
2
VV~þVV~T
(3)
The local averaged density r(F) and kinematic viscosity coefficientm(F) are evaluated from the local distribution of the phase volume functionF:
r(F)¼rl(F) +rg[1F] (4)
m(F)¼ml(F) +mg[1F] (5)
whererlandrg, are the density of the liquid and gas, andmland
mg are the viscosity of the liquid and gas, respectively. The volume fraction (F) is dened as the fraction of the liquid inside a control volume or cell, in whichFtakes the value of 0 for a pure gas cell; 1 for a pure liquid cell and between 0 and 1 for an interface of gas and liquid in the cell. The volume fraction equation is dened as follows:37
vF
vt þV$ ~
V F¼0 (6)
2.2.2 Source term of the momentum equation induced by surface tension. Surface tension has an important impact on the interface because the minor curvature of a bubble could generate major additional pressure. The continuum surface force (CSF) is used to calculate the gas–liquid interface motion, which is incorporated as a source term in the momentum equation (eqn (2)) by introducing a body force~Fsas described by Brackbillet al.38This body force is calculated by the following equation:
~ Fs¼s
rkVFl
0:5rlþrg (7)
where, Fl is the liquid phase fraction and k is the surface curvature of the interface, which is dened in terms of diver-gence of the normal vector,^n and is calculated by using the following equation:
k¼ ðV$nbÞ ¼1 ~n
" ~n ~n$V
!
~n V$~n #
; wheren^¼~n
~n (8)
2.2.3 Constitutive equation of continuous phase.In non-Newtonian uids, the shear-thinning effect is presented by the power-law model:39
m(F)¼Kg_n1 (9)
whereKandnare the consistency coefficient andow index of shear-thinning uids, respectively. The viscosity m can be obtained from the local shear rateg_ which can be written as below:
g: ¼
ffiffiffiffiffiffiffiffiffiffiffiffiffiffiffiffi 2D~:D~ r
(10)
Therefore, the viscosities of non-Newtonian uids can be obtained by the combination of eqn (3), (9) and (10).
2.3 Model validation
2.3.1 Grid analysis.A uniform structured mesh is used for the present study, as shown in Fig. 1b. Fig. 2 shows the effect of the mesh interval sizes (0.15, 0.25, 0.35 and 0.45 mm) on the simulation results of the single bubble rising velocities with an initial diameter of 6 mm in the xanthan gum solution. The density, surface tension, consistency coefficient andow index of the power-lawuid were 997.0 kg m3, 0.064 N m1, 0.095 Pa sn and 0.548, respectively.20It could be found that the single bubble rising velocities at a mesh interval size of 0.25 mm are almost the same as those at 0.15 mm. Therefore, a mesh interval size of 0.25 mm was adopted throughout this study to take into account both the computational accuracy and the time consumption. Similarly, satisfactory simulation results were obtained between the current study and the one carried out by Maet al.40on the inuence of different factors on single bubble
Fig. 2 Effect of mesh interval size on the rising velocity of a 6mm diameter bubble.
formation and bubble dynamics with a mesh interval size 0.25 mm.
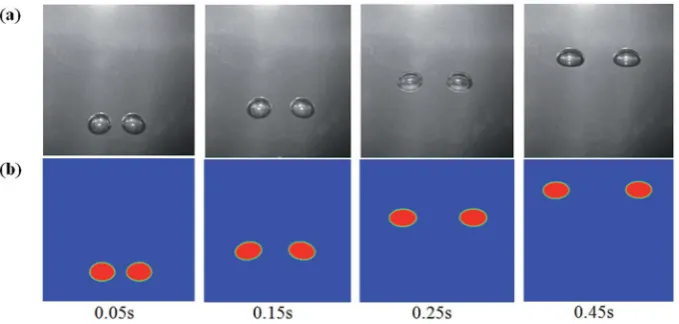
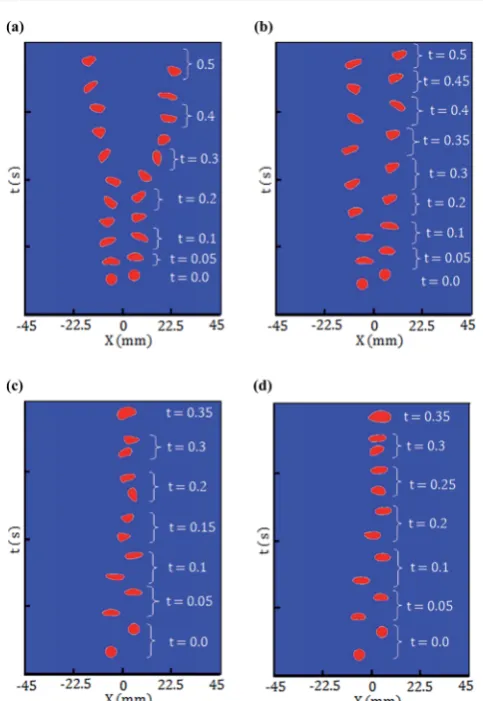
2.3.2 Code validation.In order to validate the reliability of the computational method, two types of study have been considered. First, the processes of two parallel bubbles rising in carboxymethyl cellulose sodium (CMC) solution were simulated and the results agreed well with the experimental results,32as depicted in Fig. 3a and b. The density, surface tension, rheo-logical parameters of the consistency coefficient andow index of the CMC aqueous solution are 1005.6 kg m3, 0.06875 N m1, 0.048 Pa sn and 0.922, respectively. For the second validation, single bubbles with initial diameters of 6 mm and 10 mm in the present of non-Newtonianuids (i.e., xanthan gum solution) were simulated and compared with the experimental results reported in ref. 20. The relative errors of the Reynolds numbers were about 2.43% and 1.22% for the initial diameters of 6 mm and 10 mm, respectively. The Reynolds number is calculated as:32,41,42
Re¼rldenUT2n
K (11)
wherede¼[(dhdw2)1/3]20andUTare the equivalent diameter and the bubble terminal velocity, respectively. The equivalent diameter (de) was calculated using the short bubble diameter (dh) and larger bubble diameter (dw) of the elliptic bubbles aer they reached steady conditions, or once there was no more variation of the instantaneous bubble velocity.
The relative error of the Reynolds number was found to be about 3.76% for the two parallel bubbles. Therefore, the above comparison results indicated that the VOF computational method can be reliable for predictions in the present investi-gation (Table 1).
2.4 Numerical procedures
In this study, the CFD code FLUENT was used to solve the governing equations employing a pressure based solver. The pressure–velocity coupling equation was solved using the pressure implicit with the splitting of operators (PISO) algo-rithm. The geometric reconstruction approach was adopted to track the interface between two phases using a piecewise linear interface calculation (PLIC) method.43 The discretization schemes of pressure and momentum were the pressure stag-gering option (PRESTO!) and second order upwind, respectively. The iteration and time steps were 1.0 106 and 0.0001 s, respectively. At the beginning, initial spherical bubbles were patched at the bottom of the computational domain containing only quiescent liquid.
2.5 Simulation cases
A total of 17 simulation cases were carried out. Therst two cases were carried out for validation purposes, in which bubbles with diameters of 4 mm (case 1) and 6 mm (case 2) were set to rise from a resting condition with the initial position of 12 mm vertical height from the bottom of the computational domain. Three cases (cases 3–5) were used to investigate the effect of non-dimensional horizontal intervals (i.e.,h*¼1.5, 2.0 and 4.0) between a pair of bubbles with do ¼ 6 mm. The non-dimensional horizontal interval is dened as h* ¼ Xi/do, where Xi is the initial distance between the centres of the Fig. 3 Comparisons of the height and shape of two parallel bubbles between (a) experimental shape of bubbles from Liuet al.32and (b) the
[image:4.595.129.469.50.212.2]present simulation.
Table 1 Comparison of equivalent diameter (de); bubble rising velocities (UT) and Reynolds numbers between experiments and the present simulation
de(mm) UT(m s1) dh/dw Re [—]
Error of Re (%)
Two parallel bubbles
Experimental32 4.1034 0.181 0.648 20.96 3.76
Simulation 4.213 0.172 0.636 20.17
Single bubble
Experimental20 6 0.231 [—] 77.75 2.43
Simulation 6.452 0.225 0.683 75.86
Experimental20 10 0.242 [—] 107.32 1.22
Simulation 10.824 0.237 0.562 108.63
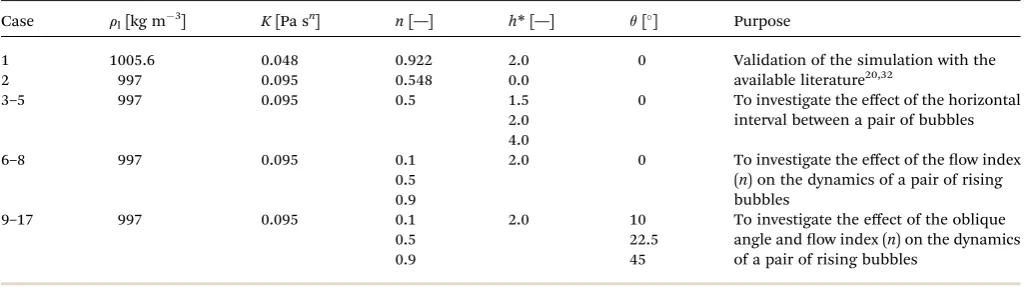
[image:4.595.43.295.599.723.2]bubbles anddo is the initial bubble diameter. Cases 6–8 were used to investigate the effect of theow index (n) of the non-Newtonian uid between the bubble pair on the rising dynamics. In cases 9–17, the effect of the oblique angle (q) and ow index (n) on theuidow were studied. A summary of all of the simulation cases is given in Table 2.
3.
Results and discussion
3.1 Effect of different initial horizontal intervals between a pair of bubbles
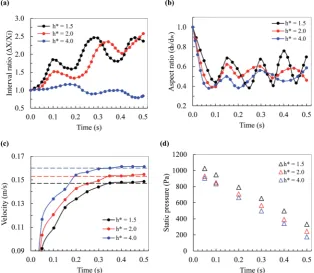
[image:5.595.42.558.62.206.2]A bubble pair’s rising dynamics in a horizontal direction are closely related to the initial horizontal bubble interval and the physical properties of non-Newtonianuids. The interaction of bubble pairs is investigated with three different non-dimensional initial horizontal intervalsh*¼1.5, 2.0 and 4.0. Fig. 4 shows the 6 mm bubble pair’s rising trajectories with three different initial bubble intervals. The results reveal that the path, shape and velocity experience a signicant variation with increasing distance between the centres of the two bubbles. The bubble shape changes from spherical to irregular for the three different initial bubble intervals. The bubble pair’s rising trajectory is asymmetric along the perpendicular line in the middle of the vertical column, as can be seen from Fig. 4. Forh*¼1.5 (see Fig. 4a) andh*¼2.0 (see Fig. 4b), a stronger repulsive interaction between the two parallel bubbles is observed compared to the interval of h* ¼ 4.0 (see Fig. 4c). Consequently, the results for bubble horizontal interval ratio, bubble aspect ratio (or the ratio of the minimum to maximum deformation of a bubble), bubble rising velocity and static pressure on the bubble as a function of time at three different initial bubble intervals are shown in Fig. 5a–d, respectively.
According to Fig. 5a, the highest variation in the bubbles’ rising trajectory in the horizontal direction occurs for the low initial bubble intervals ofh*¼1.5 and 2.0. This is due to the stronger effect of repulsion as a result of a large amount of vortices generated between the bubble intervals. While in the case ofh*¼4.0, the bubble rising trajectory in the horizontal directionuctuates less, indicating the weak repulsive effect. These results are in agreement with the experimental work of V´elez-Corderoet al.23Consequently, from Fig. 5b, forh*¼1.5, the curve of the bubble aspect ratiouctuated intensely, but less uctuation was observed in theh*¼2.0 curve. When the initial interval increased toh*¼4.0, the bubble shape did not vary so signicantly compared to the other non-dimensional intervals. The change of bubble aspect ratio occurs due to the stronger vortexeld lying in the gap between the bubble pair that keep interacting with each other and also the interacting force in the Table 2 Simulation cases
Case rl[kg m3] K[Pa sn] n[—] h*[—] q[] Purpose
1 1005.6 0.048 0.922 2.0 0 Validation of the simulation with the
available literature20,32
2 997 0.095 0.548 0.0
3–5 997 0.095 0.5 1.5 0 To investigate the effect of the horizontal
interval between a pair of bubbles 2.0
4.0
6–8 997 0.095 0.1 2.0 0 To investigate the effect of theow index
(n) on the dynamics of a pair of rising bubbles
0.5 0.9
9–17 997 0.095 0.1 2.0 10 To investigate the effect of the oblique
angle andow index (n) on the dynamics of a pair of rising bubbles
0.5 22.5
0.9 45
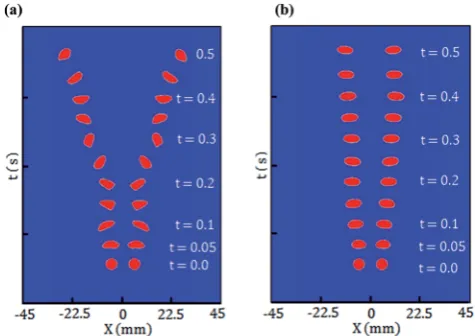
Fig. 4 Two parallel bubbles’rising trajectory at different initial intervals when theflow index,n¼0.5, (a)h*¼1.5; (b)h*¼2.0; (c)h*¼4.0.
[image:5.595.47.288.325.702.2]horizontal direction which varies with time. Meanwhile, it is also worth noting that the bubbles’rising velocity depends on the distance between the bubbles, as can be observed in Fig. 6a and b. As can be seen in Fig. 5c, the bubble pair with the initial intervalh*¼4.0 was observed to reach a terminal velocity of 0.16 m s1, which is higher than those withh*¼2.0 and 1.5. This means that the vertical motion of the bubbles with smaller initial intervals is weakened by their repulsive effect in the horizontal direction, and the terminal velocity of the bubble pair would increase with the increase of the initial bubble interval due to a weaker vortexeld between the bubble gap, as can be observed in Fig. 6c. So, it is reasonable to conclude that bubble–bubble interaction exhibits a repulsive effect, which decreases with the increase of distance between the bubbles and the repulsive effect can be considered negligible ath*$4. The effect of initial bubble interval on the bubble static pressure is calculated asP ¼ (H h)rg, whereH is the height of the bubble column andh is the height to which the bubble had risen. The results are shown in Fig. 5d. It is found that the static pressure on the bubble decreases with an increase ofh*and time. In comparing the value ofh*¼1.5 and 4.0, on average, the drop in static pressure is about 30%.
3.2 Effect ofow index on a pair of bubbles’rising dynamics Theow indexnreects the deviating degree of non-Newtonian uids from Newtonian uids (n ¼ 1). Most non-Newtonian uids are pseudo plastics with 0 <n< 1. Ifnis less than one, the power law (eqn (9)) predicts that the effective viscosity would
decrease with an increasing shear rate. The simulation was performed by setting differentow indexes; however the other properties such as air bubble density, density of the liquid, surface tension, column shape and the consistency of theuid, were kept constant. In this study, three differentow indexes (n¼0.1, 0.5 and 0.9) were taken into consideration to see the effect of theow index on the bubbles’rising dynamics in non-Newtonianuids. Fig. 7a and b display the rising trajectory of two bubbles with 6 mm diameter rising in a non-Newtonian uid at a low ow index (n ¼ 0.1) and highow index (n ¼ 0.9), respectively. As shown in Fig. 7a, when the bubbles with an initial diameter of 6 mm and aow index ofn¼0.1 rose in the column, the bubbles’shape changed from spherical to irregular and they began to deviate from each other in the horizontal direction. Whereas for the case ofn¼0.9, the bubbles’shape changed from spherical to ellipsoidal and the rising trajectory showed a nearly straight path (see Fig. 7b).
Fig. 8a and b illustrate the velocityelds around the bubbles at low ow index (n ¼ 0.1) and high ow index (n ¼ 0.9), respectively. Forn¼0.1, at timet¼0.05 s, it is observed that a stronger circulation of vortexes between the bubbles push at the bubbles’ edges. As a result, the bubbles’ shapes change to an oblate ellipsoidal disk (oed) shape att¼0.1 s. When the time is increased to 0.2 s, the oed shape again changes to an irregular shape, which is attributed to the stronger shear-thinning effect of non-Newtonianuids. Note that an excess vortex is seen at t¼0.2 s. This excess vortex may be the primary reason for the deviation of the bubbles from each other in the horizontal direction (see Fig. 7a at t ¼ 0.2–0.5 s). Whereas, weak Fig. 5 (a) Bubble interval ratio; (b) bubble aspect ratio; (c) bubble rising velocity and (d) static pressure as a function of time at different initial bubble intervals.
[image:6.595.141.456.51.324.2]circulations occur between the bubbles for the case with aow index ofn¼ 0.9, which are not able to push at the bubbles’ boundaries. Therefore, the shape of the bubbles does not change too much, as can be seen in Fig. 8b.
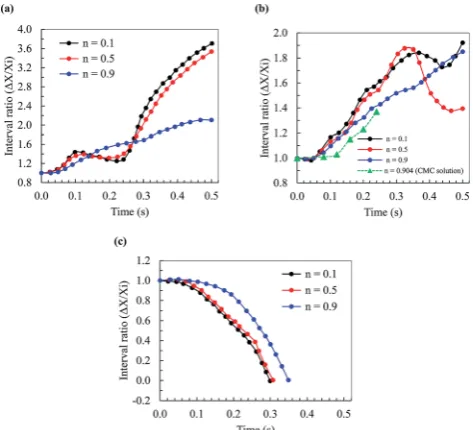
Fig. 9a–d show the bubble horizontal interval ratio, bubble aspect ratio, bubble rising velocity and static pressure on the bubbles, respectively at three differentow indexes ofn¼0.1, 0.5 and 0.9. In addition, the results of Fanet al.25for a pair of 6 mm diameter bubbles’rising behavior whenh*¼1.7, which are close to that in the present study, for a carboxymethyl cellulose (CMC) solution of n ¼ 0.904 are also included in Fig. 9a. Comparing the results obtained by Fanet al.25with the present study, on average the results are quite close to one another; some differences are observed and this may have resulted from the difference in the properties of the non-Newtonian uids
used, whereby Fan’s25study was based on a CMC solution and the present study is based on a xanthan gum solution. For example, in comparingn¼0.904 of Fanet al.25andn¼0.9 from the present study, the maximum difference is about 9%. However, the horizontal interval ratio between the bubbles remains unchanged untilt¼0.25 s forn¼0.1–0.9. Aer that, the values of the interval ratio of the non-Newtonianuid with n¼0.1 increases dramatically, indicating high repulsion effects between the bubbles. However, much lower values were
Fig. 6 Velocityflowfield around the rising bubble pairs att¼0.05 s andn¼0.5; when (a)h*¼1.5; (b)h*¼2.0; (c)h*¼4.0.
Fig. 7 Trajectory of the 6 mm diameter bubbles at (a) lowflow index, n¼0.1 and (b) highflow index,n¼0.9.
Fig. 8 Velocityfield around the bubbles at different times whenh*¼ 2, (a) lowflow index,n¼0.1; (b) highflow index,n¼0.9.
[image:7.595.308.546.49.217.2] [image:7.595.308.548.402.701.2]obtained for theuid withn¼0.5 and 0.9, along with a similar trend for them.
[image:8.595.49.287.46.257.2]Additionally, the effect of change in the ow index on the bubble aspect ratio (or bubble shape) is shown in Fig. 9b. It is observed that the curveuctuates severely withn¼0.1, but less uctuation was observed at highow indexn¼0.5. When the ow index increased to n ¼ 0.9, the variation in the bubble shape was not so remarkable, compared to the case ofn¼0.1. Changes of the bubble shape occurred due to the development of a stronger push ofuid jet around the bubbles in the gap between the bubbles (see Fig. 8a). Accordingly, Fig. 9c shows that the bubbles’rising velocity increases with a decrease inn. This is may be related to the shear-thinning effects in non-Newtonian uids, which reduced the viscosity of the uid around the gap between the bubbles, thus the rising resistance of the bubbles was faster in both the vertical and horizontal directions.
Fig. 9d shows the effect of theow index on the bubble static pressure with time. It has also been found that the static pres-sure decreases with an increase of ‘n’ and time. Comparing three differentn, on average, the results are relatively close to each other; but some differences are seen fromt¼0.2 s to 0.5 s and this may have resulted from the start of strong shear-thinning. For example, comparing n ¼ 0.1 and 0.9, the Fig. 9 (a) Bubble interval ratio and data for the CMC solution from Fan
et al.25is also included; (b) bubble aspect ratio; (c) bubble velocity and
(d) static pressure as a function of time at differentflow indexn, when h*¼2.0 anddo¼6 mm.
[image:8.595.350.507.50.179.2]Fig. 10 Normalized static pressure as a function of the bubble position at differentflow indexnand different initial bubble interval.
[image:8.595.307.549.335.686.2]Fig. 11 Schematic of the configuration of a bubble pair; noted: FB and UB mean following bubble and upper bubble, respectively.
Fig. 12 Bubble rising trajectory at different angles whenh*¼2, (a)b¼ 10,n¼0.1; (b)b¼22.5,n¼0.1; (c)b¼45,n¼0.1 and (d)b¼45, n¼0.9.
[image:8.595.41.289.557.701.2]maximum difference is about 16% on average fromt¼0.2–0.5 s. Subsequently, Fig. 10 shows the normalized static pressure as a function of the bubble position in the column. The static pressure and bubble position are normalized by atmospheric pressure and column height, respectively. The results show that the normalized static pressure decreases with the height of the bubble in the column and the maximum difference is found to
be less than 6% for the cases of differentow index (n) and different initial bubble interval (h*).
3.3 Effect of oblique angleqbetween bubble pairs at differentow indexes
[image:9.595.310.547.49.264.2] [image:9.595.67.267.49.574.2]In this section, bubble pairs with non-horizontal congurations are investigated. The simulation results reveal that in the rising process, the bubble path and bubble interval experience a huge variation at different oblique alignments. The oblique cong-uration between two bubbles is shown in Fig. 11. The contours of the bubbles’shape with the variation of time for three initial anglesq¼10, 22.5and 45andn¼0.1 and 0.9, are shown in Fig. 12a–d. By considering the identical horizontal distance of h*¼2.0, it is manifested that when the conguration angleq increases, the interaction between the two bubbles alters from repellence to attraction. This behavior can be observed with the comparison of Fig. 12a and b. Finally, the bubbles coalesce by increasingq to 45for bothow indexn¼0.1 and 0.9 of the non-Newtonianuid, as displayed in Fig. 12c and d, respec-tively. The velocityelds around the bubbles at the beginning stage for differentqand lowow indexn¼0.1 are displayed in Fig. 13a–c. From Fig. 13a, for a small angle (q¼10), when the bubbles begin moving, the lower surface of the bubbles is pushed up by vortexes. The upper portion of the following bubble encounters a negligible wake developed behind the lower surface of the upper bubble. As a result, the upper bubble has experienced a stronger pushed-away effect by the following bubble. Thus, both bubbles’ shapes deform signicantly and their rising paths deviate gradually from the original vertical line, resulting in enlargement of the bubble distance. The pushed-away effect gradually gets weaker (or the wake effect gradually gets stronger) behind the upper bubble with increasingqfrom 22.5(see in Fig. 13b) to 45(see in Fig. 13c). Fig. 13 Velocityflowfield around the rising 6 mm diameter bubbles at
n¼0.1 andt¼0.05 s, when the oblique angle (a)q¼10; (b)q¼22.5; (c)q¼45.
Fig. 14 6 mm diameter bubble interval ratio as a function of time at differentflow indexes,n; (a)q¼10; (b)q¼22.5; data for the CMC solution from Fanet al.25is also included forq¼17; (c)q¼45.
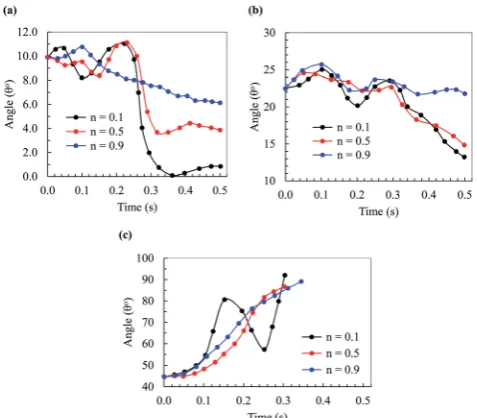
The bubble horizontal interval ratio and the change of the angle between the centre line of the bubbles and the horizontal direction at three different initial angles (q¼10, 22.5and 45) with three different ow indexes (n ¼ 0.1, 0.5 and 0.9) are illustrated in Fig. 14 and 15, respectively. According to Fig. 14a and b, at lowow indexes (i.e.,n¼0.1 andn¼0.5), theuid generates a stronger repulsive effect for the cases withq¼10 and 22.5, respectively. Consequently, higher values of the interval ratio are obtained compared to the highestow index (n ¼ 0.9). The stronger repulsive effect is generated in the horizontal direction due to the stronger shear-thinning effect. In addition, the results of Fanet al.25for an initial angle of 17 whenh*¼1.7, which is close to that in our simulation of 22.5, are also included in Fig. 14b. Comparing between Fanet al.25 and the present study, some differences are seen because of the differences in the non-Newtonianuid properties as discussed earlier. For example, in comparingn¼0.904, q¼17 of Fan et al.25andn¼0.9,q¼22.5from the present simulation, the maximum difference is about 13%.
When q ¼ 45 (see Fig. 14c), the decreasing trend of the curves represents the weaker repulsive effect for the three differentow indexes (n). Additionally, a value of the interval ratio (DX/Xi) of zero for the three different n represents the coalescence of the bubbles. Our results show noticeable differ-ences with the results of V´elez-Corderoet al.,23who found that the bubbles have an attractive and repulsive behavior atq¼42 forn¼ 0.5–0.8. Moreover, asq increased to 61 and 78, the bubbles coalesced forn¼0.5 and 0.7, but no coalescence can be found forn¼ 0.8. In contrast to these results, our study has showed bubble coalescence only atq$45forn¼0.1–0.9. This may be explained by the relatively low physical properties of the pure xanthan gum solutions that facilitate the attractive behaviour of bubble coalescence, while the higher physical properties of mixture solutions (i.e., xanthan gum and
uctuation (see in Fig. 15c). Moreover, as indicated above, a uctuating conguration angle is seen forn ¼ 0.1 due to its higher shear-thinning effect. It is worth mentioning that the end of each curve represents the bubble coalescence time at approximatelyt¼0.30 s forq¼45(see Fig. 15c). By comparing with the results for small angles, there always exists a repulsive effect between the bubbles in both directions as well as the variation of the angle for the lowow index of a 0.1–0.5 non-Newtonian uid; whereas for large angles, the attraction between bubbles is stronger than the repulsive effect. In the other words, the bubble repulsion effect can be controlled by using initial oblique angle variation.
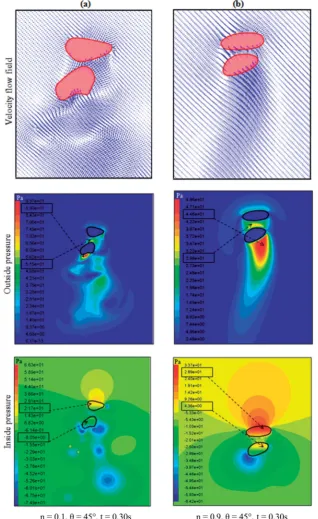
The velocity ow elds, outside and inside the pressure prole on the bubbles before the start of coalescence (t¼0.30 s) for lowow indexn¼0.1 and highow indexn¼0.9 are also displayed in Fig. 16a and b, respectively. For bothow indexes, the horizontal attraction between the bubble pair increases which results in the bubbles moving closer to each other and subsequently coalescing att¼0.30 s. It is noted that in case of n¼0.l (Fig. 16a), the upper surface of the trailing (or following) bubble moves more quickly due to the wake (or low pressure region) created by the upper bubble (refer to the outside pres-sure prole in Fig. 16a). While the lower surface of the trailing (or following) bubble is altered signicantly due to the stronger vortex of theuid (see the velocityoweld in Fig. 16a) forn¼ 0.1, which is due to the high pressure region (see the outside pressure prole in Fig. 16a) as compared to the velocityow eld for a higherow index ofn¼0.9 (see Fig. 16b). However, a noticeable difference in the values between the outside and inside bubble pressure can be found forn¼0.1,e.g.the upper and trailing bubble pressure differences are 29.8 Pa and 97 Pa, respectively. However, forn¼ 0.9, the upper bubble pressure difference is 1.5 Pa, which means less deformation of the bubble, while a pressure difference of 40.24 Pa represents relatively more deformation of the trailing bubble. This can be attributed to the reduction of viscosity in local regions produced by the shear-thinning effect of the wake behind the upper bubble as well as the higher pressure difference on the bubble, which results in more deformation of the bubble.
4.
Conclusion
[image:10.595.48.287.48.257.2]The dynamical characteristics of a pair of bubbles rising through non-Newtonianuids were simulated numerically by the VOF method. The conclusions of this study are drawn below:
Fig. 15 Variation of the angles as a function of time at differentflow indexes,n; (a)q¼10; (b)q¼22.5; (c)q¼45.
In a horizontal conguration, the interaction between bubble pairs in non-Newtonianuids shows a repulsive effect which increases with decreasing initial center-to-center distance of the bubbles due to the reduction of the shear-thinning properties of theuid. This leads to an intensica-tion of vortexes between the bubbles as well as a strong push-away effect between them.
For an oblique angle conguration of a pair of bubbles, it was found that there is a repulsive effect between the bubbles when q < 45, while an initial angle conguration ofq > 45 shows an attraction between the bubbles, resulting in collision in a wide range ofow indexes,n0.1–0.9.
[image:11.595.139.458.51.571.2]The ow eld around the rising bubbles experiences signicant changes with the variation of theow index which can bring about a noticeable difference in the rising velocities. Fig. 16 Velocityflowfield, outside and inside pressure profiles on the rising of 6 mm bubble before coalescence att¼0.30 s andq¼45, when (a) lowflow index,n¼0.1; (b) highflow index,n¼0.9.
K Consistency coefficient, Pa sn
n Flow index
^
n Normal vector
~n Unit normal vector
P Pressure, Pa
do Initial bubble diameter, mm
de Equivalent bubble diameter, mm
dh Bubble height as considered for the shorter bubble diameter, mm dw Bubble width as considered for the
larger bubble diameter, mm
H Column height, mm
h Bubble position in the column, mm
Re Reynolds number
DX Actual distance between bubbles, mm Xi Initial distance between bubbles, mm h* Non-dimensional horizontal interval,
[—]
t Time, s
~
V Velocity vector, m s1
UT Terminal velocity, m s1
Greek symbols
q Angle between the centre line of the bubbles in the horizontal direction, ()
_
g Shear rate, s1
s Shear stress, Pa
m Viscosity, Pa s
m(F) Kinematic viscosity coefficient, m2 s1
r Density, kg m3
s Surface tension, N m1
k Interfacial curvature between gas
and liquid
Subscript
g Gas phase
l Liquid phase
2 N. Yang, Z. Wu, J. Chen, Y. Wang and J. Li,Chem. Eng. Sci., 2011,66, 3212–3222.
3 M. Pourtousi, J. Sahu and P. Ganesan,Chem. Eng. Process., 2014,75, 38–47.
4 Z. Cai, Y. Bao and Z. Gao,Chin. J. Chem. Eng., 2010,18, 923– 930.
5 V. Badam, V. Buwa and F. Durst,Can. J. Chem. Eng., 2007,85, 257–267.
6 S. D. Bari and A. J. Robinson,Exp. Therm. Fluid Sci., 2013,44, 124–137.
7 P. Di Marco, N. Forgione and W. Grassi,Congresso Nazionale UIT sulla Trasmissione del Calore, 2005.
8 X. Zhang, H. Dong, D. Bao, Y. Huang, X. Zhang and S. Zhang, Ind. Eng. Chem. Res., 2013,53, 428–439.
9 H. Dong, X. Wang, L. Liu, X. Zhang and S. Zhang,Chem. Eng. Sci., 2010,65, 3240–3248.
10 L. Parkinson, R. Sedev, D. Fornasiero and J. Ralston, J. Colloid Interface Sci., 2008,322, 168–172.
11 W. Fan, S. Jiang, C. Zhu, Y. Ma and H. Li,Opt. Laser Technol., 2008,40, 389–393.
12 J. Herrera-Velarde, R. Zenit, D. Chehata and B. Mena,J. Non-Newtonian Fluid Mech., 2003,111, 199–209.
13 T. Miyahara and S. Yamanaka,J. Chem. Eng. Jpn., 1993,26, 297–302.
14 H. A. Jakobsen, H. Lindborg and C. A. Dorao,Ind. Eng. Chem. Res., 2005,44, 5107–5151.
15 X. Yuan and G. Yu,Chin. J. Chem. Eng., 2008,16, 497–502. 16 O. Hassager,Nature, 1979,279, 402–403.
17 T.-J. Lin and G.-M. Lin,Chem. Eng. J., 2009,155, 750–756. 18 R. C. Coke, R. Nagel and R. Etcheverry,Can. J. Chem. Eng.,
2008,81, 476–482.
19 H. Z. Li, X. Frank, D. Funfschilling and Y. Mouline,Chem. Eng. Sci., 2001,56, 6419–6425.
20 N. Hassan, M. M. K. Khan and M. Rasul,WSEAS Trans. Fluid Mech., 2008,3, 261.
21 T. Sanada, A. Sato, M. Shirota and M. Watanabe,Chem. Eng. Sci., 2009,64, 2659–2671.
22 D. Legendre, J. Magnaudet and G. Mougin,J. Fluid Mech., 2003,497, 133–166.
23 J. R. V´elez-Cordero, D. S´amano, P. Yue, J. J. Feng and R. Zenit,J. Non-Newtonian Fluid Mech., 2011,166, 118–132. 24 W. Fan, Y. Ma, X. Li and H. Li,Chin. J. Chem. Eng., 2009,17,
904–913.
25 W. Fan and X. Yin,Chin. J. Chem. Eng., 2013,21, 705–713. 26 Z. Yu, H. Yang and L.-S. Fan,Chem. Eng. Sci., 2011,66, 3441–
3451.
27 M. Cheng, J. Hua and J. Lou,Comput. Fluids, 2010,39, 260– 270.
28 L. Zhang, C. Yang and Z.-S. Mao, J. Non-Newtonian Fluid Mech., 2010,165, 555–567.
29 M. Ohta, E. Iwasaki, E. Obata and Y. Yoshida, J. Non-Newtonian Fluid Mech., 2003,116, 95–111.
30 Z. Yu and L. S. Fan,Can. J. Chem. Eng., 2008,86, 267–275. 31 J. Liu, C. Zhu, T. Fu and Y. Ma,Ind. Eng. Chem. Res., 2014,53,
4850–4860.
32 J. Liu, C. Zhu, T. Fu, Y. Ma and H. Li,Chem. Eng. Sci., 2013, 93, 55–66.
33 M. van Sint Annaland, W. Dijkhuizen, N. Deen and J. Kuipers,AIChE J., 2006,52, 99–110.
34 J. P. Singh and M. M. Denn,Phys. Fluids, 2008,20, 040901. 35 J. Tsamopoulos, Y. Dimakopoulos, N. Chatzidai,
G. Karapetsas and M. Pavlidis, J. Fluid Mech., 2008, 601, 123–164.
36 G. K. Batchelor,An introduction touid dynamics, Cambridge University Press, 2000.
37 C. W. Hirt and B. D. Nichols,J. Comput. Phys., 1981,39, 201– 225.
38 J. Brackbill, D. B. Kothe and C. Zemach, J. Comput. Phys., 1992,100, 335–354.
39 E. C. Bingham, Fluidity and Plasticity, McGraw-Hill, New York, 1922, p. 440.
40 D. Ma, M. Liu, Y. Zu and C. Tang,Chem. Eng. Sci., 2012,72, 61–77.
41 K. Dewsbury, D. Karamanev and A. Margaritis,Chem. Eng. Sci., 1999,54, 4825–4830.
42 A. Margaritis, D. W. te Bokkel and D. G. Karamanev, Biotechnol. Bioeng., 1999,64, 257–266.
43 D. Youngs,Numerical methods foruid dynamics, 1982, vol. 24, pp. 273–285.