International Journal for Research in Applied Science & Engineering Technology (IJRASET
)
ISSN: 2321-9653; IC Value: 45.98; SJ Impact Factor:6.887Volume 5 Issue XI November 2017- Available at www.ijraset.com
Evaluation of an Effluent Treatment Plant – A
Case Study
Gauri D. Pardhi1, M. Joshi2, S. Sapkal3, Rubina K. Sheikh4, Nain M. Sayyed5, Vaishnavi Tambekar6, V.P. Thergaonkar7
1
Senior Chemist, ETCPL, 2Sr. Manager, Safety & Sustainability (M&M, Nagpur) 3
Dy. Manager, Safety & Sustainability (M&M, Nagpur), 4Chemist ETCPL, 5Chemist ETCPL 6
Chemist ETCPL, 7Retd. Scientist NEERI, Nagpur & Technical Head
Abstract: Regular monthly monitoring of effluent quality from a treatment plant at Mahindra & Mahindra tractor assembly plant in MIDC area, Hingna, Nagpur from 2009 to date indicated over 90 per cent removal of relevant effluent quality parameters for an automobile assembly plant viz. BOD,COD, oil & grease, suspended solids etc. ETP has been designed to treat
waste water @ 300m3/day by activated sludge extended aeration system presently treating about 170 to 190 m3/day. MLSS are
being maintained at 3000 ± 500 mg/L and MLVSS are 1400±200 mg/L. F/M ratio is 0.21 for present flow. Variation in influent quality in terms of COD, BOD, O & G and suspended solid values was respectively 650 to 1875, 118 to 356, 69 to 180 & 124 to 375 mg/L. Treated effluent COD and suspended solids were less than 30 mg/L and O & G was absent. Average ionic load in treated effluent is 11.1 m eq/L and organic load being negligible was could to tertiary treatment by R.O process and permeate is
being used in manufacturing process thereby saving @ 170 to 190 m3/day.
I. INTRODUCTION
A tractor assembly plant of M/s Mahindra & Mahindra is located within MIDC industrial area near Nagpur. This unit was commissioned about 47 years ago. MIDC provides water supply to all units in the area. There is no sewerage system for this industrial area. All units in the area had to install their effluent treatment plants in their respective premises as per State Pollution Control Board consent to operate industrial unit. Plant receives most parts including subassemblies from supplier units and assembles them in to “brand tractor”. Major operations are a) transmission machining assembling & testing, b) engine machining, c) hydraulics machining, d) tractor sub assembly, chassis painting, final assembly, e) testing and f) sheet metal painting. These operations need welding, phosphatizing along with cleaning, rinsing, phosphatizing etc. During painting a primer coat of paint is electrostatically deposited on metal surfaces. Electrically charged metal is dipped in to tank of water –based paint. Paint particles which are oppositely charged deposit evenly to the surface. Demineralized (DM) water is used for make-up. Paint tank gets heated and is cooled to less than 30°C in an open re-circulating cooling tower. Then the tractor is dried/baked in a dryer to ensure finish. There are heat exchangers for heat- recovery. Concentrated rinse water from ‘electrostatic coating unit’ is released in to effluent treatment plant. Other miscellaneous uses of water are a) assembled tractor is passed through a spray using fluorescent dye and b) a final tractor wash.M & M is “environment conscious” and has voluntarily conducted i) water audit, ii) feasibility of rain water harvesting, iii) tertiary treatment of sewage treatment plant effluent etc. ETP has been designed to treat wastewater @ 300 m3 /day. Water audit enabled optimization of water use. It included performance evaluation of its effluent treatment plant (ETP) and the sewage treatment plant. Water audit and ETP evaluation was entrusted to Enviro Techno Consult (ETC), now ETCPL has been recognized as In-house R&D Unit by Department of Scientific and Industrial Research (DSIR), Department of Science and Technology (DST), Govt. of India, New Delhi. Findings of these surveys and the initiative by the plant authorities led to tertiary treatment of ETP and STP effluents, then recycle and reuse treated wastewater in manufacturing processes. Thus fresh water consumption was reduced.
Improved water management practice at the plant has reduced wastewater generation to about 190 -200 m3 /day.
II. PURPOSE OF PAPER
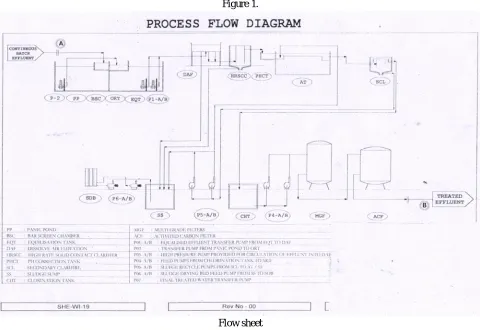
Figure 1.
Flow sheet
Screen O&G tank- Equalization Diffused air floatation
Secondary clarifier Aeration tank Primary clarifier
Recycle sludge
Excess sludge to drying beds
Effluent to reuse
[image:3.612.66.546.79.409.2]International Journal for Research in Applied Science & Engineering Technology (IJRASET
)
ISSN: 2321-9653; IC Value: 45.98; SJ Impact Factor:6.887Volume 5 Issue XI November 2017- Available at www.ijraset.com
per Standard Methods for Examination of Water & Wastewater AWWA, APHAi, Her Majesty’s publication entitled Water and Waste Water Manual and NEERI publication “Water analysis & wastewater treatment iii .
III. RESULTS
[image:4.612.49.566.169.503.2]Yearly averages of pollutants in wastewater since 2009 till October 2017 were calculated and standard deviations for these except pH were calculated. Year wise untreated wastewater quality entering the ETP since 2009 is given in Table 1.
Table 1: ETP inlet quality
Parameter 2009 2010 2011 2012 2013 2014 2015 2016 2017
pH 6.5-5.4 7.0-8.8 7.0-8.6 6.6-8.1 6.2-7.4 6.8-7.5 6.6-7.9 6.9-9.3 6.2-9.0
TS 2690 2645 2415 2231 1494 1581 2581 2013 1870
TDS 2348
±329 2270 ±394 2094 ±1256 2012 ±522 1293 ±511 1357 ±276 2386 ±400 1888 ±503 1746 ±287
TSS 342
±60
375 ±127 321
±219 219 ±68 201 ±16 224 ±49 195 ±60 125 ±41 124 ±29
COD 650
± 268 974 ± 426 1704 ±1756 1535 ±618 1139 ±372 536 ±228 1308 ± 625 1238 ± 493 1875 ±625
BOD 118
± 57 255 ± 195 343 ± 355 337 ± 103 271 ± 99 114 ± 43 356 ±201 275 ± 97 349 ± 44
O&G 140
±18
160 ±20 70 ± 66 157 ±72 142 ±27 69
±32 128 ±44 150 ±24 148 ±27
Chloride 140
±94 160 ±537 70 ±340 157 ±88 142 ±65 69 ±42 128 ±45 150 ±157 148 ±52
Sulphate 54
±33 50 ±13 31 ±28 42 ±26 28 ±14 32 ±13 35 ±25 34 ±36 31 ±20
Phosphate 7±2 21±23 9±12 10±3 7±3 2±2 7±5 1±1 1±1
BOD/COD 1:6 1:4 1: 5 1:5 1:4 1:5 1:4 1:5 1:5
N.B. All Values except pH are in mg/L and rounded to nearest decimal
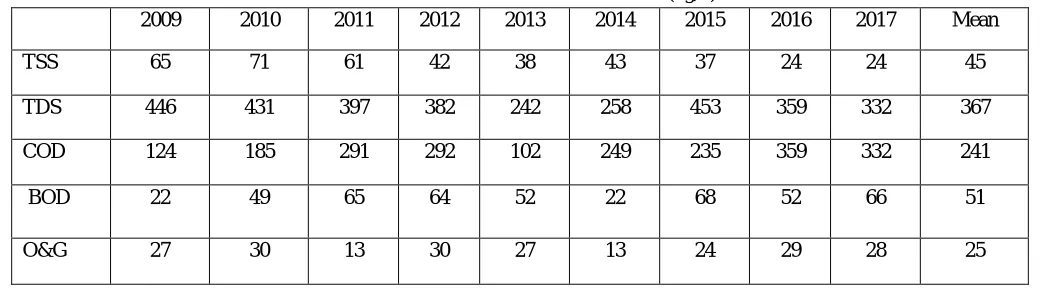
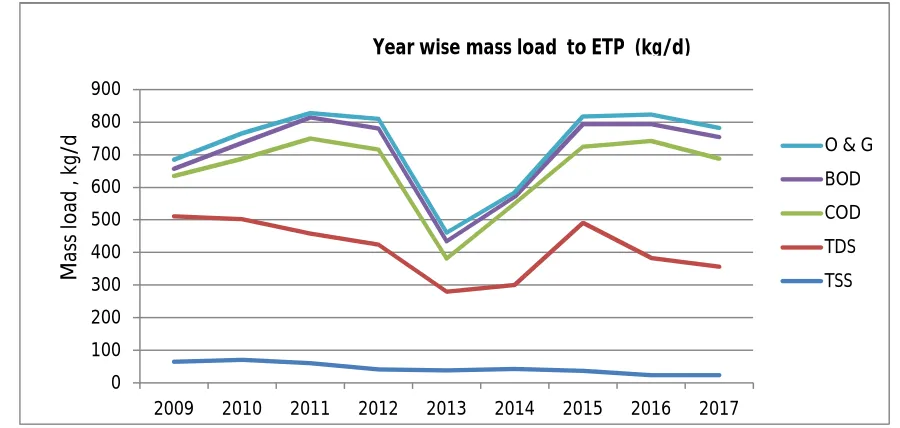
Mass load entering the ETP was calculated. Pollution-mass load of TSS, TDS, BOD/COD and O&G is given in Table 2 and plotted in Figure2. Variations in pollution load can be due to variation in production pattern.
Table 2: Year wise inlet mass load to ETP (kg/d)
2009 2010 2011 2012 2013 2014 2015 2016 2017 Mean
TSS 65 71 61 42 38 43 37 24 24 45
TDS 446 431 397 382 242 258 453 359 332 367
COD 124 185 291 292 102 249 235 359 332 241
BOD 22 49 65 64 52 22 68 52 66 51
[image:4.612.46.566.569.714.2]Figure 2
[image:5.612.78.528.89.303.2]Yearly averages of treated effluent quality are given in Table 3.
Table 3: Treated effluent quality
Parameter 2009 2010 2011 2012 2013 2014 2015 2016 2017
pH 7.1-8.1 6.4-8.4 7.0-7.8 7.2-7.6 6.8-7.5 6.3-7.4 7.0-8.0 6.1-7.9 7.2-8.2
TS 985 1124 1126 1351 992 787 140 825 817
TDS 967
±77 1105 ±371 1105 ±350 1334 ±361 973 ±296 768 ±247 1216 ±294 808 ±106 798 ±152
TSS <20
±2 <20 ±3 <20 ±2 <20 ±1 <20 ±2 <20 ±7 <20 ±6 <20 ±6 <20 ±4
COD 11
±7 17 ±10 31 ±41 19 ±8 17 ±8 41 ±59 60 ±40 60 ±31 74 ±67
O & G <5 <5 <5 <5 <5 <5 <5 <5 <5
Chloride 323
±95 396 ±99 290 ±145 348 ±95 266 ±120 197 ±62 214 ±79 156 ±72 278 ±132
Sulphate 52
± 12 54 ±15 26 ±27 31 ±37 25 ±8 34 ±14.1 52 ±33 34 ±28 20 ±7
Phosphate 2.7
±1.2 2.8 ±1.3 1.4 ±1.6 3.1 ±1.2 1.7 ±0.9 0.5 ±0.3 1.9 ±1.2 0.05 ±0.1 0.04 ±0.1 N.B. All Values except pH are in mg/L and rounded to nearest decimal, BOD was always less than 20 mg/L ; O &G was nil .
III. DISCUSSION
Efficiency of ETP is judged from reduction in concentrations of criteria pollutants (BOD/ /S.S./T.D.S/ O&G) for the industry. Permissible limits prescribed by pollution control board for both BOD & S.S. each is less than 100 mg/L, TDS less than 2100 mg/L and O&G less than 10 mg/L,COD 250mg/L, phosphate less than 5mg/L and permitted quantity of effluent @ 300 m3/d.ETP performance depends on several design parameters e.g. i) hydraulic retention time, ii) mean cell residence time, iii) F/M ratio, iv)organic loading etc. These values were calculated for the existing ETP configuration and average flow to ETP @ 190 m3/d. Hydraulic retention in bar screen tank ,O & G trap ,scrubber tank, equalization tank, diffused air floatation tank aeration tank and secondary settling tank were respectively 10minutes,50 minutes,19 hours,21hours( 0.9 days) and five hours. F/M ratio was 0.21 for
0 100 200 300 400 500 600 700 800 900
2009 2010 2011 2012 2013 2014 2015 2016 2017
O & G
BOD COD TDS TSS M ass lo ad , kg /d
[image:5.612.45.566.347.579.2]International Journal for Research in Applied Science & Engineering Technology (IJRASET
)
ISSN: 2321-9653; IC Value: 45.98; SJ Impact Factor:6.887Volume 5 Issue XI November 2017- Available at www.ijraset.com
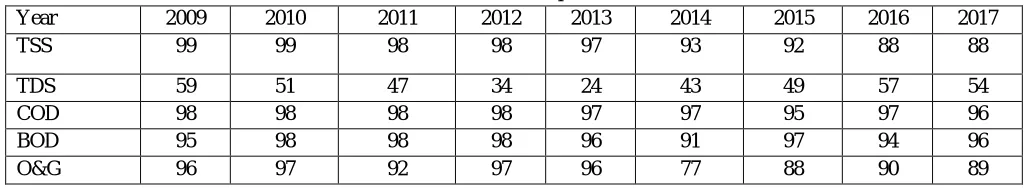
[image:6.612.49.561.124.218.2]extended aeration system but is being operated as complete mix activated sludge process. Percent removal of pollutants since 2009 till date is included in Table 4.
Table 4: Percent removal of pollutants in ETP
Year 2009 2010 2011 2012 2013 2014 2015 2016 2017
TSS 99 99 98 98 97 93 92 88 88
TDS 59 51 47 34 24 43 49 57 54
COD 98 98 98 98 97 97 95 97 96
BOD 95 98 98 98 96 91 97 94 96
O&G 96 97 92 97 96 77 88 90 89
A. Feasibility of recycle & reuse:
Plant management has been proactive towards environment management practices. Plant performance in terms of BOD/COD/O&G was above 90-95percent and that treated effluent quality has been consistently satisfactory. Industry therefore decided to verify feasibility of recycle and reuse of treated effluent in manufacturing processes. It would save would fresh water @about 150 m3/d and also the revenue on water bills. Process-water- quality requirement in this plant is of demineralized and softened water. It was decided that effluent from existing secondary treatment in ETP be treated in a tertiary treatment plant. Tertiary treatment would aim at removal of residual organics and inorganics in dissolved and suspended state. Reverse osmosis system was finalized. Composited (flow weighted) ETP effluent samples were collected for 11 days and analyzed. Results are given in Table 5.
Table 5: Ionic composition of ETP effluent
Day 1 2 3 4 5 6 7 8 9 10 11 Mean
pH 7.3 6.7 6.5 7.2 7.1 6.8 6.1 7.5 7.3 7.4 7.5 6.5-7.5
Turbidity 9 15 18 10 8 4 12 19 20 17 5 12
TDS 369 1786 1176 1428 1285 986 800 750 729 458 456 927
Bicarbonat e, HCO3
-39 120 129 154 142 156 142 112 110 118 101 120
Ca2+ 9 18 22 26 20 22 21 18 22 20 21 20
Mg2+ 78 22 12 31 32 31 32 28 28 30 29 32
Chloride, (Cl-)
95 98 201 250 140 115 120 115 360 224 125 167
Sulphate, SO4-2
123 26 26 24 25 27 34 24 56 37 42 40
T. Silica, SiO2
4 11 11 2 2 2 1 7 8 5 4 5
Phosphate, 2 <1 1 1 1 1 1 4 3 1.7 3 2
Fe,Cr,Mn, Pb,
Traces Traces Traces Traces Traces Traces Traces Traces Traces Traces Traces -
COD 80 57 55 49 47 68 65 62 60 75 72 63
NB: All values in mg/L unless otherwise stated ; COD due to coolant traces
Permeate to reuse Pressure Activated carbon
Sand filter filter
Rejects to gardening after dilution
RO plant has been commissioned and permeate is being used in process thereby saving fresh water @ about 170 m3/d. Permeate water quality is given in Table 6.
Table 6: Permeate Characteristics of R. O. Plant
Parameter Permeate
Day 1 2 3 4 5 6 7 8 9 10 11
pH 6.8 5.4 5.3 6.2 7.3 6.1 6.1 6.2 6.4 6.2 6.1
Appearance/co lor
Clear/N il
Clear/N il
Clear/N il
Clear/N il
Clear/N il
Clear/N il
Clear/N il
Clear/N il
Clear/N il
Clear/N il
Clear/N il Conductivity
(µS/cm)
Nil 5 5 5 4 5 5 5 4 5 Nil
Turbidity Nil Nil Nil Nil Nil Nil Nil Nil Nil Nil Nil
TDS < 1 < 1 < 1 < 1 < 1 < 1 < 1 < 1 < 1 < 1 < 1
Bicarbonate, HCO3
-Nil 17 17 20 17 17 20 10 15 11 10
Ca2+ 0 0 0 0 0 0 0 0 0 0 0
Mg2+ 0 0 0 0 0 0 0 0 0 0 0
Chloride, (Cl-) 0 0 0 0 0 0 0 0 0 0 0
Sulphate, SO4 -2
0 0 0 0 0 0 0 0 0 0 0
T. Silica, SiO2 0 0 0 0 0 0 0 0 0 0 0
Phosphate, PO4 -3
0 1 1 1 1 1 1 < 1 < 1 < 1 < 1
Fe, Cr, Mn, Pb 0 0 0 0 0 0 0 0 0 0 0
COD <7 <7 <7 <7 <7 <7 <7 0 0 0 0
IV. CONCLUSIONS
Regular scientific monitoring for protracted period of a secondary waste water treatment plant at the industry has enabled the industry to conserve fresh water by recycle and reuse of treated effluent by a properly designed tertiary wastewater treatment plant. Effluent treatment plant design parameters like organic/hydraulic loading, BOD removal efficiency etc. were studied. Ionic load in treated ETP effluent was used for tertiary treatment plant selection and design.
REFERENCES [1] AWWA standard method for analysis & examination of water and wastewater. [2] Water & Wastewater manual, Her majesty stationary office, U.K(1972). [3] Wastewater & Water treatment, NEERI