Cite this:Lab Chip, 2013,13, 3199
Push pull microfluidics on a multi-level 3D CD
Received 2nd January 2013, Accepted 7th May 2013
DOI: 10.1039/c3lc00004d
www.rsc.org/loc
Tzer Hwai Gilbert Thio,aFatimah Ibrahim,*aWisam Al-Faqheri,aJacob Moebius,ad Noor Sakinah Khalid,aNorhayati Soin,abMaria Kahar Bador Abdul Kaharac and Marc Madouadef
A technique known as thermo-pneumatic (TP) pumping is used to pump fluids on a microfluidic compact disc (CD) back towards the CD center against the centrifugal force that pushes liquids from the center to the perimeter of the disc. Trapped air expands in a TP air chamber during heating, and this creates positive pressure on liquids located in chambers connected to that chamber. While the TP air chamber and connecting channels are easy to fabricate in a one-level CD manufacturing technique, this approach provides only one way pumping between two chambers, is real-estate hungry and leads to unnecessary heating of liquids in close proximity to the TP chamber. In this paper, we present a novel TP push and pull pumping method which allows for pumping of liquid in any direction between two connected liquid chambers. To ensure that implementation of TP push and pull pumping also addresses the issue of space and heating challenges, a multi-level 3D CD design is developed, and localized forced convection heating, rather than infra-red (IR) is applied. On a multi-level 3D CD, the TP features are placed on a top level separate from the rest of the microfluidic processes that are implemented on a lower separate level. This approach allows for heat shielding of the microfluidic process level, and efficient usage of space on the CD for centrifugal handling of liquids. The use of localized forced convection heating, rather than infra-red (IR) or laser heating in earlier implementations allows not only for TP pumping of liquids while the CD is spinning but also makes heat insulation for TP pumping and other fluidic functions easier. To aid in future implementations of TP push and pull pumping on a multi-level 3D CD, study on CD surface heating is also presented. In this contribution, we also demonstrate an advanced application of pull pumping through the implementation of valve-less switch pumping.
1. Introduction
The centrifugal microfluidic CD platform has become a fast growing research field. The CD platform allows for miniatur-ization, multiplexing, full automation of complex diagnostic processes, is low cost, and is portable for use as a point-of-care diagnostic tool.1–3The platform consists of a plastic disc that has enclosed micro-features such as chambers and channels, designed in various layouts to control the flow sequencing of small volumes of fluids during different types of processes.
The main benefit of the microfluidic CD platform is that fluids are pumped by the centrifugal force generated by the spinning of the CD. There is no need for syringes or other physical connectors to pump the fluid, allowing for better portability, accessibility, and disposability. The flexibility in the design of the micro-features allows for a wide range of processes such as valving, mixing, metering, volume splitting, separation, siphoning, flow controletc.1–3This allows for wide application of the platform in the field of biomedical engineering such as the detection of antigen and antibody,4–7cell lysis and plasma separation3,8and polymerase chain reaction (PCR).9,10
However, a crucial disadvantage of the platform is that centrifugal pumping only propels fluids toward the edge of the CD, due to centrifugal forces only acting in the outward, radial direction. As a result, all fluidic processes must occur within the limited space defined by the radius of the disc, which restricts the number of steps a process can integrate before fluids reach the edge of the CD.
To overcome this disadvantage, Abi-Samra et al.11 have presented a thermo-pneumatic (TP) pumping method to pump liquids back towards the CD center. The thermo-pneumatic (TP) pumping method was originally developed in the field of aMedical Informatics & Biological Micro-electro-mechanical Systems (MIMEMS)
Specialized Laboratory, Department of Biomedical Engineering, Faculty of Engineering, University of Malaya, 50603 Kuala Lumpur, Malaysia. E-mail: [email protected]; Fax: 603 7967 4579; Tel: 603 7967 6818
bDepartment of Electrical Engineering, Faculty of Engineering, University of Malaya,
50603 Kuala Lumpur, Malaysia
cDepartment of Medical Microbiology, Faculty of Medicine, University of Malaya,
50603 Kuala Lumpur, Malaysia
dDepartment of Biomedical Engineering, University of California, Irvine, 92697,
United States
eDepartment of Mechanical and Aerospace Engineering, University of California,
Irvine, 92697, United States
f
Ulsan National Institute of Science and Technology (UNIST), World Class University (WCU), Ulsan, South Korea
PAPER
Published on 09 May 2013. Downloaded by University of Malaya on 04/02/2014 06:40:44.
View Article Online
traditional, stationary, non-CD microfluidic platforms.12,13 The presented TP pumping method incorporates a TP air chamber connected to a liquid chamber via a channel. Thermal expansion of air in the TP chamber exerts pressure through the channel onto the liquid in the connected chamber. The expanded air generates enough pressure to push the liquid against the centrifugal force and toward the CD center. The advantages of TP pumping are: (i) it does not involve any moving parts, and (ii) there is no contamination of fluid by external factors since the TP air chamber is sealed from the atmosphere.11
However, Abi-Samra et al.’s11 implementation of TP pumping is limited in the following aspects: (i) the pumping mechanism is only one way, pumping liquid out of the chamber to which the TP air chamber is connected to, and (ii) it is only useful as an initial storage of liquid near the edge of the disc, to be transferred toward the CD center when required.
To address the limitations above, we present a TP pump design which (i) provides a ‘‘push’’ and ‘‘pull’’ pumping mechanism for transferring of liquid in any direction between two connected liquid chambers, and (ii) allows the adoption of TP pumping as an intermediate step within a more involved centrifugal microfluidic assay (not just as an initial storage of liquid).
1.1 Push pull microfluidics
In centrifuge based microfluidic pumping, liquid displace-ment occurs when liquid bursts from one chamber to another chamber following the direction of the radially outward centrifugal force. An essential aspect in chamber design is that the chamber in which liquid bursts into must contain venting holes. This is necessary to prevent trapped air in the chamber stopping liquid from bursting into the said chamber.
As illustrated in Fig. 1(a), in Abi-Samraet al.’s11 implemen-tation of TP pumping, the TP air chamber is connected to a ventless chamber A. The lack of venting holes makes it impossible to implement this design as an intermediate step within a centrifugal microfluidic process (where liquid bursts into chamber A). Moreover, since the connecting channel from chamber A opens into the top of chamber B, it prevents liquids from flowing back to chamber A.
Simply by implementing venting holes in the appropriate chamber, structuring a ‘‘U’’ bend in the connecting channel, and repositioning channel openings at the bottom of the two chambers both pull and push, i.e., bi-directional pumping is enabled (see Fig. 1(b)). This expands the CD platform’s capability dramatically.
As illustrated in Fig. 1(b) (left panel), push pumping relies on air expansion in the TP air chamber during the heating process. Regardless of the centrifugal force acting on the liquid in chamber B, the liquid remains immobile due to the ‘‘U’’ bend placed in the channel leading from the bottom of chamber B. Air expansion during heating then pressurizes the liquid in chamber B, pushing it out into the channel along the ‘‘U’’ bend towards chamber A. The venting holes in chamber A serve as depressurizing contraptions to allow venting of air during liquid transfer, and any excess expanded air during prolonged heating escapes through the holes. On the other hand, pull pumping (or suction pumping) is enabled by air compression taking place when heated air in the TP air chamber is cooled down (see Fig. 1(b) (right panel)). The air compression creates a low pressure state in chamber B (which is attached to the TP air chamber). This allows liquid to be pulled into chamber B from the adjoining chamber A.
One additional important aspect vital in the configuration for push pull pumping is the opening of the channel into the chambers. For liquid to be able to flow out of a chamber, the opening must be at the bottom of the chamber. For liquid to
Fig. 1(a) TP pumping by Abi-Samraet al.11Ventless chamber A prevents incorporation of TP pumping in centrifugal driven microfluidic processes. (b) Push and Pull pumping principles. Design of ‘‘U’’ bend, location of channel opening at bottom of chambers, and vented chamber A allows incorporation of TP pumping as part of centrifugal driven microfluidic processes.
[image:2.595.57.543.470.685.2]flow into a chamber, and not flow out after that, the opening should be at the top of the chamber. For bi-directional push pull pumping to occur, the channel must open into the bottoms of both the two connected chambers.
Both push and pull pumping can be activated concurrently, or separately. To enable push pumping, one simply needs to structure the TP and microfluidic features as illustrated in Fig. 1(b) (left panel), and apply heat to the TP air chamber. To achieve pull pumping, one simply configures the TP and microfluidic features as described in Fig. 1(b) (right panel), and preheating of the TP air chamber then primes it for pull pumping during cooling. If sequential push and pull pumping is required between two attached chambers, simple cycling of the heating and cooling steps would activate push during heating, and pull during cooling.
1.2 Multi-level 3D CD and forced convection heating
In Abi-Samraet al.’s work,11the TP features (consisting of the TP chamber and the connecting channel) are fabricated on a single-level together with the microfluidic process, and heat is delivered by localized heating equipment. However, this single-level approach gives rise to space and heating issues. By introducing TP pumping into the process, the TP features consume space that could be used for larger, more complex assay designs. As fluids on the microfluidic CD are on the same level as the TP features, they are exposed to heat intended for the TP air chamber, and unnecessary heating may occur especially if the fluids are on the same radial position as the TP air chamber. Furthermore, implementing multiple push and pull pumping on a CD might greatly increase the complexity of channel and chamber layouts.
To address the above issues, we implemented a multi-level 3D CD design. In this approach, the TP features are in a separate layer above the microfluidic processes. The two layers are then bonded together, with connection holes allowing air exchange between the TP features and the microfluidic processes.
In this paper, the multi-level 3D CD design we introduce is optimized for implementing TP pumping and in this regard we will discuss the advantages of forced convection heating over the conventional infra-red (IR) light focusing techniques in detail in the ‘‘Experimental setup’’ section. But in short the argument is as follows: by heating only the top surface of the CD with forced convection heating, only the TP features placed right under the surface are heated, and not the microfluidic process features placed on a lower level.
2. Materials and methods
2.1 Microfluidic CD fabrication
Microfluidic CDs were designed using computer aided design software, and fabricated by bonding layers of polymethyl methacrylate (PMMA) using a custom made Pressure Sensitive Adhesives (PSA) material (by FLEXcon, USA). The microfluidic process and TP features were engraved in the PMMA layers using a Computer Numerical Control (CNC) machine (model VISION 2525, by Vision Engraving and Routing Systems, USA),
while connection holes and micro features in the PSA layers were cut using a cutting plotter machine (model: GCC P2-60/ PUMA II, by GCC, Taiwan)
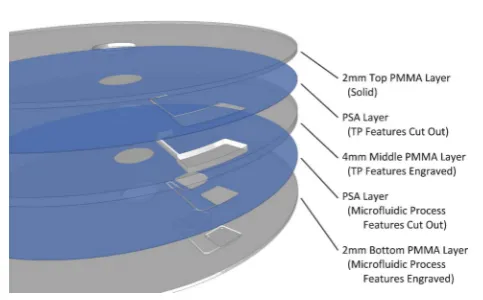
To fabricate CDs with a multi-level design, each CD is made of five distinctive layers: three layers of PMMA, and two layers of PSA. The CD fabrication technique is similar to that used for single-level CDs in our previous work.14 Fig. 2 shows the breakdown of the layers in the case of a CD designed for demonstrating push and pull pumping. The top layer consists of a solid 2 mm thick PMMA disc, the middle is a 4 mm thick PMMA disc with the TP features engraved in its top surface, and the bottom layer is a 2 mm thick PMMA disc again with microfluidic features engraved in its top surface. The PSA layers between the respective PMMA layers have TP and microfluidic features identical to the corresponding PMMA layers cut out to prevent liquid interaction with the PSA adhesive material. In addition, connection holes for liquid flow, air exchange, and venting are also cut out in the PSA layers. The TP level is carved out from the middle PMMA layer and the corresponding PSA layer above it, while the micro-fluidic process level is constructed in the bottom PMMA layer and the corresponding PSA layer above it. Once all five layers are fabricated, the layers are pressed-bound together using a custom made press roller system.
2.2 Experimental setup
After fabrication, the microfluidic CDs were loaded with the required liquids, and tested using a custom built CD spin test system (see Fig. 3). The CD spin test system consists of a motorized spinning module controlled through a LabVIEW program on a computer, a digital rpm meter, and a high speed camera. The LabVIEW program allows users to control the spin speed of the CD mounted on the spinning module, and the detection of a single reflective sticker (on the CD surface) by the rpm meter triggers the image capturingviathe camera at a rate of one image per revolution.
A modified industrial grade hot-air gun (model: Bosch GHG 630 DCE) with a built-in digital temperature controller is used as a forced convection heat source. The hot-air gun is fitted with a focusing nozzle to provide a heating area ofy1 cm in diameter when placed 1 cm above the CD surface. An infrared (IR) thermometer (model: Smart Sensor AR550) is used to measure the temperature on the CD surface. In this work we
Fig. 2Layered fabrication of the multi-level microfluidic CDs.
[image:3.595.309.551.557.707.2]implement a forced convection heat source because it provides some distinct advantages compared to using a focused infrared (IR) lamp or a laser light beam as used in previous work.5,9,11,15 Forced convection provides heating only on the CD surface, heating just the TP air chamber below the top layer, whereas focused IR and laser light heating penetrates through all layers on the CD and causes unnecessary excess heating. To determine the difference in heating between forced convection heating and IR heating, a simple heating test of the CDs used in our experiments is conducted. We have determined that at an ambient temperature of 25 uC, the relative increase in temperature in the microfluidic layer (bottom level) relative to the top CD surface is only 22% when using forced convection, and 80% when using IR heating. The heating area of our forced convection heat source is also large enough to cover the entire surface of the TP air chamber, providing uniform heating to the air in the TP air chamber. One more advantage of the forced convection method is the ability to provide both active heating and cooling of the CD. This can speed up the CD based assay steps considerably.
All experimental work was carried out under ambient temperatures of 25uC, and all CDs were air cooled to 25 uC prior to the start of every experiment. Colored de-ionized water (prepared at a ratio of one part food dye to ten parts de-ionized water) was used for test liquids.
2.3 Heating pattern and efficiency of multi-level 3D design
To study the effectiveness of implementing push and pull pumping on a multi-level 3D CD, and the practicality of forced convection heating, two groups of CDs were designed and fabricated. The first group was developed for establishing the heating pattern of the CD surface when using forced convection heating, and the second group of CD designs were meant for comparing the difference between TP pumping implemented in a single-level approach, a multi-level approach, and a multi-level approach implemented with a double volume TP air chamber. For a quantitative comparison,
the pump efficiency, and the volume expansion of the different designs are calculated.
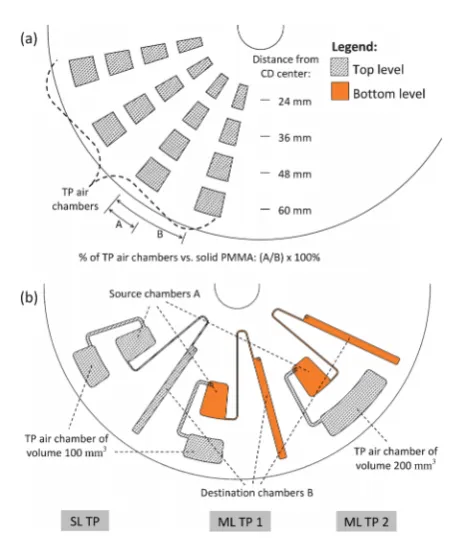
The first group of CD designs used to perform experiments to characterize the heating pattern of the CD surface is illustrated in Fig. 4(a). The purpose was to observe how the placement of the TP air chambers (in terms of average distance from the CD center), and also the spacing between TP air chambers (their ‘‘density’’) on the CD, influences the CD surface temperature, and what surface temperatures can be achieved at various heat source setting.
In the specific design shown in Fig. 4(a), the CD contains evenly spaced TP air chambers, placed along a circular path at 24 mm, 36 mm, 48 mm and 60 mm from the CD center, at 40% ‘‘density’’. The ‘‘density’’ of TP air chambers along the radial path of the forced convection heating of the CD surface during spinning is calculated by the percentage of radial path covered by TP air chambers on the radial path (denoted by (A/
B)6 100% as shown in Fig. 4(a)). Other CD designs in this group (not shown) consist of CDs that contain TP air chambers of varying densities placed along a circular path at 60 mm from the CD center (TP air chamber densities of 20%, 40%, 60%, and 80%).
The steps to test each CD design were identical. First, the CDs were mounted on the CD spin test system, and the heat source was positioned 1 cm above the CD surface over the TP air chambers to be tested. The CDs were spun at a constant speed of 300 rpm and the heat source was powered ON at 190 uC setting for 10 min. The CDs were then left to air cool for 5 Fig. 3Experimental setup: custom made CD spin test system consisting of a
motorized spinning module, digital rpm meter, and high speed camera all controlled and monitored with a computer configured with LabVIEW. Forced convection heating and CD surface temperature measurement are performed using a modified industrial grade hot-air gun and infrared (IR) thermometer.
Fig. 4(a) A design to evaluate CD surface heating. CD shown contains TP air chambers placed along various CD radii, and at 40% density (calculated by the percentage of area taken by TP air chambers on a radial path, denoted by (A/B) 6100%). (b) CD designs to evaluate single-level TP pumping (SL TP), multi-level TP pumping (ML TP), and multi-level TP pumping with double volumed TP air chamber (ML TP 2).
[image:4.595.51.281.49.196.2] [image:4.595.313.545.386.657.2]min. During the entire 15 min of the heating test, the CD surface temperature was recorded. During the start of the heating process, the surface temperature increases quickly within the first minute. To capture this sharp initial increase in temperature, the CD surface temperature was recorded once every 20 s for the first minute, and once every minute thereafter. The same measurement steps were applied during cooling, where the CD surface temperature was recorded once every 20 s for the first minute of cooling, followed by a measurement of once every minute. All experiments were performed 3 times.
To explore the achievable temperatures on the CD surface at various heat source settings, an additional experiment was performed on the CD design with TP air chambers (at 40% density) placed along a circular path at 60 mm from the CD center. This CD was spun at a constant speed of 300 rpm, and with the heat source initially set to 50 uC. The setting was increased by 20 uC increments once every 3 min, until the maximum heat source setting of 210uC was reached.
The second group of CD designs was fabricated to perform experiments to compare the effects of single-level design and multi-level design on TP pumping. This CD design group consists of 3 separate designs illustrated in Fig. 4(b), and each CD has a top level, and a bottom level. All three designs contain TP features for pumping liquid from a source chamber near the outer edge of the CD to a destination chamber near the CD center. The three designs are labelled SL TP for the single-level design and ML TP 1 and 2 for the multi-level designs. The SL TP design has the TP and the microfluidic process features in the same top level (directly under the surface of the CD), while the multi-layer designs have the TP features in the top level, and the microfluidic process features on the bottom level. The SL TP and the ML TP 1 designs have identical TP air chambers of 100 mm3in volume, and the ML TP 2 design has a TP air chamber volume of 200 mm3.
To test each CD design of this type, first, 80mL of colored liquid was injected into the source chamber, and the loading holes were sealed using single-sided adhesive. The heat source was then placed over the TP air chamber, and the CD was spun at a constant speed of 300 rpm. The initial liquid level (relative to the CD center) was recorded as a reference point. The heat source was set to 190uC and then powered ON. The heating of the TP air chamber pushes the liquid from the source chamber to the destination chamber. The time it took to fully transfer the liquid was recorded, and the CD surface temperature at that instant was measured.
2.4 Push and pull pumping experiments
As a proof of concept of push and pull pumping, and to demonstrate how push and pull pumping can be integrated as part of a larger complex microfluidic process, 2 CDs featuring TP pumping on multi-level 3D CDs were designed and fabricated (see Fig. 5).
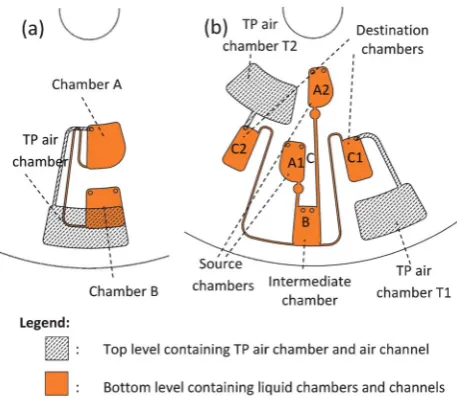
2.4.1 Push-pull pumping. The first CD design shown in Fig. 5(a) was developed to demonstrate the implementation of push and pull pumping on a multi-level 3D CD. The design has a top level containing TP features (TP air chamber T of 400 mm3volume, and air channel), and a bottom level containing chamber A, chamber B, and a connecting channel between the
two chambers. In this demonstration test, we show that liquid can be transferred in both directions (bi-directional) between two chambers by push pumping (during heating of the TP air chamber) and pull pumping (during cooling of the TP air chamber).
First, 80 mL of liquid was loaded into chamber A, and the loading holes were subsequently sealed. This sealing of the chamber is important to ensure proper pressure built up during the heating process. The CD was then mounted on the CD spin test system and spun at a constant 300 rpm. The heat source was positioned over the circular path of the spinning TP air chamber. The heat source was then powered ON at a 190 uC setting to push the liquid from chamber A into chamber B. After the liquid was pushed to chamber B, the heat source was left powered ON for one more minute before it was powered OFF to pull the liquid back into source destination chamber A. The need for this extended heating of the TP air chamber will be explained in detail in the ‘‘Results and discussion’’ section. This process can be repeated by simply reheating and cooling the TP air chamber.
2.4.2 Valve-less switch pumping.The second demonstration of push pull pumping on a multi-level 3D CD is the implementation of valve-less switch pumping. In valve-less switch pumping, liquid from different source chambers can be pulled into different destination chambers. The CD design for this example application is shown in Fig. 5(b). The top level of the CD contains two separate TP features (TP air chambers T1 and T2 of volume 160 mm3 each, and the associated air channels), while the bottom level contains two source chambers A1 and A2, an intermediate chamber B, and two destination chambers C1 and C2. The TP air channels of TP air chambers T1 and T2 are respectively connected to destination chambers C1 and C2. Source chambers A1 and A2 are designed to have different burst frequencies.
Fig. 5(a) A design to demonstrate push-pull pumping. Liquid will be pushed from chamber A to B, and will then be pulled from chamber B to A. (b) A design to demonstrate valve-less switch pumping. Liquid will burst from chamber A1 to B, it will then be pulled into C1, followed by liquid bursting from chamber A2 to B, it will then be pulled into C2.
[image:5.595.315.544.48.247.2]To perform the demonstration, 40 mL of blue and red colored liquids were loaded into source chambers A1 and A2 respectively. The CD was then mounted on the CD spin test system and spun at 250 rpm. The heat source was positioned above the circular path of TP air chamber T1, and powered ON at 190uC setting. The CD surface temperature above TP air chamber T1 was heated, and then the CD spin speed was increased to burst the liquid from source chamber A1. Once the liquid had burst into intermediate chamber B, the heat source was repositioned above the path of TP air chamber T2, and the CD spin speed was gradually increased to 300 rpm. This started the heating of TP air chamber T2, while allowing TP air chamber T1 to pull the blue liquid into destination chamber C1. Once the liquid transfer was completed, the heating was continued until the CD surface temperate above TP air chamber T2 reached 50uC. The CD spin speed was then further increased to burst the red liquid from source chamber A2 into intermediate chamber B. Once the red liquid had burst, the CD spin speed was adjusted back down to 300 rpm and the heat source was repositioned above TP air chamber T1, and adjusted to 50uC setting. This kept TP air chamber T1 warm, while allowing TP air chamber T2 to pull the red liquid into destination chamber C2. The need for this warming of TP air chamber T1 will be explained in detail in the ‘‘Results and discussion’’ section.
3. Results and discussions
The results are categorized into four sub-sections following the sequence of experiments described in the ‘‘Materials and methods’’ section. The overall characteristic and the heating process of the CD will be presented in the first two sections, while the remaining 2 sections will discuss the implementa-tion of push and pull pumping, and valve-less switch pumping.
3.1 Heating pattern
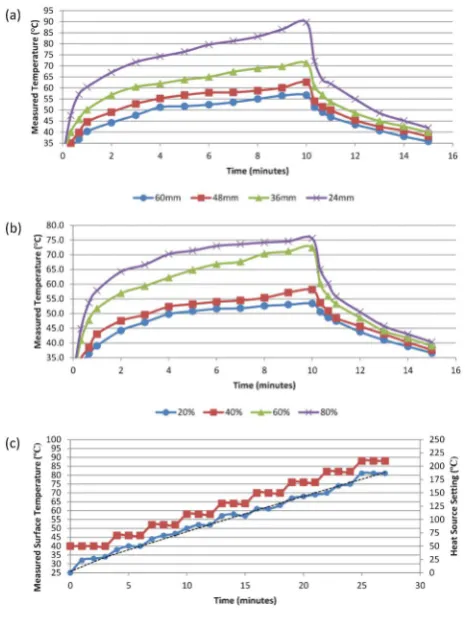
This section describes the pattern of the CD surface heating, and the optimal heat source setting for achieving the required CD surface temperatures. The effect of the placement of the TP air chambers as a function of their distance from the CD center on CD surface heating is shown in Fig. 6(a). The figure can be broken up into two parts: the first part shows the heating of the CD during the first 10 min when the heat source is powered ON, the second part shows the cooling of the CD for the next 5 min after the heat source is powered OFF, and the CD is left to air cool at 300 rpm.
In general, when the heat source is initially powered ON, the CD surface temperature rises rapidly within the first minute. The increase in temperature slows down after the first minute, and it can be seen that the temperature approaches a saturated asymptote within 10 min of heating. Similarly, when the heat source is initially powered OFF, and the CD is left to cool down while spinning at 300 rpm, the CD surface experiences a drastic drop in temperature within the first minute. However, the drop in temperature gradually slows
down as the CD surface temperate approaches ambient room temperature.
From the results in Fig. 6(a), it is clear that during heating, the CD surface temperature rises significantly faster, and higher for TP air chambers that are located closer to the CD center. This effect of the placement of the TP air chambers along circular paths at different distances from the CD center can be explained by the difference in heating duration experienced by the TP air chambers. As the CD spins, the heat source is directed along a circular path of the CD, resulting in a ring area being heated on the CD surface. As the heat source is placed closer to the CD center, the ring area shrinks, and the heat source delivers thermal energy to a smaller area on the CD surface. This results in greater heat transfer per unit area near the CD, compared to heat transfer per unit area near the outer edge of the CD.
During cooling, the results in Fig. 6(a) show that the surface temperature drops more significantly for locations nearer to the CD center. This drop in temperature is much greater due to the bigger variance between the CD surface temperature (at the time the heat is shut OFF) and the ambient temperature at locations closer to the CD center compared to locations nearer to the edge of the CD.
Fig. 6(a) Heating pattern of the CD surface with TP air chambers placed along various radii on the CD, at 40% density, 300 rpm, and 190uC heating. (b) Heating pattern of the CD surface with TP air chambers of various densities, placed along 60 mm radius, at 300 rpm, and 190uC heating. (c) Achievable CD surface temperature with stepped increments of heat source setting.
[image:6.595.312.545.48.357.2]Fig. 6(b) shows the effect of the ‘‘density’’ of TP air chambers on CD surface heating. The results indicate that the temperature rises faster with higher TP air chamber ‘‘densi-ties’’. This is logical as the heat capacity of PMMA is higher than that of air trapped in the TP air chambers.16,17A higher heat capacity requires more heat to increase the temperature of a material, and hence with more TP air chambers on a CD (or higher TP air chamber ‘‘density’’), the faster the surface temperature increases.
The result of the experiments to estimate achievable CD surface temperatures at various heat source settings is shown in Fig. 6(c). It can be seen that at an initial heat source setting of 50 uC, the CD surface temperature rises fast from an ambient temperature of 25 uC to match the 50 uC imposed, and approaches saturation after just 3 min. The same is observed for every step of heat source temperature increments of 20 uC. The results show a consistent increase in surface temperature with each increase in heat source setting. This profile allows for the creation of an expression that predicts small jumps in CD surface temperatures based on the heat source setting. The relationship between heat source setting and CD surface temperature can be presented by a second order transfer function as follows:
DTS=k2DT2H+k1DTH+k0 (1)
whereDTSis the measured CD surface temperature relative to the ambient temperature, and DTH is the heat source temperature setting relative to the ambient temperature. The thermal transfer coefficients k2, k1, and k0 were optimized based on the experimental results as2161024, 0.32, and 0.7 respectively. The theoretical presentation of the surface temperature using eqn (1) is calculated and presented in the same figure, Fig. 6(c), and it closely matches the saturation CD surface temperatures recorded during the experiments.
3.2 Efficiency of multi-level 3D design
A simple measure of TP pump efficiency is based on the achievable flow rate over surface temperature change. This requires a simple calculation of the amount of liquid transferred over the time it takes for that transfer, and the change in temperature required to accomplish that transfer, or:
QT~
DV
DtDTC
(2)
whereQTis the flow rate per temperature gradient,DVis the volume transferred,Dt is the time required for the transfer, andDTCis the change in CD surface temperature required to accomplish the transfer.
For a more detailed comparison of TP pump performance, we also calculate a constantkthat expresses the efficiency of the pump to convert thermal energy to pneumatic pressure,11 as:
k~ T0zDTC
DT2 C
2P0 rv2R2
0
(3)
where T0 is the ambient temperature in Kelvin, DTC is the change in temperature on the CD surface, P0 is the normal atmospheric pressure,ris the density of the liquid in the CD, vis the fixed angular velocity, andR0is the initial distance of the liquid meniscus to the CD center.
An expression for air expansion in the TP air chamber can be obtained by taking the derivative of the ideal gas law, and applying the initial and heated conditions of the CD into the equation, as:
Vh~
nR(Th{T0)z2P0V0{V0Ph
P0
(4)
whereVh is the air volume after heating,V0is the initial air volume before heating,nis the number of moles of air that is heated in the top level of the CD,This the temperature after heating, T0 is the initial temperature, Ph is the maximum pressure during spinning, andP0is the initial pressure.
As our TP pumping method does not fully obey the ideal gas law, a corrective heat factorkTPneeds to be introduced:
Vh~kTP
nR(Th{T0)z2P0V0{V0Ph
P0
(5)
wherekTPis optimized based on the experimental results and the constantkfrom eqn (3) as 0.0856k22/3.
Using experimental results, the flow rate calculated using eqn (2), the constant k calculated using eqn (3), and the increase in air volumeDVhcalculated asVh2V0(whereVhis calculated using eqn (5)) are presented in Table 1 for the three CD designs in Fig. 4(b): single-level TP, multi-level TP, and multi-level TP with double TP air chamber volume. For both flow rateQTand constantk, higher values mean a better pump efficiency. ForDVh, the ideal value is 80mL (which is the liquid that is displaced from source chamber A).
At first glance, the calculated flow rate QT and the model constantkvalues suggest that a single-level TP design is more efficient than a multi-layer design when the two designs have identical TP air chamber volumes. However for the single-level design, while the TP feature is being heated directly, the microfluidic process features are also heated. This effectively causes the air in both the TP features, and also the air in the source chamber to be heated and expanded. Thus the faster flow rate and the higher model constantkcalculated for the single-level TP design is due to an effectively bigger TP air chamber volume (including the air within the TP features and also the microfluidic process features), and not due to higher efficiency of the design.
For the two multi-level 3D CD designs with different volumes of TP air chambers, the flow rate and the model constantkvalues are improved significantly as expected from the above arguments. The flow rate is almost three times faster when the TP air chamber volume is doubled, and the model constant k indicates that a TP design with bigger volume is much more efficient. The results also allow us to cut the liquid transfer times by more than half when the TP air chamber volume is doubled. Since this increased real-estate is built up in the vertical direction rather than the horizontal direction,
implementing this expanded volume is worth the space penalty.
The calculated DVh for the single-level TP design and the multi-level TP design are less than the 80mL obtained for the multi-level TP design (with double TP air chamber volume). This indicates that either more heat is delivered than anticipated (not accounted for by eqn (5)), or less heat is dissipated through the bottom of the CD where it is constantly air cooled. For the single-level TP design, the placement of both the TP air chamber and the source chamber in the top level results in more heat delivered from the top, and less heat dissipated through the bottom. For the multi-level TP design, as it has a bigger PMMA contact surface per volume of air in the TP air chamber, more heat per unit volume is transferred from the forced convection heating compared to the multi-level TP design (with double TP air chamber volume). However, to obtain an accurate prediction for air expansion for each of the designs, the corrective heat factorkTPcan be respectively optimized for each design.
3.3 Push and pull pumping
Push and pull pumping allows for the manipulation of liquid back and forth between two chambers. The principle of operation is based on expanding air (heating) creating positive push pressure, and contracting air (cooling) creating negative pull or suction pressure. The two contradicting pressures created during heating and cooling allows one to push liquid out of a chamber during heating, and pull liquid back during cooling. Push pumping can be activated by heating a cool TP air chamber, while pull pumping can be activated by cooling down a hot TP air chamber.
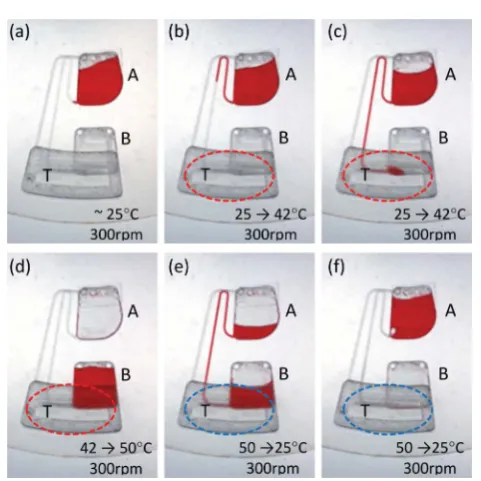
The CD design for the proof of concept of push and pull pumping is shown in Fig. 5(a), and the various stages of the actual pumping processes are shown in Fig. 7. The process starts with the loading the colored liquid into chamber A (see Fig. 7(a)). Next the CD is spun at 300 rpm and the heat source is placed above the CD over the TP air chamber T and powered ON. The heating of the CD surface causes the trapped air inside the TP air chamber T to expand through the air channel and connection hole into chamber A. The built up air pressure activates the TP pumping and pushes the liquid from chamber A into the channel adjoining the destination chamber B (see Fig. 7(b)). Fig. 7(c) and 7(d) respectively show the liquid filling chamber B, and the complete transfer of the liquid from chamber A to chamber B. The push pumping process takes approximately 1.5 min, and the CD surface temperature is measured to be approximately 42uC.
[image:8.595.43.549.68.120.2]Note that because chamber A is closer to the CD center than chamber B, liquid movement from chamber A to chamber B is in line with the direction of the centrifugal force, while liquid movement from chamber B to chamber A is against the centrifugal force. To ensure sufficiently low pressure is generated during the cooling process to pull the liquid back from chamber B to chamber A, the heat source is left powered ON for another 1 min. During this extended heating period, the heated air in TP chamber T expands and escapes through the venting holes in chamber B. The surface temperature at the end of the additional 1 min is approximately 50uC. Once the heat source is powered OFF, the CD is allowed to cool down while rotating at 300 rpm. The cooling air in TP air chamber T then contracts, creating a negative pressure condition in the TP air chamber T. As a result, suction pumping occurs and the liquid in chamber B is pulled into the connecting channel back towards chamber A (see Fig. 7(e)). Table 1Pump performance comparison of single-level TP, multi-level TP, and multi-level TP with double TP air chamber volumea
CD Design: Dt(min) DTC(deg) QT(mL (min deg)21) k(61022/deg) DVh(mL)
Single-level TP 5.6 13.6 1.04 1.24 75
Multi-level TP 8.3 14.3 0.67 1.11 78
Multi-level TP (with double TP air chamber volume) 3.7 12.0 1.81 1.59 80
aNote: IdealDV
his 80mL,T0is 25uC,Dtis the time required for liquid transfer,DTCis the change in CD surface temperature,QTis the flow
rate per temperature gradient using eqn (2),k, is the model constant using eqn (3),DVh=Vh2V0, whereVhis obtained using eqn (5).
Fig. 7(a) Liquid is loaded into chamber A. The heat source is then powered ON. (b) Heating activates push pumping of the liquid out of chamber A. (c) Push pumping of the liquid from chamber A to B in progress. (d) Push pumping of the liquid into chamber B is complete. The heat source is then powered OFF. (e) Cooling of CD activates pull pumping of liquid from chamber B to A. (f) Pull pumping of liquid from chamber B back into chamber A is complete. Note: the circle indicates heating/cooling zones.
[image:8.595.309.550.404.645.2]The transfer of liquid from chamber B to chamber A takes approximately 5 min (see Fig. 7(f)), which is longer than the first transfer of liquid from chamber A to chamber B. This is due to the difference in the required pressure to overcome the centrifugal force.
The push pull process presents a novel way to transfer liquid between two chambers regardless of their placement on the CD. Unlike traditional CD microfluidics where liquid pumping (i.e.bursting) relies on incremental CD spin speeds, the push and pull (bi-directional) pumping works independently of the CD spin speed. This pumping method offers a valuable alternative pumping method for complex processes where the manipulation of liquid through bursting of passive valves is limited by spatial or design restrictions. Moreover, this process can be implemented repeatedly during spinning, and can be used to perform processes such as flushing, washing, soaking, mixing, and draining of chambers.
3.4 Valve-less switch pumping
An advanced application of the pull pumping is valve-less switch pumping. The process demonstrates the possibility of bursting two different liquids into one common intermediate chamber at separate times, and successively pulling the liquids into separate destination chambers.
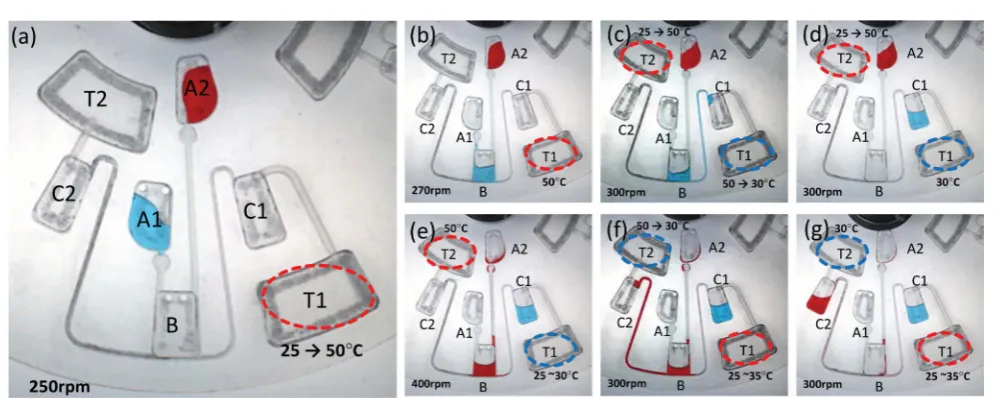
Fig. 8(a) shows the start of the process by loading blue and red colored liquids into the respective source chambers. The CD is then spun up to 250 rpm, and air chamber T1 is heated. After the CD surface temperature above the TP air chamber T1 reaches 50uC, the CD spin speed is gradually increased to 270 rpm to burst the blue liquid from source chamber A1 into intermediate chamber B (see Fig. 8(b)).
Immediately after the blue liquid bursts, the CD spin speed is increased to 300 rpm, and TP air chamber T2 is heated. This prepares TP air chamber T2 for the next pull pumping while the air in TP air chamber T1 cools down and contracts, pulling
the blue liquid from intermediate chamber B to store chamber C1. As shown in Fig. 8(c) and (d), after four minutes, the blue liquid is pulled from intermediate chamber B to destination chamber C1, and the CD surface temperature above TP air chamber T1 is measured to be 30uC.
Once the blue liquid has been completely transferred, and the surface temperature above the TP air chamber T2 is measured to be at 50 uC, the CD spin speed is gradually increased to 400 rpm to burst the red liquid from source chamber A2 (see Fig. 8(e)). After bursting, the spin speed is adjusted down to 300 rpm, and the heat source is set to 50uC and repositioned above TP air chamber T1.
It is observed that during prolonged heating, the ambient temperature in the immediate vicinity of the CD is raised above the original 25 uC value by a few degrees. This causes mild heating of the TP air chamber T1 during the heating of TP air chamber T2, and if the heat source if powered OFF, both TP air chambers would pull on the red liquid from intermediate chamber B. The 50 uC heat setting is just sufficient to keep the TP air chamber T1 from pulling on the red liquid from intermediate chamber B.
As expected, the contracting air in TP air chamber T2 pulls the red liquid from intermediate chamber B into destination chamber C2 (see Fig. 8(f) and (g)). The transfer of the red liquid to destination chamber C takes approximately 5 min when the CD surface above TP air chamber T2 cools to 30uC. Valve-less switch pumping presents a more advanced alternative to liquid switching than the ones relying on external air pressure18 or Coriolis force.19The method allows for the possible design of a range of complex microfluidic processes sharing a common intermediate chamber, i.e.
reaction chamber, followed by proper sorting and storage of the processed liquids. Furthermore, when implemented on a multi-level 3D CD, the microfluidic process can span across
Fig. 8(a) Coloured liquids are individually loaded into chambers A1 and A2. The heat source is then powered ON over TP air chamber T1. (b) Blue liquid bursts from chamber A1 into chamber B. The heat source is then repositioned over TP air chamber T2. (c) Pull pumping of blue liquid from chamber B into chamber C1 in progress. (d) Pull pumping of blue liquid into chamber C1 is completed. (e) Red liquid bursts from chamber A2 into chamber B. The heat source setting is then lowered, and repositioned over TP air chamber T1. (f) Pull pumping of red liquid from chamber B into chamber C2 is in progress. (g) Pull pumping of red liquid into chamber C is completed. The heat source is then powered OFF. Note: the circles indicate heating and cooling areas where the surface temperature is measured.
[image:9.595.49.549.465.664.2]multiple levels, allowing for more involved processes, or the liquid can be transferred between levels where different microfluidic applications are carried out.
4. Conclusion
In this paper we introduced a thermal pneumatic push and pull pumping method which expands the CD platform’s capability dramatically. The push and pull pumping method allows for bi-directional pumping of liquid in any direction between two connected liquid chambers. In this work, we presented the implementation of push and pull pumping on a multi-level 3D CD, using localized forced convection heating. The multi-level approach allows us to address the problem of spatial challenges inflicted by the introduction of the TP air chamber by placing the TP features on a top level separate from the microfluidic process. The approach thereby provides heat shielding of the microfluidic processes.
To ease the design of advanced applications based on push and pull pumping, fundamental experiments to test heating efficiency were carried out. The findings indicate that heating is more effective with a higher density of TP air chambers, and more efficient when placed near to the CD center. In the study, we also conclude that small increases in CD surface temperature can be manipulated by carefully controlling the setting of the forced convection heat source.
The proof of concept of the push and pull pumping was demonstrated successfully, and an advanced application namely valve-less switch pumping was demonstrated. The demonstration confirms that the push and pull pumping method increases the flexibility of microfluidic CD platforms. The results suggest the possibility of alternative implementa-tion for flushing, washing, soaking, mixing, and draining of chambers.
The push and pull pumping method can be used in potential multi-stepped biological microfluidic processes such as the Enzyme-Linked Immunosorbent Assay (ELISA) for virus detection on a CD. In an ELISA, enzyme, substrate, washing, and stopping solutions are sequentially transferred to a detection chamber, and then siphoned to a waste chamber.4– 7By implementing pull pumping, the siphon activated waste
chamber at the outer perimeter of the CD can be removed, and the waste can be stored on a separate level to maximize space usage on the microfluidic level. Furthermore, by using valve-less switch pumping, we not only allow the final storage or waste chamber of the ELISA process to be on a separate level closer to the CD center, but provide the flexibility of performing liquid sorting into different chambers as required. In summary the introduced push and pull pumping method increases the flexibility of microfluidic platforms, and when implemented on a multi-level 3D CD, more complicated microfluidic processes can be carried out.
Acknowledgements
This research is supported by UM High Impact Research Grant UM-MOHE UM.C/625/1/HIR/MOHE/05 from the Ministry of Higher Education Malaysia, and University of Malaya Research Grant (UMRG: RG023/09AET). The authors would like to acknowledge Prof. Dr Noorsaadah Abd Rahman from the Department of Chemistry, Faculty of Science, University of Malaya and her grant ‘‘Hits-to-Lead: Designing Dengue Virus Inhibitors, National Biotechnology Directorate (NBD) Initiative-Malaysian Institute of Pharmaceuticals and Nutraceuticals (IPharm), Ministry of Science, Technology and Innovation (MOSTI IPHARM 53-02-03-1049)’’ for partially sponsoring the initial set-up of the CD Spin Test System. MM and JM acknowledge support of the National Institute of Health (grant 1 R01 AI089541-01), and support of WCU (World Class University) program (R32-2008-000-20054-0) through the National Research Foundation of Korea funded by the Ministry of Education, Science and Technology.
Notes and references
1 M. Madou, J. Zoval, G. Jia, H. Kido, J. Kim and N. Kim,
Annu. Rev. Biomed. Eng., 2006, 8, 601–628.
2 J. V. Zoval and M. J. Madou,Proc. IEEE, 2004, 92, 140–153. 3 J. Ducre´e, S. Haeberle, S. Lutz, S. Pausch, F. Von Stetten and R. Zengerle, J. Micromech. Microeng., 2007, 17, S103–S115.
4 S. Lai, S. Wang, J. Luo, L. J. Lee, S. T. Yang and M. J. Madou,
Anal. Chem., 2004, 76, 1832–1837.
5 B. S. Lee, J. N. Lee, J. M. Park, J. G. Lee, S. Kim, Y. K. Cho and C. Ko,Lab Chip, 2009, 9, 1548–1555.
6 F. Ibrahim, A. A. Nozari, P. Jahanshahi, N. Soin, N. A. Rahman, S. Z. M. Dawal, M. K. B. A. Kahar, K. A. Samra and M. Madou, 2010 IEEE EMBS Conference on Biomedical Engineering and Sciences (IECBES), 2010, 466–470.
7 N. A. Yusoff, N. Soin and F. Ibrahim,Proceedings of IEEE Symposium on Industrial Electronics & Applications (ISIEA) 2009, Kuala Lumpur, 2009, pp. 946–950.
8 H. Kido, M. Micic, D. Smith, J. Zoval, J. Norton and M. Madou,Colloids Surf., B, 2007, 58, 44–51.
9 J. Burger, A. Gross, D. Mark, F. Von Stetten, R. Zengerle and G. Roth, Proceedings of the 16th International Solid-State Sensors, Actuators and Microsystems Conference, TRANSDUCERS’11, Beijing, China, 2011, pp. 2867–2870. 10 M. Amasia, M. Cozzens and M. J. Madou,Sens. Actuators, B,
2012, 161, 1191–1197.
11 K. Abi-Samra, L. Clime, L. Kong, R. Gorkin Iii, T. H. Kim, Y. K. Cho and M. Madou, Microfluid. Nanofluid., 2011, 11, 643–652.
12 K. Handique, D. T. Burke, C. H. Mastrangelo and M. A. Burns,Anal. Chem., 2001, 73, 1831–1838.
13 S. M. Ha, W. Cho and Y. Ahn,Microelectron. Eng., 2009, 86, 1337–1339.
14 T. H. G. Thio, S. Soroori, F. Ibrahim, W. Al-Faqheri, N. Soin, L. Kulinsky and M. Madou,Med. Biol. Eng. Comput., 2013, 51, 525–535.
15 K. Abi-Samra, R. Hanson, M. Madou and R. A. Gorkin III,
Lab Chip, 2011, 11, 723–726.
16 S. Kalpakjian and S. Schmid,Manufacturing Engineering and Technology. 5th Ed in SI Units, Pearson/Prentice Hall, Singapore, 2006.
17 R. M. Felder and R. W. Rousseau,Elemetrary Principles of Chemical Processes. Wiley Internation Edition., John Wiley & Sons, Singapore, 2000.
18 M. C. R. Kong and E. D. Salin, Anal. Chem., 2011, 83, 1148–1151.
19 J. Kim, H. Kido, R. H. Rangel and M. J. Madou, Sens. Actuators, B, 2008, 128, 613–621.