5
X
October 2017
A Computational Geometry Based Facility
Location Model for Healthcare Management
System
Parthajit Roy1
1
Department of Computer ScienceThe University of Burdwan West Bengal, India-713104
Abstract: Facility location problem is an important problem in the field of optimization. Identification of existing locations, allocation of resources is long standing topics for research communities. This paper proposes a novel facility location identification and resource allocation model based on computational geometric tools namely Delaunay triangulation and Voronoi diagram. The proposed model has been applied in the field of Healthcare management system for suggesting locations of new hospitals as well as locations for deployment of mobile hospitals. The model is fully automated and computationally efficient and performs well in the existing setup.
Keywords: Facility Location; Voronoi Diagram; Delaunay Triangulation; Push-Pull Model; Computational Geometry.
I. INTRODUCTION
well as capable of suggesting the best location considering the existing healthcare setup.The rest of the paper is organized as follows. Section 2 gives the literature review, section 3 presents the details ofthe geometrical phenomena used model. The actual model is proposed in section 4. Section 5 discusses some of the problems and drawbacks of the proposed model. Conclusion comes in section 6 and the references come at the end.
II. LITERATURE REVIEW
Facility location is a long standing problem and it has a fascinating history. Some early proposal of facility location problem in the context of network and communication is due to McGregor et al [2]. Some early proposal of facility location was made by Calvo et al [3]. The model was mainly concentrated on integer programming models. Some refinements of Calvo’s model was done by Tien et al [4] . A good survey on facility locations has been done by ReVelle et al[5]. A survey on multi criteria facility locations can be found in the work of Farahani et al[6]. An up-to-date survey on facility location in the field of healthcare is due to Ahmadi-Javid et al [7].
The application of Voronoi in the field of optimization is not new. A Voronoi based model for optimum location for goods has been proposed by Riol et al[8] whereas a nearest hospital suggestion model has been proposed by Roy et al[9]. A case study on rail station identification is due to Rosa Mota et al [10]. An electrical distribution boundary using Voronoi diagram has been proposed by Held et al [11]. Some mixing of GA and Voronoi diagram for system expansions have been proposed by Jimenez-Estevez et al [12].
Geographical Information System in the field of healthcare is a fascinating area of research. Some examples of GIS in primary medical care accessibility has been proposed by Parker et al [13] and its impact on healthhas been considered by Nguyen et al[14]
Delaunay Triangulation (DT) is a planar decomposition of spatial points. It has some interesting properties like its planarity. A DT is a planar decomposition of a complete graph such that the minimum spanning tree of the DT agrees with the minimum spanning tree of the complete graph given all edge weights are metric Berg et al. [15]. Voronoi diagram is the planar dual of the Delaunay Triangulation. A good survey of Delaunay Triangulation and Voronoi diagram can be found in the book of O'Rourke [16]. Some application of DT for spectral clustering is done by Roy et al[17].
III. ESSENTIAL GEOMETRY
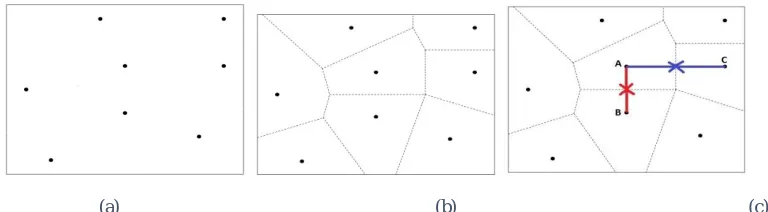
We now turn to mathematics needed to explain the proposed model. First we shall discuss Voronoi diagram. A Voronoi diagram is a decomposition of a spatial domain around some spatial points in such a way that the spatial point is the closest from any point in the cell.Let us consider the sample points shows in Figure 1(a). These are the sample points. The Voronoi diagram of the sample points are shown in Figure 2. There are several impornant properties of Voronoi diuagram These are as follows.
A. A Voronoi diagram is a planar decomposition.
B. The closed area formed by the Voronoi lines is called a Voronoi cell and each Voronoi cell contains ona single nodal point.
C. From everylocation inside a Voronoicell, the inside nodal point is the closest nodal point.
D. From every voronoi line, the neighboring nodal points are equidistant. It is shown in Figure 3. In Figure 3 location A and B are equidistant from their separating Voronoi line. The red arroes show this. Similarly, the blue arrows indicate that the points A and C are at same distance from their separating Voronoi lines.
E. The meeting point of three or more Voronoi lines is called Voronoi junction and the nodal points of the corresponding Voronoi cells are all equidistant.
In our present model we are going to use Voronoi diagram in push based model.
(a) (b) (c)
[image:3.612.119.503.577.683.2]Now we shall discuss the Delaunay Triangulation. Given a set of points in an Eucidean metric space, a Delaunay decomposition is a planar decomposition of the plane with the following properties.
F. The decomposition is a planar triangulation where each the points resides at each corner of the triangles.
G. The circumcircle of the triangle is empty. i.e. circumcircle of any triangle does not contain any other points from the point set.
H. The Decomposition alweays form a convex hull.
As an illustration, consider the same set of points as shown earlier in Figure 2(a). The black points are the nodes. The Delaunay triangulation of the points is shown in Figure 2(b). Clearly the Delaunay Triangulation is a convex hull. Further the Delaunay triangulation is a is a planar decomposition of the set of points. Figure 2(b) shows the empty circumcircle property. The circle passing through the points A, B and C is shown in red colour in Figure 3. Clearly, there is no other node inside the circle. i.e the circle is empty. Fra a Delaunay triangulation, all such circles are empty. This completes the geometrical discussions. We are now ready to propose the model.
[image:4.612.108.508.231.353.2](a) (b) (c)
Figure 2Sample points in the spatial domain. (b) Delaunay Triangulation of the spatial points. (c) The empty circumcircle property of Delaunay Triangulation.
IV. PROPOSED MODEL
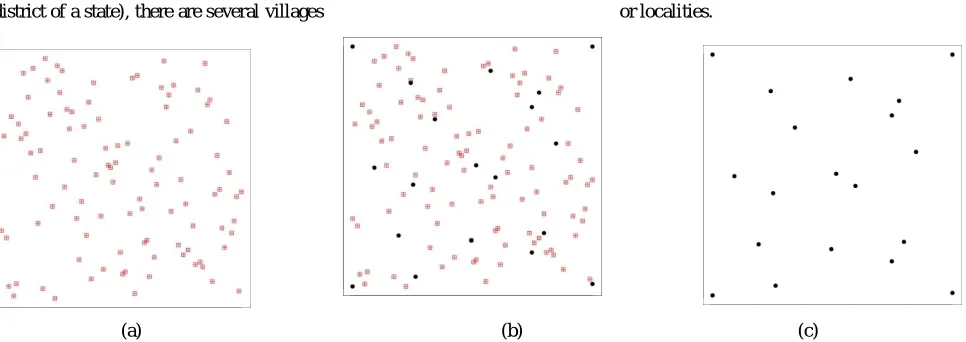
Let us now propose the model. The model is a Delaunay-Voronoi diagram based model. Let us consider that in a large area (district of a state), there are several villages or localities.
(a) (b) (c)
Figure 3(a) The distribution of village or localities. (b) The Distribution of Hospitals and Villages, The hospitals are shown in
[image:4.612.71.554.416.587.2]A. Push and Intermediary Tier
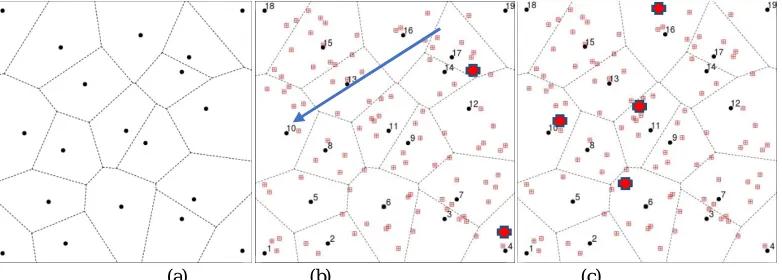
First we shall propose the model for push based location centres. To compute such suggestions with maximum facility in the existing setup, the model considers only the hospitals in a spatial domain. These are considered as the nodes of a graph (Figure 2(a)).The Voronoi diagram of the nodes is then computed. The Voronoi diagram is shown in Figure 4(a). The Voronoi diagram has a property that the Voronoi node is the closest node from all of the points in the concern cell. This means, the people of a particular Voronoi cell will know which one is the nearest hospital to them (Figure 4(a)). Further, the Voronoi junction points are the very good locations for Mobile Hospital location. It can be noted that keeping the mobile hospital van at hospital is not an optimum idea. Some mobile van/mobile hospitals may be placed at certain Voronoi junctions. This will reduce the total traveling time. i.e. if the Mobile van is kept at hospital, then van has to go to patient location and has to come back to hospital. Instead if we place the mobile van at the junction points (Shown in arrow in Figure 4(b)), then it can give better support to the surrounding villages to three different hospitals. So, the suggestion is that the mobile hospital vans have to be kept at Voronoi corners. Obviously, depending upon the resources, the allocation should be done. Our proposal is, do not deploy a mobile vans should be deployed in such a way that no cell gets the access of two vans. As in the Figure 4(b), as the arrow centred location covers hospital no. 8,11 and 13, No van should be placed in a way that any one of 8,11 or 13 becomes accessible. In that way we can minimize the number of vans without compromising the service quality. In Figure 4(c) the red marked location are the good junction points for such push based facility locations.
(a) (b) (c)
Figure 4(a) Voronoi decomposition of the points shown in Figure 3(c). (b) The population distribution is superimposed in the Voronoi distribution for better understanding of the nearest hospitlas. (c) According to Voronoi decomposition, some possible
locations of mobile hospitals. The Red plus sign shows these.
B. Pull Tier Facility Location Model
The second task of the model is to propose the new locations for building new health centres. The new locations should be as far as possible from the existing locations. This will increase the utilization. The present model proposes a Delaunay triangulation based suggestion for this purpose. In the proposed pull model, we are computing Delaunay triangulation of the Hospitals (Figure 5 (a) and (b)).Now consider Figure 5(c). In this figure, two circles are shown in red colour. One is passing through facility location A,B,C and the other is passing through D,E,F. We have already seen in Section 3, that one property of Delaunay triangle is that all such circumcircles are empty i.e. no other facility point will be inside these circles. So, the centre of the circle is the farthest point from all other facility locations in the periphery. Further, if all the circles are considered, then the centre of the largest circle, i.e. location S in Figure 5(c), is the best location for such facility. If there are funds for n facility locations, then the n largest circles can be chosen and the centres of them may be suggested as the place for facility locations.
Figure 5 (a) Delaunay triangulation of the facility locations with the distribution of the villages. (b) The Delaunay triangulation of the facility locations. (c) The pull tier suggestion made by the Delaunay triangulation. The point S is the best location for new
[image:5.612.114.505.270.410.2]C. Effectiveness of the Proposed Model
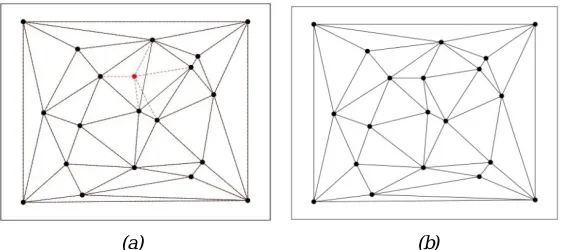
The proposed model is a Delaunay-Voronoi based model for deploying mobile health facilities as well as for deploying new static facility locations. If there are facility location in a given area, the model computes Delaunay triangles for those locations. The time complexity of Delaunay triangulation is ( √ ). The polynomial time shows that the computation is very efficient. The Voronoi computation also takes ( log ) time complexity. So computation of Voronoi diagram is also very efficient. Secondly, there is another striking feature of both Delaunay triangulation and Voronoi diagram. The constructions of both Delaunay triangulation and Voronoi diagram are incremental. Means, we can add new points and recomputed the DT or Voronoi diagrams. The Voronoi diagram or the DT will be affected locally surrounding the newly added point. Not the entire structure will be affected. To understand this in case of Voronoi diagram, consider Figure 6(a) and Figure 6(b). In Figure 6(a) , the red point is the location of new health centre. Once, the new location has been added, the Voronoi cells are recomputed. Re-computation is shown in red dotted lines. Most of the lines are superposed with the existing lines. Only few are different. This proves that the addition of a new facility location doesn’t alter all the positions of the Mobile facility centres. This is an essential requirement. Final outcome is shown in Figure 6(b).
(a) (b)
Figure 6 (a) Re-computation of Voronoi diagram after the addition of a new hospital. The red dotted lines are the extra lines. (b) The final Voronoi diagram. It is clear that most part of diagram is same. Only some portion near newly added point has been deviated.
Secondly, DT also follows incremental construction. Addition of a new point alters only some of the proximities of the point. Figure 7(b) shows this in dotted red lines. The final output is shown in figure 7(b). The main advantage of this property is, that the administration can take a decision about more than one facility locations at a time.
(a) (b)
Figure 7(a)The Delaunay triangulation after the addition of new point. The red dotted lines are the new triangles. All other triangle are same as before. (b) The final triangulation after removing the old triangles.
V. CONCLUSION
[image:6.612.173.442.238.362.2] [image:6.612.166.448.462.587.2]REFERENCES
[1] A. V. Banerjee and E. Duflo, Poor Economics: Rethinking Poverty & the Ways to End it, 2nd ed., RHI, 2013.
[2] P. McGregor and D. Shen, "Network Design: An Algorithm for the Access Facility Location Problem," IEEE Transactions on Communications, vol. 25, no. 1, pp. 61-73, 1977.
[3] A. Calvo and D. H. Marks, "Location of health care facilities: An analytical approach," Socio-Economic Planning Science, vol. 7, pp. 407-422, 1973.
[4] J. M. Tien, K. El-Tell and G. R. Simons, "Improved formulations to the hierarchical health facility location-allocation problem," IEEE Transactions on Systems, Man, and Cybernetics, Vols. SMC-13, no. 6, pp. 1128-1132, 1983.
[5] C. ReVelle and H. Eiselt, "Location analysis: A synthesis and survey," European Journal of Operational Research, vol. 165, no. 1, pp. 1-19, 2005.
[6] R. Z. Farahani, M. SteadieSeifi and N. Asgari, "Multiple criteria facility location problems: A survey," Applied Mathematical Modelling, vol. 34, no. 7, pp. 1689-1709, 2010 .
[7] A. Ahmadi-Javid, P. Seyedi and S. S. Syam, "A survey of healthcare facility location," Computers & Operations Research, vol. 79, no. Supplement C, pp. 223-263, 2017.
[8] E. Riol, J. C. Puche, F. J. Delgado, J. Finat and R. Martinez, "Weighted Voronoi Diagrams for Optimal Location of Goods and Services in Planar Maps," in 2011 Eighth International Symposium on Voronoi Diagrams in Science and Engineering, 2011.
[9] P. Roy and J. K. Mandal, "A Novel Fuzzy-GIS Model Based on Delaunay Triangulation to Forecast Facility Locations (FGISFFL)," in 2011 International Symposium on Electronic System Design, 2011.
[10] D. R. Mota, M. Takano and P. W. G. Taco, "A Method Using GIS Integrated Voronoi Diagrams for Commuter Rail Station Identification: A Case Study from Brasilia (Brazil)," Procedia - Social and Behavioral Sciences, vol. 162, no. Supplement C, pp. 477-486, 2014.
[11] M. Held and R. Williamson, "Creating electrical distribution boundaries using computational geometry," IEEE Power Engineering Society General Meeting, 2004, vol. 1, p. 892, 2004.
[12] G. A. Jimenez-Estevez, L. Vargas and R. Palma-Behnke, "Genetic algorithms and Voronoi polygons applied to decision making in the distribution systems expansion problem," in 2008 IEEE/PES Transmission and Distribution Conference and Exposition: Latin America, 2008.
[13] E. Parker and J. Campbell, "Measuring access to primary medical care: some examples of the use of geographical information systems," Health & Place, vol. 4, no. 2, pp. 183-193, 1998.
[14] T. T. Nguyen and S. Olapiriyakul, "Optimizing Facility Location Decisions Considering Health Impact on Local Population," Procedia CIRP, vol. 40, no. Supplement C, pp. 289-294, 2016.
[15] M. D. Berg, O. Cheong, M. v. Kreveld and M. Overmars, Computational Geometry-Algorithms and Applications, 3rd ed., Hidelberg: Springer-Verlag, 2003.
[16] J. O'Rourke, Computational Geometry in C, 2nd ed., New York, NY, USA: Cambridge University Press, 1998.