Delivered by Publishing Technology to: Amina Khambalia IP: 58.172.241.239 on: Mon, 09 Apr 2012 02:46:50 Copyright (c) Nevin Scrimshaw International Nutrition Foundation. All rights reserved.
Food and Nutrition Bulletin, vol. 33, no. 1 © 2012, The United Nations University. 31
malnutrition among children in Malaysia
Abstract
Background. For many developing countries undergo-ing rapid economic growth and urbanization, trends in nutritional status indicate a decrease in malnutrition with an associated rise in the prevalence of obesity. An understanding of the situation among children in Malaysia is lacking.
Objective. To examine the prevalence, trends and sociodemographic factors described forunderweight and overweight children in Malaysia.
Methods. The literature from January 1996 to Novem-ber 2010 on the prevalence of underweight and over-weight among children in Malaysia was reviewed.
Results. Twelve studies were identified that reported on both underweight and overweight among children in Malaysia, of which only one was a nationally rep-resentative survey. Based on the National Health and Morbidity Survey in 2006, 13.2% (95% CI, 12.6 to 13.9) of children aged 0 to 18 years were underweight (weight-for-age < –2SD), and 8.0% (95% CI, 7.5 to 8.6) of those aged 0 to 13 years were overweight (weight-for-height > +2SD). Both underweight and overweight were more prevalent in males than females. Children in rural areas were more likely to be underweight and less likely to be overweight than urban children. Ethnic differences between Malays, Chinese, and Indians were inconsistent
across studies and less clear. Aborigines were more likely to be underweight and less likely to be overweight than the general population. The available evidence, although limited and sparse, suggests that over the past decade the prevalence of both underweight and overweight among children in Malaysia has been stable or has shown an increasing trend.
Conclusions. Long-term national monitoring and longitudinal cohort studies will be critical for under-standing, preventing, and managing the double burden of malnutrition among children in Malaysia.
Key words:
Adolescent, children, epidemiology,malnutrition, overweight, undernutrition
Introduction
Globally, the World Health Organization (WHO) esti-mates that 170 million children are underweight and at least 20 million children under 5 years of age are
overweight [1]. In lower- to middle-income countries
in Asia, Africa, the Middle East, and Latin America, large segments of the population face undernutrition and poverty-related diseases, while increasing pro-portions of the population are developing obesity and noncommunicable diseases such as diabetes and coronary problems [2]. The co-occurrence of overnu-trition and undernuovernu-trition is attributed to the “nutri-tion transi“nutri-tion”—a term used to describe shifts in diet, physical activity, health, and nutrition [3]. The
nutri-tion transinutri-tion is characterized by a shift toward more
energy-dense diets and a reduction in physical activity due to higher incomes and the influence of mass media and food marketing [2].
The economic conditions of a country are usually related to changes in diet and physical activity patterns that contribute to obesity and chronic disease [4]. Statistics from several ministries in Malaysia over the past two decades show a rise in the size of food importation bills, reflecting increased intakes of energy,
Amina Z. Khambalia, Siew S. Lim, Tim Gill, and Awang M. Bulgiba
Amina Z. Khambalia is affiliated with Clinical and Population Perinatal Research, Kolling Institute of Medical Research, University of Sydney at Royal North Shore Hospital, Australia; Tim Gill is affiliated with the Boden Institute of Obesity, Nutrition and Exercise, Faculty of Medicine, Uni-versity of Sydney, Australia; Siew S. Lim is affiliated with The Robinson Institute, University of Adelaide, Adelaide, South Australia 5005, Australia; Awang M. Bulgiba is affiliated with Julius Centre University of Malaya, Faculty of Medicine, University of Malaya, Kuala Lumpur, Malaysia.
Delivered by Publishing Technology to: Amina Khambalia IP: 58.172.241.239 on: Mon, 09 Apr 2012 02:46:50 fats, and sugars with increasing population affluence
[5]. Furthermore, there has been an increase in the number of fast-food outlets in Malaysia during the past decade [6]. Data from food balance sheets show increases from 1961 to 1997 in the consumption of calories (from 2,430 to 2,990 kcal/person/day), protein (from 49 to 61 g/person/day), and fat (from 49 to 87 g/person/day) [6]. A summary of the evidence of the nutrition transition in Malaysia also refers to several studies showing low physical activity levels among adolescents and adults [6]. As proxies for increased sedentary lifestyles, the number of motor vehicles increased threefold from 2.3 million in 1980 to 7.6 million in 1997, and ownership of television sets increased from 1.1 million to 2.4 million during the same period [6].
Globalization and urbanization are the major forces underlying the nutrition transition [7]. Over the past three decades, Malaysia has undergone considerable economic growth [8]. Life expectancy, education, income, gross national product, and the rate of urbani-zation have all shown dramatic increases [9]. To date, there has been no systematic summary or appraisal of the situation of underweight and overweight children in Malaysia. Therefore, the aims of the present study were to examine the prevalence, trends and socoi-odemographic factors described for underweight and overweight children in Malaysia.
Methods
Relevant literature from January 1996 through Novem-ber 2010 was identified by a structured search in PubMed, Medline, and Embase. Selection of the study period was based on evidence that Malaysia has under-gone a nutrition transition in the past two decades and the fact that the first national survey to report on the nutritional status of children in Malaysia was conducted in 2006. Combinations and variations of the search terms “Malaysia,” “underweight,” “overweight,” “obesity,” “prevalence,” and “children” were used. Other sources included national reports, the reference lists of included papers, and e-mails to the investigators of included studies requesting further studies not identi-fied in the electronic search. Studies were included if the study setting was in Malaysia and outcome measures included the prevalence of underweight and overweight among children 0 to 18 years of age. Studies were excluded if the study population was selected on the basis of a specific disease or disorder or if the study design was a case–control or case report.
Information on the characteristics of the stud-ies (authors, year, study design, population, sample size, type of measurements, outcome definitions, and results) was extracted from the studies and pre-sented in tables. Units of measurement (e.g., z-scores,
percentiles) and age groups of children varied between studies. Only one nationally representative survey reported a measure of variance (standard deviation or standard error). Given the heterogeneity in age groups and in definitions of underweight and overweight, the data synthesis plan involved grouping studies according to their definitions of underweight and overweight to describe the prevalence and sociodemographic distri-bution (sex, age, ethnicity, and locality) of underweight and overweight children where data were available.
Results
General description of studies
Twelve studies were identified that reported on both underweight and overweight children in Malaysia, of which only one was a nationally representative survey (table 1) [10–24]. Various criteria and standards were used to define nutritional status across the studies (table 1) [25–30]. Among children 0 to 13 years of age, the prevalence of overweight was 5.3% (95% CI, 4.5 to 6.2) when overweight was defined as weight-for-age > +2SD and 8.0% (95% CI, 7.5 to 8.6) when overweight was defined as weight-for-height > +2SD [12]. Less discrepancy between estimates for over-weight children using different methods was found in one of the smaller cross-sectional studies that was conducted a decade earlier in 1996 [20]. Tee et al. found that the prevalence of overweight children aged 7 to 10 years was 8.4% when overweight was defined as weight-for-age > +2SD and 7.7% when overweight was defined as weight-for-height > +2SD [20]. Greater vari-ation between the estimates of overweight prevalence among children found in the Third National Health and Morbidity Survey (NHMS-3) using the different classifications for overweight children may be related to the broader age range (0 to 13 years in NHMS-3 compared with 7 to 10 years in the study of Tee et al.). It is disappointing that the NHMS-3 did not use dif-ferent classifications for overweight children in various age groups [12].
Prevalence of underweight and overweight
The highest-quality data were from a single nationally representative survey. The NHMS-3 conducted in 2006 used z-scores of weight-for-age and found that among children 0 to 18 years of age, 13.2% (95% CI, 12.6 to 13.9) were underweight and 5.4% (95% CI, 5.0 to 5.7)
were overweight (tables 2 and 3) [12]. Estimates from
Delivered by Publishing Technology to: Amina Khambalia IP: 58.172.241.239 on: Mon, 09 Apr 2012 02:46:50 Copyright (c) Nevin Scrimshaw International Nutrition Foundation. All rights reserved.
TAB LE 1. G en era l d es cr ip tio n o f cr os s-s ec tio na l s tu di es r ep or tin g o n t he p re va le nc e o f u nd er w ei gh t a nd o ve rw ei gh t a m on g c hi ld re n a nd a do le sc en ts i n M al ay sia A ut ho r, ye ar St udy o bj ec tiv es St ud y ye ar Stu dy se tti ng A ge (y r) Sa mp le siz e Sam pl ing fr am e an d t ec hn iq ue Re fe re nc e s tan dar d C he
e, 2008 [10]
D et er m in e w eig ht st at us a nd di et ar y in ta ke 2006 Ku al a L um pur 6–17 53 W el fa re ho me ( n = 1) BMI-f or -a ge (CD C, 2006) [25] Fo o, 2006 [11] D et er m in e di et ar y in ta ke s NR Sab ah 12–19 199 Fi sh in g v ill ag es ( n = 6) BMI-f or -a ge ( WH O
, 1995) [29]
M O H, 2008 [12] Th ird N at io na l H ea lth a nd M or bi di ty S ur ve y 2006 Na tio na l 0–18 22,032 2-s ta ge s tra tif ie d s am pl in g p ro po rt io n-at e t o p op ul at io n s iz e W ei gh t-f or -a ge a nd w ei gh t-f or -he ig ht (N CHS/WH O , 1983) [27, 28] M oy , 2004, 2006 [13, 14] D es cr ib e b od y m as s s ta tu s 1994/95 Ku al a L um pur 11–16 3,620 M ul tis ta ge s am pl in g o f p riv at e a nd go ve rn m en t s ch ool s ( n = 29) BMI-f or -a ge ( WH O
, 1995) [29]
M uh am m ad , 2008 [15] D et er m in e p ar en ta l p er cep tio n of c hi ld ’s w ei gh t s ta tu s NR Ku al a L um pur 9–12 204 Pr im ar y s ch ool ( n = 1) BMI-f or -a ge (CD C, 2006 [25]; IO TF
, 2000 [26]
R
am
pa
l, 2003 [17]
D et er m in e n ut rit io na l s ta tu s NR Se lang or (P en ins ul ar M ala ys ia ) 6–10 208 V ill ag e ( n = 1) W ei gh t-f or -a ge (N CHS/WH O , 1983) [27, 28] R am pa
l, 2007 [16]
D et er m in e p re va len ce o f ov er w eig ht 2005 Se lang or (P en ins ul ar M ala ys ia ) 13–17 3,333 R an do m cl us te r o f s ec on da ry sch ool s ( n
= 35) p
ro po rt io na te t o s iz e BMI-f or -a ge a nd -s ex ( WH O , 1995) [29] Sa ib ul
, 2009 [18]
D et er m in e d ua l b ur den o f m al -nu tr iti on am ong O rang A sli 2002–05 Se lang or (P en ins ul ar M ala ys ia ) 2–9 182 H ous eh ol ds ( n
= 339) i
n T em ua n a nd M ahm er i v ill ag es Z-s co re s (N CHS/WH O , 1983) [27, 28] So o, 2008 [19] D et er m in e e at in g b eh av io r, bo dy i m ag e, a nd s el f-e st ee m NR Pen in su la 15–17 489 R an do m ly s el ec te d s ec on da ry s ch oo ls ( n
= 7) a
nd y
ea
r 4 f
em al e s tu de nts ( n = 489) BMI-f or -a ge ( WH O
, 1995) [29]
Te
e, 2002 [20]
D et er m in e n ut rit io na l s ta tu s 1996 Ku al a L um pur 7–10 5,995 R an do m ly s el ec te d e ve ry 10t h c hi ld on m as te r l ist o f s tu de nts. S am pl ed 166 s ch oo
ls (97.6% o
f a ll s ch oo ls a nd 7.8% o f a
ll 7- t
o 10-y r-o ld p ri m ar y sc ho ol ch ildr en in K ua la L um pur ) Z-s co re s (N CHS/WH O , 1983) [27, 28]a nd BMI-f or -a ge (NH ANES-1,1991) [30] Za in
i, 2005 [21]
[image:3.524.29.479.50.695.2]Delivered by Publishing Technology to: Amina Khambalia IP: 58.172.241.239 on: Mon, 09 Apr 2012 02:46:50 school-based settings among primary or secondary
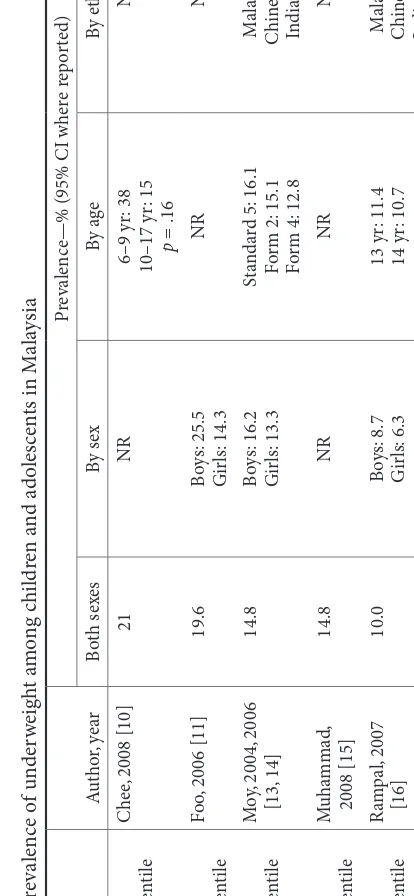
stu-dents (table 1). Prevalence estimates for underweight among both boys and girls were available from 12 stud-ies and ranged from 1.2% to 58.3% (table 2). For boys and girls combined, the prevalence of overweight from 13 studies ranged from 0% in an sample of indigenous Orang Asli children [18] to 27.4% in a sample of pri-mary school students in Kuala Lumpur (table 3) [15]. A limitation of the research studies identified is the use of not only disparate, but sometimes inappropri-ate, methods for defining overweight (table 1). For example, a few studies used weight-for-age to define weight status in children[17, 22]. Although weight-for-age has been the preferred method for defining underweight, its value in defining overweight is limited [31]. The NHMS-3, which contains the most current and representative anthropometric data in children and adolescents in the country, defined overweight status in children using both age and weight-for-height methods [12].
Trends over time
Examining trends proved difficult, for two major rea-sons. First, multiple years of nationally representative data on the nutrition status of children are not available in Malaysia. Second, only 3 of the 13 smaller stud-ies reported the year when the study was performed (table 1). Comparisons between the study year and the publication year indicate that the two cannot be assumed to be equivalent. For example, the study by Tee et al. published in 2002 was conducted in 1996 [20]. Proper reporting of the study year is important to permit examination of trends over time and com-parison of small studies with similar populations (e.g., urban secondary school students). An e-mail was sent to all investigators with an included study in the present review requesting the year that the study was conducted. Additional information was received for two papers.
The limited available evidence suggests a possible increase in the prevalence of underweight among urban children in Malaysia over the past decade. The prevalence was 7.1% when underweight was defined as weight-for-age < –2SD in 1996, 10% when under-weight was defined as body mass index (BMI)-for-age < 5th percentile) in 2005, and 11.4% (95% CI, 10.7 to 12.2) when underweight was defined as weight-for-age < –2SD) in 2006. Similarly, the limited data on overweight children suggest a possible increase among urban children from 7.7% in 1996 (when overweight was defined as weight-for-height > 2SD) to 8.2% (when overweight was defined as BMI-for-age > 95th percentile) in 2005, to 8.8% (95% CI, 8.1 to 9.6) when overweight was defined as weight-for-height > 2SD. Among studies that report the survey year, there
is no clear pattern over time for those with the same TAB
LE 2.
P
re
va
le
nc
e o
f u
nd
er
w
ei
gh
t a
m
on
g c
hi
ld
re
n a
nd a
do
le
sc
en
ts i
n M
al
ay
sia
Cu
to
ff
A
ut
ho
r, ye
ar
Pr
ev
al
en
ce—% (95% CI w
he
re r
ep
or
te
d)
Bo
th
sex
es
By
se
x
By
a
ge
By
e
thnic
ity
By
lo
ca
lit
y
BMI-f
or
-a
ge
< 5t
h p
er
ce
nt
ile
C
he
e, 2008 [10]
21
NR
6–9 y
r: 38
10–17 y
r: 15
p
= .16
NR
NR
BMI-f
or
-a
ge
< 5t
h p
er
ce
nt
ile
Fo
o,
2006 [11]
19.6
Bo
ys:
25.5
G
irl
s: 14.3
NR
NR
NR
BMI-f
or
-a
ge
< 5t
h p
er
ce
nt
ile
M
oy
, 2004,
2006
[13,
14]
14.8
Bo
ys:
16.2
G
irl
s: 13.3
St
an
da
rd 5:
16.1
Fo
rm 2:
15.1
Fo
rm 4:
12.8
M
al
ay
: 15.9
C
hi
ne
se:
10.9
In
di
an:
21.1
NR
BMI-f
or
-a
ge
< 5t
h p
er
ce
nt
ile
M
uha
m
ma
d,
2008 [15]
14.8
NR
NR
NR
NR
BMI-f
or
-a
ge
< 5t
h p
er
ce
nt
ile
R
am
pa
l, 2007
[16]
10.0
Bo
ys:
8.7
G
irl
s: 6.3
13 y
r: 11.4
14 y
r: 10.7
15 y
r: 8.1
16 y
r: 9.3
17 y
r: 10.2
M
al
ay
: 8.7
C
hi
ne
se:
8.4
In
di
an:
17.2
O
th
er
s: 9.1
[image:4.524.254.461.224.672.2]Delivered by Publishing Technology to: Amina Khambalia IP: 58.172.241.239 on: Mon, 09 Apr 2012 02:46:50 Copyright (c) Nevin Scrimshaw International Nutrition Foundation. All rights reserved.
BMI-f or -a ge < 5t h p er ce nt ile Za lil ah, 2006 [23, 24] 11.4 Bo ys: 14.8 G irl s: 7.9 11–12 y r: 11.4 13 y r: 11.9 14–15 y r: 10.6 M al ay : 11.9 C hi ne se: 7.2 In di an: 19.2 U rb an: 10.3 Ru ra l: 12.1 BMI-f or -a ge < 5t h p er ce nt ile So o, 2008 [19] NA Bo ys: NI G irl s: 3.1 NR NR NR
BMI < 16 a
nd
w
ei
gh
t < 20 kg
Za
in
i, 2005 [21]
1.2 Bo ys: 0.7 G irl s: 1.6 NR M al ay : 1.6 C hi nes e: 0 In di an: 0.8 U rb an: 0.9 Ru ra l: 2.2 W ei gh t-f or -a ge < –2S D M O H, 2008 [12] 13.2 (12.6–13.9) Bo ys: 14.5 (13.7–15.3) G irl
s: 12.0 (11.3–12.7)
< 1 y
r: 7.1 (5.7–8.9)
1–3 y
r: 19.8 (18.4–21.3)
4–6 y
r: 16.4 (15.2–17.6)
7–9 y
r: 11.9 (10.8–13.0)
10–13 y
r: 9.2 (8.3–10.1)
14–15 y
r: 10.2 (9.0–11.6)
16–18 y
r: 16.0 (14.3–17.7)
M
al
ay
: 14.3 (13.6–15.0)
C hi ne se: 5.2 (4.4–6.1) In di an: 10.5 (8.8–12.5) O th er b um is: 18.4 (16.6–20.5) a O th er
s: 18.9 (14.7–23.9)
b U rb an: 11.4 (10.7–12.2) Ru ra
l: 16.0 (15.1–17.2)
W ei gh t-f or -a ge < –2S D R am pa l, 2003 [17] 11.1 Bo ys: 13.1 G irl s: 9.2 P > .05 6 y r: 11.9 7 y r: 15.4 8 y r: 8.9 9 y r: 8.7 10 y r: 11.1 p > .05 NR NR W ei gh t-f or -a ge < –2S D Sa ib ul
, 2009 [18]
58.3 NR NR NR NR W ei gh t-f or -a ge < –2S D Za lil ah, 2000 [22] 14.5 Bo ys: 16.6 G irl s: 12.1 NR NR NR W ei gh t-f or -a ge < –2S D Te
e, 2002 [20]
7.1 Bo ys: 7.7 G irl s: 6.4 7 y r: 5.7 8 y r: 6.4 9 y r: 8.0 10 y r: 7.6 NR U rb an: 7.4 Ru ra l: 26.9 c W eig ht -f or -h eig ht < –2S D M O H, 2008 [12] 10.4 (9.8–11.1) Bo ys: 10.6 (9.8–11.5) G irl
s: 10.2 (9.4–11.1)
< 1 y
r: 15.2 (13.1–17.6)
1–3 y
r: 15.1 (13.8–16.5)
4–6 y
r: 9.4 (8.5–10.4)
7–9 y
r: 7.5 (6.6–8.5)
10–13 y
r: 4.5 (3.3–6.0)
M
al
ay
: 10.6 (9.8–11.5)
C hi ne se: 7.4 (6.1–8.9) In di an: 16.8 (14.2–19.8) O th er b um is: 8.9 (7.5–10.5) O th er
s: 12.4 (9.4–16.3)
U rb an: 11.0 (10.2–11.9) Ru ra
l: 9.5 (8.7–10.5)
BMI, b od y m as s i nd ex; CI, c on fid en ce i nt er va l; M O H, M in ist ry o f H ea lth; N A, n ot a pp lic ab le; NI, n ot i nc lu de d; NR , n ot r ep or te d; S D , s ta nd ar d d ev ia tio n a. O th er b um is. (B um is i
s a t
er m w hi ch i nc lu de s t he i nd ig en ou s g ro up s: I ba ns, B id ay uh s, K ad aza ns, M ur uts, P en an s, L um ba w an g, B aj au s, t ho se o f S ia m es e d es ce nt , a nd O ra ng A sli (A bo ri gi ne s). b. O th er s i nc lu de C au ca sia ns, E ura sia ns, P or tu gu es e, a nd a ny on e e lse w ho c an no t b e c la ss ifi ed u nd er a ny o f t he o th er m aj or g ro up s. c. D at a ci te d i n p ap er f ro m WH O
Delivered by Publishing Technology to: Amina Khambalia IP: 58.172.241.239 on: Mon, 09 Apr 2012 02:46:50
TAB
LE 3.
P
re
va
le
nc
e o
f o
ve
rw
ei
gh
t a
m
on
g c
hi
ld
re
n a
nd a
do
le
sc
en
ts i
n M
al
ay
sia
Cu
to
ff
A
ut
ho
r, ye
ar
Pr
ev
al
en
ce—% (95% CI w
he
re r
ep
or
te
d)
Bo
th
sex
es
By
se
x
By
a
ge
By
e
thnic
ity
By
lo
ca
lit
y
BMI-f
or
-a
ge > 95t
h
per
cen
til
e
C
he
e, 2008 [10]
NR
NR
6–9 y
r: 0
10–17 y
r: 5
NR
NR
BMI-f
or
-a
ge > 95t
h
per
cen
til
e
M
oy
, 2004;
2006
[13,
14]
7.3
Bo
ys:
7.5
G
irl
s: 7.1
St
an
da
rd:
10.1
Fo
rm 2:
5.6
Fo
rm 4:
5.7
M
al
ay
: 7.8
C
hi
ne
se:
6.7
In
di
an:
7.0
NR
BMI-f
or
-a
ge > 95t
h
per
cen
til
e
Te
e, 2002 [20]
8.4
Bo
ys:
9.7
G
irl
s: 7.1
7 y
r: 10.3
8 y
r: 9.2
9 y
r: 8.0
10 y
r: 7.0
NR
NR
BMI-f
or
-a
ge > 85t
h
per
cen
til
e
Fo
o,
2006 [11]
4.5
Bo
ys:
6.4
G
irl
s: 2.9
NR
NR
NR
BMI-f
or
-a
ge > 85t
h
per
cen
til
e
M
uha
m
ma
d,
2008 [15]
27.4
NR
NR
NR
NR
BMI-f
or
-a
ge > 85t
h
per
cen
til
e
Za
lil
ah,
2006
[23,
24]
18.3
Bo
ys:
19.7
G
irl
s: 16.7
11–12 y
r: 19.9
13 y
r: 18.6
14–15 y
r: 16.1
M
al
ay
: 17.9
C
hi
ne
se:
18.8
In
di
an:
17.8
U
rb
an:
19.4
Ru
ra
l: 17.3
W
ei
gh
t-f
or
-a
ge >
+2S
D
M
O
H,
2008 [12]
5.4 (5.0–5.7)
Bo
ys:
6.0 (5.6–6.5)
G
irl
s: 4.7 (4.3–5.1)
< 1 y
r: 4.1 (3.1–5.5)
1–3 y
r: 3.2 (2.6–3.9)
4–6 y
r: 6.4 (5.6–7.3)
7–9 y
r: 6.8 (6.0–7.7)
10–13 y
r: 5.9 (5.3–6.7)
14–15 y
r: 4.8 (4.0–5.8)
16–18 y
r: 4.3 (3.4–5.3)
M
al
ay
: 5.0 (4.6–5.5)
C
hi
ne
se:
7.1 (6.1–8.1)
In
di
an:
8.1 (6.7–9.8)
O
th
er b
um
is:
3.7 (2.9–4.6)
a
O
th
er
s: 3.9 (2.5–6.0)
b
U
rb
an:
6.3 (5.8–6.8)
Ru
ra
l: 4.0 (3.5–4.5)
W
ei
gh
t-f
or
-a
ge >
+2S
D
R
am
pa
l, 2003
[17]
5.3
Bo
ys:
6.1
G
irl
s: 4.6
6 y
r: 7.1
7 y
r: 7.7
8 y
r: 4.4
9 y
r: 4.3
10 y
r: 2.8
NR
NR
W
ei
gh
t-f
or
-a
ge >
+2S
D
Sa
ib
ul
, 2009 [18]
0
NR
NR
NR
NR
W
ei
gh
t-f
or
-a
ge >
+2S
D
Za
lil
ah,
2000
[22]
2.7
Bo
ys:
3.1
G
irl
s: 2.3
NR
NR
[image:6.524.35.423.57.677.2]Delivered by Publishing Technology to: Amina Khambalia IP: 58.172.241.239 on: Mon, 09 Apr 2012 02:46:50 Copyright (c) Nevin Scrimshaw International Nutrition Foundation. All rights reserved.
W ei gh t-f or -h ei gh t > +2S D M O H, 2008 [12] 8.0 (7.5–8.6) Bo ys: 9.0 (8.3–9.8) G irl
s: 6.7 (6.0–7.5)
< 1 y
r: 6.2 (4.8–8.0)
1–3 y
r: 5.0 (4.3–5.9)
4–6 y
r: 7.8 (6.9–8.8)
7–9 y
r: 9.8 (8.8–11.0)
10–13 y
r: 14.0 (11.9–16.5)
M
al
ay
: 7.3 (6.7–8.0)
C hi ne se: 10.3 (8.8–12.1) In di an: 8.4 (6.5–10.8) O th er b um is: 8.4 (7.1–10.0) O th er
s: 7.8 (5.5–11.0)
U rb an: 8.8 (8.1–9.6) Ru ra
l: 6.8 (6.0–7.6)
W ei gh t-f or -h ei gh t > +2S D Te
e, 2002 [20]
7.7 Bo ys: 9.5 G irl s: 5.2 NR NR U rb an: 7.7 Ru ra l: 1.9 c A t r isk: BMI-f or -ag e 85t h–95t h per cen til e R am pa l, 2007 [16] 11.4 Bo ys: 13.3 G irl s: 9.7 13 y r: 13.3 14 y r: 12.9 15 y r: 12.6 16 y r: 8.1 17 y r: 9.6 M al ay : 9.8 C hi ne se: 12.0 In di an:13.7 O th er s: 18.2 NR O ve rw ei gh t: BMI-fo r-a
ge > 95t
h per cen til e R am pa l, 2007 [16] 8.2 Bo ys: 10.6 G irl s: 6.0 13 y r: 10.0 14 y r: 7.5 15 y r: 7.6 16 y r: 9.1 17 y r: 6.3 M al ay : 10.7 C hi ne se: 5.9 In di an: 7.1 O th er s: 13.6 NR A t r isk: BMI-f or -ag e 85t h–95t h per cen til e So o, 2008 [19] NA Bo ys: NI G irl s: 9.8 NR NR NR O ve rw ei gh t: BMI-fo r-a
ge > 95t
h per cen til e So o, 2008 [19] NA Bo ys: NI G irl s: 8.6 NR NR NR O ver w eig ht :
19.8 < BMI < 24
Za
in
i, 2005 [21]
16.8 Bo ys: 18.3 G irl s: 14.2 NR M al ay : 14.8 C hi ne se: 23.0 In di an: 16.0 U rb an: 17.6 Ru ra l: 12.0 O bes e:
BMI > 24
Za
in
i, 2005 [21]
6.4 Bo ys: 6.5 G irl s: 5.8 NR M al ay : 7.6 C hi ne se: 1.6 In di an: 5.1 U rb an: 6.5 Ru ra l: 5.4 BMI, b od y m as s i nd ex; CI, c on fid en ce i nt er va l; M O H, M in ist ry o f H ea lth; N A, n ot a pp lic ab le; NI, n ot i nc lu de d; NR , n ot r ep or te d; S D , s ta nd ar d d ev ia tio n a. O th er b um is (B um is i
s a t
Delivered by Publishing Technology to: Amina Khambalia IP: 58.172.241.239 on: Mon, 09 Apr 2012 02:46:50 geographic location; this is probably due to different
classifications of nutritional status. In Kuala Lumpur, the prevalence of underweight among children was 14.8% (BMI-for-age < 5th percentile) in 1994/95 in a survey by Moy et al. [13], 7.1% (weight-for-age < 2SD) in a 1996 survey by Tee et al. [20] and 8.1% (6.3 to 10.4) (weight-for-age < 2SD) in the NHMS-3 survey in 2006 [12]. The prevalence of overweight among children in Kuala Lumpur increased from 7.3% (BMI-for-age > 95th percentile) in 1994/95 [13] to 7.7% (height-for-age > +2SD) in 1996 [20] and to 9.1% (95% CI, 7.2 to 11.4) (weight-for-age > +2SD) in 2006 [12]. In Selan-gor, the prevalence of underweight among children was 10.0% (BMI-for-age < 5th percentile) in 2005 [32] compared with 10.6% (95% CI, 9.4 to 12.0) in 2006 [12]. In Selangor, the prevalence rates of children at risk for overweight (BMI-for-age 85–95th percentile) and overweight (BMI-for-age > 95th percentile) in 2005 were 11.4% and 8.2%, respectively [32]. In 2006, the NHMS-3 survey found that 6.5% (95% CI, 5.6 to 7.5) of children in Selangor were classified as overweight using weight-for-age > +2SD and 10.0% (95% CI, 8.6 to 11.6) using weight-for- height > +2SD) [12].
Sociodemographic characteristics
Sex
Estimates of underweight prevalence among boys were available from nine studies and ranged from 0.7% to 25.5% (table 2). Estimates of underweight prevalence among girls were available from 10 studies and ranged from 1.6% to 14.5%. Prevalence estimates for risk of overweight were available in a single study for boys (13.3%) and two studies for girls (9.7% and 9.8%) (table 3). Estimates of underweight prevalence among boys were available in 10 studies and ranged from 3.1% to 19.7%. For girls, 13 studies reported estimates of overweight prevalence that ranged from 2.3% to 16.7%. Almost all of the studies found a lower prevalence of underweight among girls than among boys (table 2) and a lower prevalence of overweight among girls than among boys (table 3).
Age
Direct comparisons between age groups across the studies were difficult, because the majority of studies included subjects with narrow age ranges or did not examine underweight and overweight status in relation to age. According to the NHMS-3, infants aged 1 to 3 years had the highest rates of underweight (19.8%; 95% CI, 18.4 to 21.3) [12]. Moy et al. reported the highest prevalence of underweight (16.1%) students in the youngest age group (Standard 5 students) compared with Form 2 (15.1%) and Form 4 (12.8%) students [13]. Zalilah et al. reported prevalence rates of underweight among children aged 11 to 12 years, 13 years, and 14 to
15 years as 11.4%, 11.9%, and 10.6%, respectively [23]. According to the NHMS-3 data, the prevalence of overweight among children and adolescents aged 0 to 18 years ranged from 3.2% to 6.8% [12]. The highest estimates for overweight were found among children aged 7 to 9 years (6.8%), 4 to 6 years (6.4%), and 10 to 13 years (5.9%). The lowest prevalence of overweight was found among children aged 1 to 3 years [12]. Among children aged 11 to 16 years, Moy et al. found the youngest age group (Standard 5 students) had the highest prevalence of overweight (10.1%) compared with Form 2 students (5.6%) and Form 4 students (5.7%) [13, 14]. Among students 13 to 17 years of age, Rampal et al. found that overweight prevalence was highest at 13 years of age (10.0%) and significantly decreased with increasing age to 6.3% at 17 years
(p < .0001) [16]. Similarly, Zalilah et al. found the
prevalence of overweight to be 19.9% among children 11 to 12 years of age, 18.6% among children 13 years of age, and 16.1% among children 14 to 15 years of age [23, 24]. Rampal et al. reported prevalence rates of overweight among children 6, 7, 8, 9, and 10 years old of 7.1%, 7.7%, 4.4%, 4.3%, and 2.8%, respectively [17]. Locality
Surveys that reported on urban and rural distributions of underweight children found a higher prevalence of underweight children in rural than in urban areas (table 2). These findings from smaller cross-sectional surveys were confirmed by the national survey in 2006, which reported a higher prevalence of underweight (weight-for-age < –2SD) among rural children (16.0%; 95% CI, 15.1 to 17.2) than among urban children (11.4%; 95% CI, 10.7 to 12.2) (table 2). Rural children were less likely to be overweight than urban children (table 3). The NHMS-3 found that 8.8% (95% CI, 8.1 to 9.6) of urban children were overweight (weight-for-height > +2SD), as compared with 6.8% (95% CI, 6.0 to 7.6) of rural children [12].
Ethnicity
Delivered by Publishing Technology to: Amina Khambalia IP: 58.172.241.239 on: Mon, 09 Apr 2012 02:46:50 Copyright (c) Nevin Scrimshaw International Nutrition Foundation. All rights reserved.
several states in peninsular Malaysia found the highest rate of underweight among Indians (19.2%), followed by Malays (11.9%) and Chinese (7.2%) [23].
According to the NHMS-3 data, Indian children had the highest prevalence of overweight (8.1%; 95% CI, 6.7 to 9.8), followed by Chinese (7.1%; 95% CI, 6.1 to 8.1) and Malays (5.0%; 95% CI, 4.6 to 5.5). In contrast, a number of studies found Malays had the highest prevalence of overweight, with the next high-est prevalence among either Chinese or Indians. Moy et al. found that Malays had the highest prevalence of overweight (7.8%), followed by Chinese (6.7%), and Indians (7.0%) [13, 14]. Rampal et al. found that Malays had the highest prevalence of overweight (10.7%), followed by Indians (7.1%) and Chinese (5.9%) [16].
Zalilah, 2006reported the order of highest to lowest
prevalence rates of overweight to be Indians (19.2%),
Malays (11.9%), andChinese [23, 24]. Zaini et al. found
the highest prevalence of overweight among Chinese (23.0%), followed by Indians (16.0%), and Malays (14.8%). The prevalence rates of obesity followed the reverse order: 7.6% for Malays, 5.1% for Indians, and 1.6% for Chinese [21].
Information on the nutritional status of indigenous populations was only reported in two surveys, the NHMS-3 in 2006 [12] and a study by Saibul et al. in 2002 to 2005, which examined a community of Orang Asli children [18]. Both surveys reported markedly higher rates of underweight and lower rates of over-weight among children than among the general popula-tion (tables 2 and 3). Among Orang Asli children, the prevalence of underweight was 58.3%, and none of the children were overweight [18]. In the NHMS-3 survey,
Orang Asli (Aborigines)were included in the category
“other bumis,” Bumis is a term which includes the indigenous groups Ibans, Bidayuhs, Kadazans, Muruts, Penans, Lumbawang, Bajaus, those of Siamese descent,
and Orang Asli (Aborigines).Orang Asli were found
to have an underweight prevalence of 18.4% (95% CI, 16.6 to 20.5) using weight-for-age (< –2SD) and 8.9% (95% CI, 7.5 to 10.5) using weight-for-height (< –2SD) (table 2). The prevalence of overweight children in the NHMS-3 survey under the category “other bumis” was 3.7% (95% CI, 2.9 to 4.6) based on weight-for-age (> +2SD) and 8.4% (95% CI, 7.1 to 10.0) using weight-for-height (> +2SD) (table 3).
Discussion
To our knowledge, this is the first review to critically summarize the prevalence, trends, and sociodemo-graphic distribution of both underweight and over-weight among children in Malaysia. Based on the most recent and representative estimates available, the prevalence of underweight is higher than that of
overweight (13.2% vs. 8.0%) [12]; however, both types of malnutrition are present and indicate a serious public health problem. Recent observations in coun-tries undergoing rapid economic development, such as Brazil, China, South Africa, and parts of the former Soviet Union, indicate that undernutrition and food insecurity continue to be prevalent, while at the same time, the prevalence rates of overweight and chronic metabolic diseases are on the rise [33]. Unlike some other developing countries undergoing rapid economic growth and urbanization, overall trends in the nutri-tional status of children in Malaysia do not indicate a decrease in underweight with an associated rise in the prevalence of obesity. Rather, the available evidence, although limited (based only on cross-sectional data) and sparse, suggests that over the past decade the rates of both underweight and overweight among children in Malaysia have been stable or have increased. An increase in the prevalence of both underweight and overweight suggests a potential increase in food inse-curity and a widening of the gap between affluent and poor segments of the population [34]. There is evidence that the ratio of wealth between the richest and the poorest strata is an important determinant of differing rates of diseases within societies [34]. In countries in early transition, the poor and rural populations con-tinue to suffer from undernutrition, while the affluent, often urban, minority is increasingly affected by the epidemic of noncommunicable diseases [34].
Delivered by Publishing Technology to: Amina Khambalia IP: 58.172.241.239 on: Mon, 09 Apr 2012 02:46:50 have been conducted in Peninsular Malaysia in either
the state of Selangor or the federal territory of Kuala Lumpur. Further research is needed in East Malaysia (Borneo), which has different cultural, ethnic, and environmental factors affecting childhood nutritional status. Differences between ethnic groups in the prevalence of underweight and overweight can be due to a variety of factors. Among adult Malaysians, the Malaysia Non-Communicable Disease Surveillance-1 found that age, education, income, family history of illness, and smoking status were significantly associated with body weight across ethnic groups [37].
As future efforts continue to collect population surveillance data on the nutritional status of children in Malaysia, health researchers need to agree on a standardized definition of underweight and overweight among children for within-country comparisons. To address the need for a more international reference group and a less arbitrary cutoff point, Cole et al. ana-lyzed large, nationally representative cross-sectional surveys from six countries to provide cutoff points for BMI in children 2 to 18 years of age and linked these to the widely accepted adult BMI cutoff points
of 25 and 30 kg/m2 [26]. WHO released new growth
standards for children 0 to 60 months of age in 2006 and for children 5 to 19 years of age in 2007 that allow calculation of height-for- age, weight-for-age, and BMI-for-age, as well as assessment of other anthropometric indicators [1, 38]. These standards allow the calculation of overweight and obesity in children 0 to 60 months of age (BMI-for-age z-score > 2 for overweight and > 3 for obesity) and in children 5 to 19 years of age (BMI-for-age z-score > 1 for overweight and > 2 for obesity) [1, 38].
In addition to large national surveys, smaller sur-veys provide valuable in-depth information about risk factors and outcomes of poor nutritional status. Smaller studies need to employ strong methodologic techniques, such as random sampling to ensure the representativeness of samples, clear reporting of the year of data collection for time trend comparisons across studies, and the use of more current standard-ized definitions for underweight and overweight. More work is needed to try to understand the distribution of underweight and overnutrition, such as the clustering of underweight and overweight children in the same household and the co-occurrence of malnutrition disorders (e.g., stunting and obesity) in the same child.
The presence of underweight and overweight people within the same household (the so-called dual-burden household) is a relatively new phenomenon; its emer-gence is a result of the nutrition transition under way in developing countries that are becoming more
prosperous and urbanized [39]. The sparse literature on dual-burden households has found the coexist-ence of child stunting and maternal overweight in the same household in developing countries undergoing a rapid nutrition transition [40, 41]. The phenomenon is reportedly less common in Africa than in Latin America or Asia [41]. A study in Africa found that dual-burden households shared several socioeconomic characteristics with households having members with protein–energy malnutrition and that food diversity appeared to be significantly associated with a lower likelihood of dual-burden status [41]. A study in Thailand found that overweight mothers with wasted children controlled their children’s food intake and that wasted children consumed snacks more frequently but had lower energy intakes than children of normal weight [42].The dual-burden household poses a sig-nificant challenge for nutrition interventions, since programs targeted at underweight individuals may conflict with those targeted at the overweight [4].
As Malaysia continues to experience factors attrib-uted to the nutrition transition, such as urbanization, sedentary lifestyles, and the liberalization of mar-kets, the prevalence of overweight among children is expected to increase [43]. A critical issue in manag-ing malnutrition is recognizmanag-ing that underweight children are usually stunted. In Malaysia, the national prevalence of stunting among children (height-for-age < –2SD) in 2006 was 15.8% (95% CI, 15.1 to 16.6) [12]. Malnourished children who are underweight and stunted may gain significantly more weight-for-age than length-for-weight-for-age. Stunting (growth retardation resulting from chronic undernutrition) has been asso-ciated with obesity later in life in several transitional countries, such as China, South Africa, and Brazil [44]. The combined objective of promoting child growth and preventing obesity is a major challenge to nutrition programs. If protein–energy malnutrition prevention programs are targeted on the basis of low weight-for-age, children with length deficits may become obese (high weight-for-length) while remaining underweight. Therefore, prevention programs need to include moni-toring that will identify stunted overweight children.
Acknowledgments
Delivered by Publishing Technology to: Amina Khambalia IP: 58.172.241.239 on: Mon, 09 Apr 2012 02:46:50 Copyright (c) Nevin Scrimshaw International Nutrition Foundation. All rights reserved.
References
1. World Health Organization. WHO child growth stand-ards. Background chapter 4. Geneva: WHO. Avail-able at: http://www.who.int/nutrition/media_page/ backgrounders_4_en.pdf. Accessed 5 December 2011. 2. Popkin B. Urbanization and the nutrition transition.
Washington, DC: International Food Policy Research Institute, 2000. Available at: http://www.ifpri.org/publi-cation/urbanization-and-nutrition-transition. Accessed 16 November 2011.
3. Popkin B. Nutritional patterns and transitions. Popul Dev Rev 1993;19:138–57.
4. Doak C, Adair LS, Bentley M, Monteiro C, Popkin BM. The dual burden household and the nutrition transition paradox. Int J Obes 2005;29:129–36.
5. Ismail M, Chee SS, Nawawi H, Yusoff K, Lim TO, James WPT. Obesity in Malaysia. Obes Rev 2002;3:203–8. 6. Ismail M. The nutrition and health transition in
Malay-sia. Public Health Nutr 2002;5:191–5.
7. Popkin B. Global nutrition dynamics: the world is shift-ing rapidly toward a diet linked with noncommunicable diseases. Am J Clin Nutr 2006;84:289–98.
8. Hopkins S. Economic stability and health status: evi-dence from East Asia before and after the 1990s eco-nomic crisis. Health Policy 2006;75:347–57.
9. Noor M. The nutrition and health transition in Malaysia. Public Health Nutr 2002;5:191–5.
10. Chee Y, Yap R, Sabariah S. Weight status and dietary intake among female children and adolescents aged 6–17 years in a welfare home, Kuala Lumpur. Malaysian J of Nutr 2008;14:79–89.
11. Foo L, Khor GL, Tee ES, Dhanaraj P. Dietary intake of adolescents in a rural fishing community in Tuaran District, Sabah. Malays J Nutr 2006;12:11–21.
12. Ministry of Health, Malaysia. The Third National Health and Morbidity Survey, 2006. Kuala Lumpur: Institute for Public Health, National Institutes of Health, Ministry of Health, Malaysia, 2008.
13. Moy F, Gan CY, Zaleha MK. Body mass status of school children and adolescents in Kuala Lumpur, Malaysia. Asia Pac J Clin Nutr 2004;13:324–329.
14. Moy M, Ying GC, Zaleha S, Kassim M. Eating patterns of school children and adolescents in Kuala Lumpur. Malays J Nutr 2006;12:1–10.
15. Muhammad N, Omar K, Shah SA, Muthupalaniappen L, Arshad F. Parental perception of their children’s weight status, and its association with their nutrition and obe-sity knowledge. Asia Pac J Clin Nutr 2008;17:597–602. 16. Rampal G, Sidik SM, Rampal S, Yi Jie DW, Lee CP, Shya
LJ, Shun SY. Prevalence of overweight among second-ary school students in Klang District, Selangor. Malays J Nutr 2007;13:1–8.
17. Rampal L, Wong CH. The nutritional status of malay children in Kampung Jenderam Hilir, Sepang District, Selangor. Malays J Pub Health Med 2003;3:14–18. 18. Saibul N, Shariff ZM, Khor GL, Kandiah M, Ghani
NA, Rahman HA. Food variety score is associated with dual burden of malnutrition in Orang Asli (Malaysian indigenous peoples households: implications for health promotion. Asia Pac J Clin Nutr 2009;18:412–22. 19. Soo K, Shariff ZM, Taib MNM. Eating behaviour, body
image, and self-esteem of adolescent girls in Malaysia. Percept Mot Skills 2008;106:833–844.
20. Tee E, Khor SC, Ooi HE, Young SI, Zakiyah O, Zulkafli H. Regional study of nutritional status of urban primary school children, Kuala Lumpur, Malaysia. Food Nutr Bull 2002;23:41–47.
21. Zaini A, Lim CT, Low WY, Harum F. Factors affecting nutritional status of Malaysian primary school children. Asia Pac J Public Health 2005;17:71–80.
22. Zalilah S, Bond JT, Johnson NE. Nutritional status of primary school children from low income households in Kuala Lumpur. Malays J Nutr 2000;6:17–32. 23. Zalilah S, Mirnalini K, Khor GL, Merlin A, Bahaman
AS, Norimah K. Estimates and distribution of body mass index in a sample of Malaysian adolescents. Med J Malaysia 2006;61:48–58.
24. Zalilah S, Khor GL, Mirnalini K, Norimah AK, Ang M. Dietary intake, physical activity and energy expenditure of Malaysian adolescents. Singapore Med J 2006;47:491–97. 25. CDC, About BMI for children and teens: Centers for
Dis-eases Control and Prevention. Available at: http://www. cdc.gov/healthyweight/assessing/bmi/childrens_bmi/ about_childrens_bmi.html. Accessed 16 November 2011. 26. Cole T, Bellizi MC, Flegal KM, Dietz WH. Establishing
a standard definition for child overweight and obesity worldwide: international survey. BMJ 2000;320:1–6. 27. NCHS, United States Public Health Service, Health
Resources Administration NCHS Growth Charts. HR 76-1120, 25, 3: Rockville, MD, USA, 1976.
28. WHO. Measuring change in nutritional status guidelines for assessing the nutritional impact of supplementary feeding programmes for vulnerable groups. Geneva, World Health Organization: Albany, N.Y. WHO Publica-tions Centre USA, 1983.
29. WHO. Physical status: The use and interpretation of anthropometry. Report of a WHO Expert Committee. WHO Technical Report Series 854. ISBN-10 9241208546. WHO Publications Centre USA, 1995.
30. Must A, Dallal GE, Dietz WH. Reference data for obesity: 85th and 95th percentile body mass index (wt/ ht2) and triceps skinfold thickness. Am. J. Clin. Nutr
1991;53:839–46.
31. de Onis M. The use of anthropometry in the preven-tion of childhood overweight and obesity. Int J Obes 2004;28:S81–85.
32. Rampal L, Rampal S, Khor GL, Zain AM, Ooyub SB, Rahmat RB, Ghani SN, Krishnan J. A national study on the prevalence of obesity among 16, 127 Malaysians. Asia Pac J Clin Nutr 2007;16:561–66.
33. Popkin B, Doak CM. The obesity epidemic is a world-wide phenomenon. Nutr Rev 1998;56:106–14. 34. Darnton-Hill I, Coyne ET. Feast and famine:
socioeco-nomic disparities in global nutrition and health. Public Health Nutr 1997;1:23–31.
35. Stephenson L, Latham MC, Ottesen EA. Global malnu-trition. Parasitology 2000;121:S5–22.
Delivered by Publishing Technology to: Amina Khambalia IP: 58.172.241.239 on: Mon, 09 Apr 2012 02:46:50 37. Tan A, Yen ST, Feisul MI. Determinants of body weight
status in Malaysia: an ethnic comparison. Int J Public Health. Published online: DOI 10.1007/s00038-011-0238-82011. 38. WHO growth reference data for 5–19 years. Geneva: World
Health Organization, 2007. Available at: http://www.who. int/growthref/en/. Accessed 16 November 2011.
39. Khan M. The dual burden of overweight and underweight in developing countries. Population Reference Bureau, 2006. Available at: http://www.prb.org/Articles/2006/ TheDualBurdenofOverweightandUnderweightinDevel-opingCountries.aspx. Accessed 4 January 2012. 40. Deleuze Ntandou Bouzitou G, Fayomi B, Delisle H. Child
malnutrition and maternal overweight in same house-holds in poor urban areas of Benin. Sante 2005;15:263–70.
41. Garrett J, Ruel M. Stunted child–overweight mother pairs: an emerging policy concern? 17th International Congress of Nutrition. Ann Nutr Metab 2001;45:404.
42. Yamborisut U, Kosulwat V, Chittchang U, Wimonpeerapat-tana W, Suthutvoravut U. Factors associated with dual form of malnutrition in school children in Nakhon Pathom and Bangkok. J Med Assoc Thai 2006;89:1012–23.
43. Popkin B. The nutrition transition in the developing world. Dev Policy Rev 2003;21:581–97.