Data Management for Integrated Supply
Chains in Construction
Beaumont, Wes and Underwood, J
Title
Data Management for Integrated Supply Chains in Construction
Authors
Beaumont, Wes and Underwood, J
Type
Book Section
URL
This version is available at: http://usir.salford.ac.uk/38519/
Published Date
2015
USIR is a digital collection of the research output of the University of Salford. Where copyright
permits, full text material held in the repository is made freely available online and can be read,
downloaded and copied for noncommercial private study or research purposes. Please check the
manuscript for any further copyright restrictions.
For more information, including our policy and submission procedure, please
06
Data
management
for integrated
supply chains in
construction
wes BeauMoNt and JasoN uNderwood
Introduction
In a 1962 report Sir Harold Emmerson, referring to the construction industry, commented: ‘In no other important industry in the world is the responsibility for design so far removed from the responsibility for production’ ( Emmerson, 1962 ). Whilst it is true that this gap has been reduced, there still remains a lack of integration between stakeholders, particularly within the wider supply chain.
The industry is fragmented and adversarial, limiting the potential for integrated teams with open communication and information exchange. However, collaboration is essential in achieving maximum value and, despite advances in technology with the use of web collaboration tools, the level of integration among stakeholders is still low. Additionally, current practices in information are linear and sequential, limiting the ability to add value in the early stages of projects.
However, while the transformation to level two BIM develops the capabilities for the digital procurement of assets, level three (Digital Built Britain Strategy) further serves to facilitate deriving ‘value’ through big data and the ‘smarter’ life-cycle management of the built environment. Thereby, the ‘smarter’ life-cycle management of the built environment is enabled through digital procurement, which is based on a data-driven approach that embraces the capital delivery and operational management of assets along with performance management across assets, sectors and society/ies. In ad-dition, level three BIM will form the basis for level four BIM whereby the focus of deriving value extends to societal outcomes and well-being.
Information management in construction
The success of a construction project is largely determined by the effectiveness of processes, the explicitness of obligations and the capability of stakeholders to communicate a shared understanding. Despite this, current processes encourage silo mentalities in which each stakeholder performs its task in isolation, encouraging local optimization and causing detrimental effects to supply chain performance. Sequential processes create reciprocal workflows (Eastman et al, 2011), which is exacerbated when changes or variations occur. As design is an iterative process the industry must make allowances for concurrent working, currently limited by existing procurement strategies. Reciprocal workflow is counterproductive and introduces waste (Womack and Jones, 2003), which reduces value. Ballard and Howell (2003) identified that up to 50 per cent of design time is waste due to this process. Additionally, in general, procurement strategies inhibit early involvement of the supply chain, reducing the impact they can have on early stages of the product life cycle, where maximum value can be generated.
Project complexity
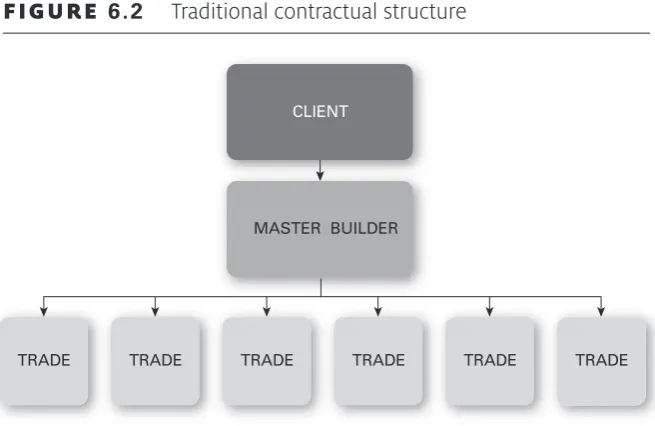
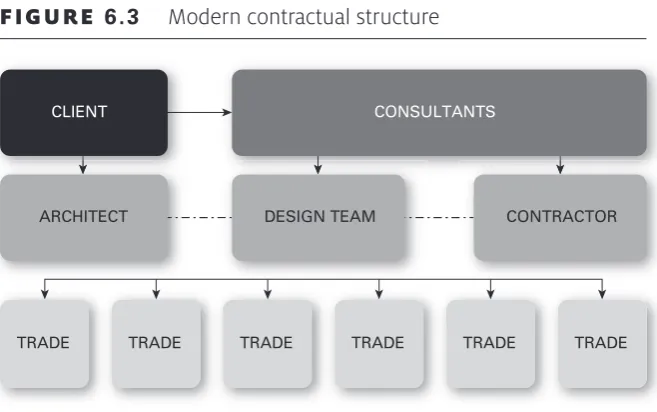
Figures 6.2 and 6.3 illustrate a comparison between traditional and modern contractual structures and the evolution of stakeholder relationships. Unbroken lines indicate contractual relationships and broken lines non-contractual relationships. The modern structure represents a chaotic and risky relation-ship structure in comparison to the much simplified master builder concept.
figure
6.1Project complexity
Project Complexity
Stakeholders Uncertainty
Number Interdependence Methods Goals
SOuRCE: Williams (1999)
figure
6.2Traditional contractual structure
CLIENT
figure
6.3Modern contractual structure
CLIENT
TRADE TRADE TRADE TRADE TRADE TRADE ARCHITECT
CONSULTANTS
CONTRACTOR DESIGN TEAM
The construction supply chain accounted for £124 billion of intermediate consumption in 2011 (BIS, 2013), representing a huge portion of workload. This illustrates the sheer number of organizations participating in the sector, increasing the number of contractual and non-contractual relationships required. When the wider supply chain is considered in contractual and non-contractual structures the complexity increases significantly.
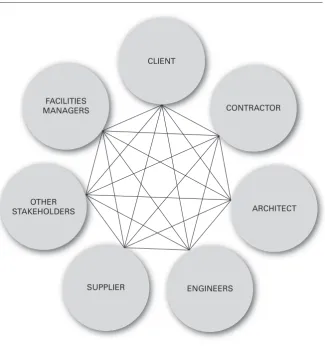
Winch (1989) observed that the firms forming construction projects are bound together by flows of information and materials. The modern relation-ship structure hinders this flow and makes information distribution difficult and somewhat risky. To put this into context, research carried out for BIS (BIS, 2013) identified that on a typical medium-size construction project, in the £20 million to £25 million range, the main contractor may be directly managing around 70 subcontracts.
Information distribution
figure
6.4Traditional relationship process
CLIENT
CONTRACTOR
ARCHITECT
ENGINEERS SUPPLIER
OTHER STAKEHOLDERS
FACILITIES MANAGERS
Building information modelling (BIM)
virtue of its nature, the BIM methodology is underpinned by participative and collaborative working, with buy-in required from all stakeholder par-ticipants from their earliest involvement.
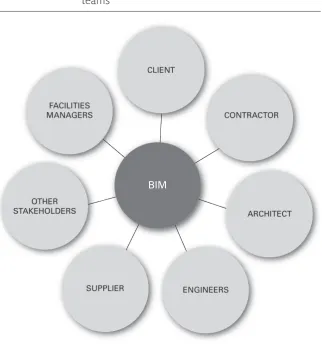
BIM and the integration it demands can eliminate the gap between design and construction and provide a holistic approach to information exchange enabling information to be pulled from a shared central location, as demon-strated in Figure 6.5.
[image:7.501.90.413.101.449.2]The mandate of BIM maturity ‘level two’ is an attempt to move the industry to a digital, rather than analogue, sector and requires project and asset information, documentation and data to be electronic (HM Gov, 2011). PAS 1192–2: 2013 is the framework for implementing BIM ‘level two’ and enables information ‘to be shared efficiently and accurately between all members of the project team’. This is enabled through a common data environment (CDE), essentially a web collaboration tool utilizing cloud computing. Data
figure
6.5Relationships process utilizing BIM and integrated
teams
CLIENT
BIM
CONTRACTOR
ARCHITECT
ENGINEERS SUPPLIER
OTHER STAKEHOLDERS
created during design and construction can be used during the operation for an asset and for wider socioeconomic benefits and aid the creation of ‘smart cities’. The importance of the information economy has already been discussed in the UK government’s recently published information economy strategy. Whilst not defined explicitly, at the time of print, the strategy for level two could be compared to the activity of creating structured data, whilst level three is the strategy for using that structured data for a number of purposes. More is discussed later in this chapter.
Digital technologies, cloud computing and the breakdown of contracts that restrict collaboration will facilitate the adoption of lean processes in the design and construction of projects, reducing inherent waste and eliminating the problems currently associated with design and construction. Training and upskilling of supply chains will allow fully collaborative BIM to become reality, in which all stakeholders input into a BIM and form part of an integrated process, enhancing certainty of delivery. Further advances in technology will not just improve 3D design but bring augmented reality, ubiquitous work spaces and the internet of things to the mainstream, further improving communication lines with the supply chain.
Information, robust processes and people are important in driving value by developing the understanding and capabilities for the life-cycle manage-ment of the built environmanage-ment enabled through collaborative and digital procurement strategies. Furthermore, the need to share information trans-parently becomes paramount in enabling such strategies, together with an understanding and integration of the associated knowledge domains that are important for the life-cycle management of the built environment and facilitating robust processes for improving decision-making practices. This is underpinned by data-driven strategies in the built environment.
Value proposition of BIM and data-driven management
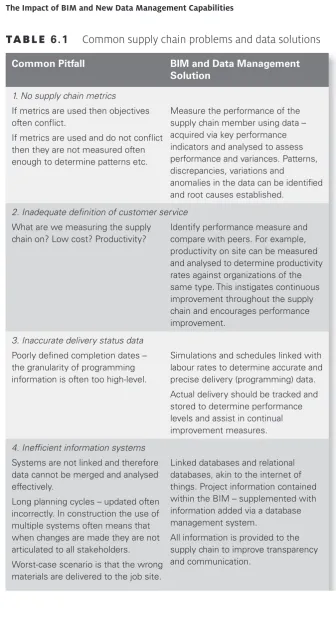
Whilst ‘small data’ is still very important, comprising of lists of customers, sales, employees and so forth, the integration of all data in a ‘single customer view’ enables greater analytical interrogation. Data regarding an asset, created using BIM, can be used during the operation and maintenance of a building, where the majority of whole life costs are borne. In this instance the operational supply chain also benefits. Some of the common pitfalls in supply chain management (Lee and Billington, 1992) and a proposed BIM and data management solution are illustrated in Table 6.1.
Common Pitfall BIM and Data Management Solution
1. No supply chain metrics
If metrics are used then objectives often confl ict.
If metrics are used and do not confl ict then they are not measured often enough to determine patterns etc.
Measure the performance of the supply chain member using data – acquired via key performance indicators and analysed to assess performance and variances. Patterns, discrepancies, variations and
anomalies in the data can be identifi ed and root causes established.
2. Inadequate defi nition of customer service What are we measuring the supply
chain on? Low cost? Productivity?
Identify performance measure and compare with peers. For example, productivity on site can be measured and analysed to determine productivity rates against organizations of the same type. This instigates continuous improvement throughout the supply chain and encourages performance improvement.
3. Inaccurate delivery status data Poorly defi ned completion dates – the granularity of programming information is often too high-level.
Simulations and schedules linked with labour rates to determine accurate and precise delivery (programming) data. Actual delivery should be tracked and stored to determine performance levels and assist in continual improvement measures.
4. Ineffi cient information systems Systems are not linked and therefore data cannot be merged and analysed effectively.
Long planning cycles – updated often incorrectly. In construction the use of multiple systems often means that when changes are made they are not articulated to all stakeholders. Worst-case scenario is that the wrong materials are delivered to the job site.
Linked databases and relational databases, akin to the internet of things. Project information contained within the BIM – supplemented with information added via a database management system.
All information is provided to the supply chain to improve transparency and communication.
[image:9.501.82.419.50.672.2]taBLe
6.1continued
Common Pitfall BIM and Data Management
Solution
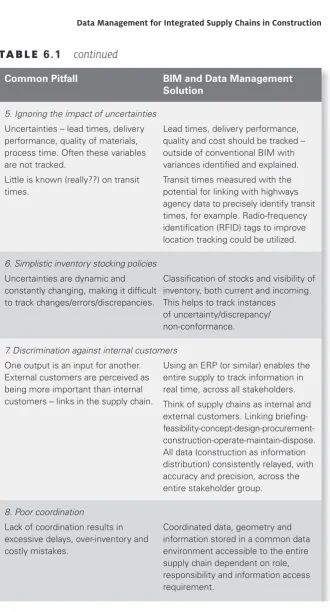
5. Ignoring the impact of uncertainties Uncertainties – lead times, delivery performance, quality of materials, process time. Often these variables are not tracked.
Little is known (really??) on transit times.
Lead times, delivery performance, quality and cost should be tracked – outside of conventional BIM with variances identifi ed and explained. Transit times measured with the potential for linking with highways agency data to precisely identify transit times, for example. Radio-frequency identifi cation (RFID) tags to improve location tracking could be utilized.
6. Simplistic inventory stocking policies Uncertainties are dynamic and constantly changing, making it diffi cult to track changes/errors/discrepancies.
Classifi cation of stocks and visibility of inventory, both current and incoming. This helps to track instances
of uncertainty/discrepancy/ non-conformance.
7. Discrimination against internal customers
One output is an input for another. External customers are perceived as being more important than internal customers – links in the supply chain.
Using an ERP (or similar) enables the entire supply to track information in real time, across all stakeholders. Think of supply chains as internal and external customers. Linking briefi ng- feasibility-concept-design-procurement-construction-operate-maintain-dispose. All data (construction as information distribution) consistently relayed, with accuracy and precision, across the entire stakeholder group.
8. Poor coordination
Lack of coordination results in excessive delays, over-inventory and costly mistakes.
[image:10.501.91.422.35.648.2]taBLe
6.1continued
Common Pitfall BIM and Data Management
Solution
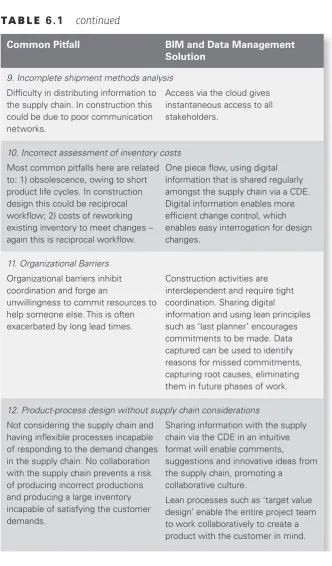
9. Incomplete shipment methods analysis Diffi culty in distributing information to the supply chain. In construction this could be due to poor communication networks.
Access via the cloud gives instantaneous access to all stakeholders.
10. Incorrect assessment of inventory costs Most common pitfalls here are related to: 1) obsolescence, owing to short product life cycles. In construction design this could be reciprocal workfl ow; 2) costs of reworking existing inventory to meet changes – again this is reciprocal workfl ow.
One piece fl ow, using digital information that is shared regularly amongst the supply chain via a CDE. Digital information enables more effi cient change control, which enables easy interrogation for design changes.
11. Organizational Barriers Organizational barriers inhibit coordination and forge an
unwillingness to commit resources to help someone else. This is often exacerbated by long lead times.
Construction activities are interdependent and require tight coordination. Sharing digital
information and using lean principles such as ‘last planner’ encourages commitments to be made. Data captured can be used to identify reasons for missed commitments, capturing root causes, eliminating them in future phases of work.
12. Product-process design without supply chain considerations Not considering the supply chain and
having infl exible processes incapable of responding to the demand changes in the supply chain. No collaboration with the supply chain prevents a risk of producing incorrect productions and producing a large inventory incapable of satisfying the customer demands.
Sharing information with the supply chain via the CDE in an intuitive format will enable comments, suggestions and innovative ideas from the supply chain, promoting a
collaborative culture.
[image:11.501.87.420.69.636.2]Synchronization and concurrent workfl ows
As information passes through layers in the supply chain it gets distorted, but the one-step process of acquiring information at its point of origin and storing it in a central database reduces the chance for it to be corrupted (Thomsen et al , 2009). Furthermore, using digital technology and CDEs allows concurrent working to take place. Deutsch (2011 ) identifi ed how information fl ow can become near instantaneous, and automated workfl ows ensure that the correct people have access to the correct information at all times and removes opportunities for misinterpretation.
The use of BIM and model components with parametric properties ensures that when changes are made to a component all associated documents are simultaneously changed. This synchronization ensures that all stakeholders are working to the same information, in unison, and eliminates the risk of stakeholders using data that has been superseded. It also signifi cantly reduces redrafting time, which adds no value to the process, increasing lean credentials.
Synchronization and concurrent working is facilitated by the use of data-driven strategies and the use of ‘big data’. According to recent research ( BARC, 2013 ) only 14 per cent of European companies already address big data analytics as part of their strategic planning. However, almost half of
taBLe
6.1continued
Common Pitfall BIM and Data Management
Solution
13. Separation of supply chain design from operational decision Decisions made without
considerations of inventory, response times and interdependencies.
BIM is linked with ‘soft landings’ and facilities/asset management to provide the seamless integration between design, construction and operations.
14. Incomplete supply chain Not considering the entire supply chain has negative operational impacts and adds ineffi ciencies. This can lead to variances, which can lead to delays and poor value creation, adding waste.
these companies expect a yearly data growth in their organization of more than 25 per cent, and 60 per cent are planning to invest in big data analytics by 2020 – to improve operational efficiency, customer experiences and present new business models.
Big data and construction
Today, ubiquitous computing such as mobile devices, tablets, smartphones, sensors, etc are significantly changing our world and the quantity of data being produced is exploding. The global data volume is increasing at the rate of twice every 18 months to two years, which is predicted to hit 20 exabytes by 2020 (one exabyte represents 1 million gigabytes). Combining data from different sources holds huge potential for the life-cycle manage-ment of the built environmanage-ment, including the managemanage-ment of the integrated supply chain; however, how to find, process and then exploit the vast volume of data in order to derive real value presents the challenge, ie ‘big data’.
What is big data?
We are currently early in the ‘Age of Big Data’, which is considered the ‘new’ business and social-science frontier. In essence, big data is advancing trends in technology that provide the opportunity for a new business approach to understanding the world and making decisions. The amount of information and knowledge that can be extracted from the digital universe is continuing to expand as users come up with new ways to create and process data. According to Kaisler et al (2013) big data traditionally referred to the volume of data that could not be processed efficiently by traditional database methods and tools. While the original definition focused on structured data, most of the world’s information resides in massive, unstructured information. Moreover, while the creation and collection of data, information and knowledge continues to increase, this explosion exceeds the capacity of traditional data management technologies, which has not been accompanied by a corre-sponding new storage medium.
Kaisler et al (2013) define big data as: ‘the amount of data just beyond technology’s capability to store, manage and process efficiently and these limitations are only discovered by a robust analysis of the data itself, explicit processing needs, and the capabilities of the tools (hardware, software, and methods) used to analyse it’.
Similarly, Dumbill (2013) defines big data as: ‘being data that exceeds the processing capacity of conventional database systems. The data is too big, moves too fast, or doesn’t fit the strictures of your database architectures. To gain value from this data, you must choose an alternative way to process it.’
Value proposition of big data
For governments, big data is considered as a national challenge and priority along with health care and national security. In particular, the concern for governments is on how big data creates ‘value’ – and it is the ability to analyse data in order to develop information that is actionable from which value can be derived (Kaisler et al, 2013). Furthermore, Kaisler et al (2013) propose five generic ways in which value creation for organizations can be supported through big data:
1 Making big data openly available for business and functional analysis (quality, lower costs, reduce time to market, etc) creates transparency.
2 Supporting experimental analysis in individual locations that can test decisions or approaches, such as specific market programmes.
3 Assisting in defining market segmentation at more narrow levels based on customer information.
4 Sophisticated analytics applied to data sets from customers and embedded sensors facilitates real-time analysis and decisions.
5 Facilitating computer-assisted innovation in products based on embedded product sensors indicating customer responses.
A World Economic Forum report, ‘Big Data, Big Impact’, declared data to be a new class of economic asset, similar to currency or gold. Moreover, big data may well become a new type of corporate asset that provides a key basis for competitive advantage. A study of 330 public US organizations found that they performed better on objective measures of financial and operational results the more they characterized themselves as data-driven. In particular, those organizations in the top one-third of their industry, in adopting ‘data-driven decision making’, were 5 per cent more productive and 6 per cent more profitable than their competitors (McAfee and Brynjolfsson, 2012).
Combining domain expertise with data science will facilitate organiza-tions in gaining competitive advantage.
What characterizes big data?
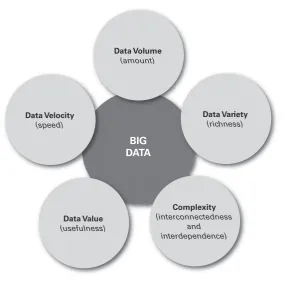
While big data may be considered as simply being only about data volume or another way of saying ‘analytics’ aimed at deriving intelligence from data and translating that into business advantage, there are several key characteristic differences (Figure 6.6) (Kaisler et al, 2013; McAfee and Brynjolfsson, 2012; Russom, 2011):
● Data volume: measures the amount of data available to an organization,
● Data velocity: measures the speed of data creation, streaming and
aggregation. The speed of data creation can be much more important than the volume for some applications, whereby an organization can increase their agility in relation to their competitors through real-time or close to real-time information. Therefore the management of data velocity goes beyond a bandwidth issue to also that of a consumption issue (extract–transform–load).
● Data variety: a measure of the richness of the data representation,
ie text, images, video, audio, etc. The most important sources of big data are relatively new and in many instances ubiquitous, eg social media, smartphones, mobile devices etc. Therefore incompatible data formats, non-aligned data structures and inconsistent data semantics represent significant challenges to effectively using large volumes of data, which can lead to analytic sprawl.
● Data value: measures the usefulness of data in making decisions.
[image:15.501.109.395.103.385.2]‘Data science’ is exploratory and useful in getting to know the data, in contrast to ‘analytic science’, which encompasses the predictive power of big data. Thus, ‘the purpose of computing is insight, not numbers!’
figure
6.6Key characteristics of big data
Complexity
(interconnectedness and interdependence)
Data Variety
(richness)
Data Volume
(amount)
Data Velocity
(speed)
Data Value
(usefulness)
● Complexity: measures the degree of interconnectedness (possibly very
large) and interdependence in big data structures such that a small change (or combination of small changes) in one or a few elements can yield a small change or very large changes that ripple across or cascade through the system and substantially affect its behaviour. Or it can yield no change at all.
Challenges of big data
While technology issues such as storage and data transport appear to be solvable in the near term, their long-term challenges require research and new paradigms. Moreover, although the technical challenges of using big data are very real, managerial and cultural issues present even greater challenges, particularly for a traditionally fragmented sector such as construction. Historically, productivity gains were not a result of organizations only adopting new technologies but also, more importantly, the ability to adapt their management practices and change their organizations to maximize the potential. Similarly, a big data transition requires a shift in decision-making culture from organizations relying too much on experience and intuition and more on data. Furthermore, as with any successful transition, organizations need to manage such change process to using big data effectively by considering leadership, talent management, technology, decision making and company culture (McAfee and Brynjolfsson, 2012).
Kaisler et al (2013) propose three fundamental issue areas that need to be addressed in dealing with big data:
● Storage: while the quantity of data has exploded each time a new
storage medium has been invented, there has been no new storage medium for the most recent explosion (eg through unstructured digital channels such as social media, smartphones, mobile devices, sensors, etc).
● Management: access, metadata, utilization, updating, governance and
reference (in publications) are major stumbling blocks. A perfect big data management solution does not currently exist.
● Processing: in order to provide timely and actionable information,
extensive parallel processing and new analytics algorithms are required for the effective processing of exabytes of data.
and invasive/unwanted marketing, drive competing visions of how to deal with big data (Kaisler et al, 2013). Therefore, a major challenge for big data is in achieving an appropriate balance of maximizing the benefits of big data, while minimizing the harms it presents.
Examples of big data
There is anecdotal evidence of creating value from a big data/data-driven approach across a variety of sectors, whereby decisions are increasingly being based on data and analysis rather than on experience and intuition (Brown, Chui and Manyika, 2011; Manyika et al, 2011). For example, retailers tailor product selections at particular stores and determine the timing of price discounts by analysing sales, pricing and economic, demographic and weather data. Moreover, by combining monitoring of in-store movements of customers with how they interact with products they are able to reduce the number of items stocked but increase the mix of higher-margin private-label products without losing market share. Shipping companies mine data on truck delivery times and traffic patterns in order to fine-tune routing and logistics. Advanced oil fields optimize production and minimize downtimes by adjusting oil flows from continuously reading and analysing data on well-head conditions, pipelines and mechanical systems. Other examples include online dating services analysing the personal characteristics, reactions, communications etc of members in order to improve their date-matching algorithms; and the police utilizing computerized mapping and analysis of a variety of data in order to predict possible crimes and ‘hot spots’. Airline organizations eliminate gaps between estimated and actual arrival times through sophisticated analysis and pattern matching of a significant com-bination of publicly available data and proprietary company information.
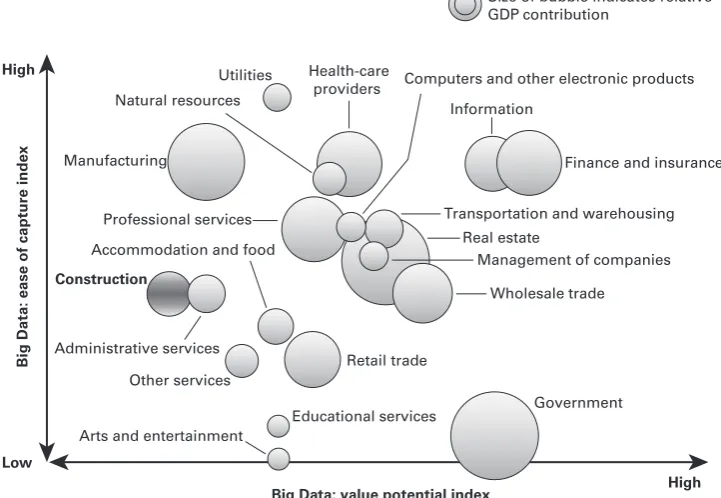
Big data has the predictive power, from a wider societal perspective, to help public health, economic development and economic forecasting (Figure 6.7). Moreover, it has the potential to be ‘humanity’s dashboard’ by providing an intelligent tool that can assist with social issues such as poverty, crime and pollution.
Big data in construction
while also being data intensive by nature, thereby using the data innovatively to compete by adopting sophisticated analytic techniques. Furthermore, the public sector was found to be the most fertile terrain for change, but faces steep barriers.
[image:18.501.88.449.127.376.2]In contrast, fragmented industry structures/supply chains such as those evident in construction complicate the value creation potential of sectors in that the average organization in them is relatively small and therefore can only access limited amounts of data. In construction, 98 per cent of the industry is represented by SMEs whereby the average size of organization is five or fewer people (BIS, 2013; ONS, 2013). On the other hand, the larger players are usually exposed to bigger pools of data and can consequently use this data more readily to create value. However, according to Brown, Chui and Manyika (2011) even low-ranking sectors (in relation to value potential and data capture) such as that of construction could see their fortunes change. This is particularly relevant to the current transformation of the UK construction industry that is being driven through the Government Construction Strategy. The opportunity for increased value creation can occur as the industry supply chains and clients and owner/operators evolve
figure
6.7The ease of capturing big data’s value and the magnitude of
its potential across various sectors: US economy
Utilities
High Health-care
providers Natural resources
Manufacturing
Professional services
Construction
Accommodation and food
Other services Administrative services
Educational services
Big Data: ease of capture inde
x
Arts and entertainment
Low
Big Data: value potential index
Size of bubble indicates relative GDP contribution
Computers and other electronic products
Information
Finance and insurance
Transportation and warehousing Real estate
Management of companies
Wholesale trade
Retail trade
Government
High
through level two BIM, in developing a greater degree of collaborative and integrated structures, culture, processes etc, along with improved and efficient information management and a shift from a narrowed focus on ‘lowest/ first-cost’ capital delivery procurement to ‘value-driven’ life-cycle management and digital procurement of assets, to level three and beyond of a data-driven approach, ie big data. Thereby such transformation facilitates the ability to capture value from data; increasing the sector’s potential for value creation using big data by developing the sector’s capabilities to capitalize on data, together with strong market incentives to do so.
In moving through level two BIM and developing the capabilities for transforming the sector for the digital procurement of assets, level three begins to focus on facilitating deriving ‘value’ through big data by developing the capability to operate analytic techniques on large data sets from which actionable information can be produced to support more predictive, as opposed to intuitive, decision making. In particular, the life-cycle management of the built environment is enabled through digital procurement based on a data-driven approach that not only embraces the capital delivery and operational management of assets but extends to performance management across assets, sectors, society/ies, etc, ie Digital Built Britain (DBB, 2014) (Figure 6.8).
In relation to capital delivery, the greatest challenge in successfully managing a project is finding the right information when it is needed, collecting the right information from different construction sites and man-aging the distribution of information to other parties. Therefore, leverman-aging the vast amount of data through smart data systems can be an asset that can greatly benefit capital delivery, with the ability to provide insights for improving project portfolio management, time and budget certainty and performance, risk management, efficiency of site logistics and operations etc (van Rijmenam, 2013).
f
ig
u
r
e
6 .8Digital Built Britain oper
ational model str
ategy
Pow er Peopl e Water Transportatio n Build ings Dependency Analytics Us in g BIG Data Capital Deliv ery Open Source & Data to
Encourage inno
vation and
growth in the tec
hnology
, HPC
and Build En
vironment Mark
ets
Open Data – data.go
v Oper ational A ctivity Interoperable Cross S ector Smar t
Cities & Grids
R
ed titles indicate integration with existing sector ‘Industria Strategies Perf or mance Manag ement Strategy Sma rt City Po rtfolio Management Maintenanc e
Asset Operations Management
© Bew 20
13 Dependency Analytics Strategy Sma rt City Po rtfolio Management Strategy Sma rt Grid Po rtfolio Management
Operation & P
erformance
Asset P
erformance Management
Design & Construction
Building Information Modelling
K
ey
Formal Data Exc key Business dri
(Decision) 4 3 5 N N N 2 1 0 IP Data Occ Data x SO u RC E
: DBB (
2014
Smart citizens, cities and governments
Urbanization has been increasing rapidly since the 18th century from less than 5 per cent of the global population living in a city to more than 50 per cent by 2007 (UNPD, 2007); and this trend is predicted to continue to increase to 80 per cent by the end of the 21st century (Harrison and Donnelly, 2011). While positive benefits accumulate from dense, diverse cities, highly urbanized populations also create many challenges for the planning, development and operation of cities. As discussed previously, the level three BIM/Digital Built Britain strategy is concerned with the life-cycle management of the built environment enabled through digital procurement based on a data-driven approach that not only embraces the capital delivery and operational man-agement of assets/infrastructure but extends to performance manman-agement across sectors, society(ies) etc, ie smart cities.
The smart city is a recent concept introduced as a strategy to mitigate the challenges generated by the urban population growth by emphasizing the importance of information and communication technologies (ICTs) for enhancing the competitive profile of a city, eg improving economic and political efficiency and enabling social, cultural, urban and sustainable development. According to Caragliu, Del Bo and Nijkamp (2009), a smart city is one where: ‘investments in human and social capital and traditional (transport) and modern (ICT) communication infrastructure fuel sustainable economic growth and a high quality of life, with a wise management of natural resources, through participatory governance’.
Significant quantities of data are being produced through ubiquitous computing and big data smart systems can leverage knowledge from this accumulation of information to support the developments of smart cities. Moreover, this can be further enhanced through citizens contributing to the smart operation of cities through ubiquitous computing (ie smart citizens), which provides access to real-time information at the level of individual citizens’ choices and actions (ie ‘making the invisible visible’). In addition, linking communicating sensors to computing intelligence gives rise to the internet of things (the industrial internet) and this growing and largely invisible web of interconnected smart objects and devices promises to transform the way we interact with everyday things (Reed, Gannon and Larus, 2012). Therefore, combining this information with other sources will assist local governments/authorities to manage their built environment much smarter such as improving traffic flow, providing mapping services, supporting relief and aid services in the event of a disaster etc. Moreover, the Digital Built Britain level three BIM strategy will form the basis for level four BIM whereby the focus will extend to social outcomes and well-being (DBB, 2014).
generate a 3D real-time model that displays various pipelines and facilities both above and below ground.
Ubiquitous computing, big data, and cloud computing are beginning to change how assets/infrastructure are procured and the built environment is managed. This is not only of concern to the technologies industry but also requires those sectors responsible for the life-cycle management of the built environment to adapt by developing the necessary capabilities.
Data and the integrated supply chain
The effective deployment and use of a big data-driven strategy, including BIM, requires a disciplined and structured approach to data creation, which is openly shareable. BIM ‘level two’ requires the use and handover of a COBie (construction operations building information exchange) data schema providing a consistent method of data exchange with the ability of capturing data at its point of origin. Creating and storing structured data is a prerequisite for big data processes and enables the entire supply chain to contribute, due to the consistency of processes. One main premise of COBie is the ability to have one input for many outputs.
Whilst COBie is effective at standardizing data structures, there is also a requirement for raw data and information to be distributed around the supply chain. The integrated supply chain requires the management of information flow in three distinct areas: strategic, tactical and operational. At the micro operational level the use of BIM and the CDE provides an integrated supply chain management system.
Integrated supply chain management systems
As technology has improved, the introduction of systems has helped to improve specific functions within the industry. However, the ecosystem of construction includes many legacy and disparate systems that are not inter-operable, which contributes to the silo working that is so inherent. Relying on independent systems contributes to requirements loss as information is corrupted or distorted during movement. Up to 50 per cent of initial re-quirements can be lost (Huovila, Koskela and Lautanala, 1994), contributing to a vast amount of waste and rework.
By adopting an integrated system, with digital information forming the initial input, directly from its point of origin, information can be shared across the entire supply chain. Akin to an ERP system this would involve the information models forming the input and all discipline-specific functions
f
ig
u
r
e
6 .9Integr
ated workflow
Common Data EnvironmentC ap ex C o m p le ti o n – C D E – Fe d er at Central Repositor y of Project Information Client Asse M an ag em Project Quality M an ag em en t
Project Controls Project
Reportin g D es ig n Completion Docume n t M an ag em en t W o rk P ac ka g e M an ag em en t Programming Cost Plan O&M an d H an d o ve r M o n th ly V al u at io n R ep o rt P ro cu re m en t W o rk P ac ka g in g V ar ia ti o n M an ag em en t Design sof tw are
An integrated supply chain management system is akin to electronic data management system but links organizations via real-time data transfer, project controls and workflows to ensure that the entire supply chain is utilizing the same, up-to-date information. The system provides a transparent system of material and information exchange internally and externally and the use of internal cross-functional management structures.
In 1985 Kurt Salmon Associates in the United States identified that delivery times for apparel was 66 weeks, primarily due to inventory or transit proce-dures, causing major losses due to inflexibility and storage costs. The resulting strategy was based on suppliers sharing information – and the grocery industry in particular adopted a set of standards for electronic data interchange (EDI). Point-of-sale scanning systems relayed information enabling the entire supply chain to forecast more accurately.
Whilst construction differs from manufacturing the same principles can be applied by accepting that design, procurement and construction is a systematic process of information creation, distribution and use. Using BIM, structured data and the CDE enables quick responses as near instantaneous access to real-time information can be accessed, interrogated and acted upon due to the two-way communication environment it creates. Another premise of BIM is the ability to reuse information created elsewhere, elimi-nating vast quantities of duplication and rework. Whilst there remains a number of legal issues surrounding this method of working, it facilitates design for manufacture and encourages off-site manufacturing, moving the design and construction process further towards manufacturing.
There are distinct synergies between BIM and lean construction, which is the application of the Toyota Production System (TPS) principles to the con-struction project delivery process, with the goal of eliminating anything that does not add value to the product. A study by Sacks et al (2010) discovered 52 positive interactions between BIM and lean with the following benefits:
● reduced variability; ● reduced cycle times; ● reduced batch sizes; ● increased flexibility; ● increased standardization; ● improved requirements capture; ● improved visual management;
● improved verification and validation processes; ● facilitation of continuous improvement.
determining when materials or materials are required to reduce variability.
Pull planning is a process where members of the supply chain collaborate to make commitments based on currently available information. Having information shared openly is an obvious benefit for facilitating this process. Subsequently one piece flow is achieved, a process in which information is made available in smaller segments, as it is created. This reduces waiting time as the supply chain can be made aware of current statuses in near real-time, enabling them to plan more accurately.
By ensuring that information is updated on a very regular basis andon
(the process of notifying a defect in a manufacturing line) is enabled where the identification of defects – or in the case of the supply chain, errors in the information – are efficiently detected. Moreover, pull planning and the
last planner system of production (a system of creating predictable and reliable workflow – see Ballard, 2000) enables the identification of the root cause of effects by analysing reasons for commitments being missed. This enables a more scientific process of managing the performance of the supply chain.
Value stream mapping is facilitated as a result of sharing and using common information. The value chain identifies end-to-end processes, and activities that do not explicitly add value, such as duplicated effort, are removed. Rather than local optimization, with the integrated supply chain, common real-time information is used to map the process holistically, identifying inherent waste, duplication and non-value-adding activities that exist in the interfaces between organizations in the supply chain. This en-ables the opportunity to improve joint process efficiency. As a direct result, competitive advantage can be generated in two distinct ways: optimization and coordination.
As iteration waves reduce (the time between data creation and use) the accuracy and precision of information increases, enabling near real-time decisions to be made. This reduces risk as information utilized for decision making is transacted almost to the point of automation, improving objectivity and enabling more proactive and predictive decisions. Removing subjective decision making, in respect of supply chain decisions, eliminates the opportunity for discriminate judgements, wrong interpretations and poor conclusions. This presents a fairer method of analysing the supply chain, potentially reducing inherent risks and opening up newer and more innova-tive procurement and delivery strategies, including integrated forms of agreement.
Enterprise-level integration
Whilst integrating the supply chain at the micro operational level brings efficiency benefits, at the macro strategic level the focus is on what the integrated supply chain do well, its responsiveness to changes and its ability to continuously improve. Data and the internet of things can assist in enter-prise-level supply chain integration.
The benefits from an integrated, enterprise-wide and life-cycle approach to supply chain management will include:
● greater clarity on long-term in-service performance expectations and
the consequences of design-stage decisions over life-cycle performance and cost;
● improved predictability using big data and performance data;
● a better understanding of the supply chain market, the availability of
resources and improved predictability of future events (based on the availability of commercial data and supplier data);
● location-based demand for services with the opportunity to ‘level out
the load’ in respect of supply chain opportunities, ensuring that variances in demand can be met with better precision;
● reduced project start-up costs due to availability of better
information at the beginning of the project;
● portfolio management across multiple projects, programmes or
estates;
● organizational ‘personality’ management with the option of
monitoring the performance of different organizations working together to identify positive and negative synergies;
● continuous improvement.
Perhaps more important to any of this is the use of data-driven procurement and management strategies providing a distinct shift from traditional decision making. Using data removes subjectivity and intuitive through processes. The use of data, structured and presented with coherence and clarity, forces object decision making, which can ultimately only be good for the construction supply chain, with clearer and more transparent governance.
Continuous improvement
organizations that can deliver projects collaboratively, be that with interfaces (work packages), interdependencies (with supply and construct) or ability to meet commitments (pull planning), is the basis for ensuring that collaboration brings tangible value.
Using data created during the project life cycle presents a transparent set of information relating to performance. The use of this data removes the subjectivity that could ordinarily be present when measuring the performance of the supply chain.
As referred to earlier, by sharing information and adopting lean principles the root causes of effects can be identified and eradicated. By analysing data and using optioneering, which is a key benefit of using digital technologies, cause and effect can be determined. An example from outside the construction industry is the motorsport industry. As single changes are made to a vehicle, the effect of that change can be made and near instantaneous feedback is generated via sensors, engine data and lap times. Using this strategy means that there is little or no subjectivity involved.
Causes for failing to complete planned work should be investigated and those causes removed. This is only feasible when a robust process for providing feedback and learning opportunities for continual improvement are identified. Requirements and data should be captured throughout the entire process and reports submitted in order to fully understand what has happened at each stage. This is better achieved by providing a visual aid to articulate cause and effect.
Data visualization
In order for data to be understood it has to be presented in a format that is intuitive and easily understood by the user. Indeed, the sheer amount of data that is created must not only be structured but presented visually via data visualization, which is concerned with communicating information clearly to aid people in understanding the significance of data by placing it in a visual context. Data visualization can also assist with data mining, which is the extraction of meaningful information from large data sets.
In the construction context it has already been discussed that supply chain management does not generally concern the flow and distribution of goods and materials as much as the management of information. That said, in terms of performance management, the display of data amassed from metrics and key performance indicators in relation to the supply chain can be presented visually. This assists with identifying trends, cause and effect and facilitates more predictive planning, which is useful in areas such as design management, productivity management, quality control, contract administration and invoicing and payment.
spreadsheets are susceptible to cells not being copied accurately and discrep-ancies occurring, thus causing errors. Having a shared database of data, presented visually, improves accessibility thus improving objectivity.
The purpose of performance measurement is generally to provide assurance when performance meets expectations and to take corrective action when it does not. Interactive dashboards enable you to manage by exception, ie monitor at a high level and then drill down into areas of concern, finding the root cause and correcting it. Dashboards that are not dynamic in this way tend to present all information at the same level of detail. This results either in not enough detail being available to correct poor performance or time wasted reviewing detailed reports of good performance.
Conclusion
BIM, big data and lean can eliminate the tendency to encourage local optimization of work and reduce variances in productivity in order to enable more accurate forecasting and production rates (Sacks et al, 2010). If implemented holistically, the new integrated and lean process will help to depart from the traditional transformation and individualistic view of construction to a more complete view, which gives equal importance to the value and flow concepts along with the transformation concept. However, it should be noted that the use of big data will not replace human intuition but complement existing skills.
The creation of data, of any kind, offers the opportunity to change our decision making from subjective to objective with the use of structured, validated data. Removing human interpretation eliminates the opportunity for opinions, discriminate judgements and poor conclusions. As the data we generate becomes more intelligent we will move to proactive decision making, based on trends, analytics and more objective judgements. The sharing of this data improves transparency, creating a goldfish bowl environment, removing the opportunities for underhand tactics and behaviours synony-mous with the adversarial culture that currently exists.
Traditionally procurement has been seen as a mechanism for shifting risk to another party. The visualization of risks enables all stakeholders to under-stand the landscape they operate in with more clarity. The increase in con-fidence and trust will open up modern procurement routes, possibly using integrated forms of agreement, sharing risk and rewards. New forms of contract will emerge that rewards good behaviour and responds to the return to vertical supply chains.
By creating an integrated team, composed of the traditional players and supplemented with the nano-corporate, we can see a return to the master builder, albeit in an alternative form. Using data intelligently, and linking that using big data techniques, the industry will likely realize that the journey towards true supply chain integration is based on the realization that we all need each other to survive and we will be better together, integrated, than apart.
References
Baccarini, D (1996) The concept of project complexity: a review, International
Journal of Project Management, 14 (4), pp 201–04
Ballard, H G (2000) [accessed 23 February 2015] The Last Planner System of Production Control, School of Civil Engineering, Faculty of Engineering,
University of Birmingham [Online] http://leanconstruction.org.uk/media/docs/
ballard2000-dissertation.pdf
Ballard, G and Howell, G (2003) Lean project management, Building Research and
Information, 31 (2), pp 119–33
BARC (2013) Big Data Survey Europe, BARC-Institute, February 2013 BIS (2013) UK Construction: An analysis of the sector department of business
innovation and skills
Brown, B, Chui, M and Manyika, J (2011) Are you ready for the era of ‘big data’?,
McKinsey Quarterly, October 2011
Caragliu, A, Del Bo, C and Nijkamp, P (2009) Smart Cities in Europe, 3rd Central European Conference in Regional Science (CERS), 2009
DBB (2014) Digital Built Britain: Level 3 Building Information Modelling –
Strategic Plan, HMSO, London
Deutsch, R (2011) BIM and Integrated Design, John Wiley, Hoboken, NJ Dumbill, E (2013) Making Sense of Big Data, Big Data, 1 (1), March, pp 1–2 Eastman, C et al (2011) BIM Handbook, Wiley, Hoboken, NJ
Emmerson, Sir Harold (1962) Survey of Problems Before the Construction Industries,
Prepared for Ministry of Public Buildings and Works, HMSO, London
Fallon, K and Palmer, M (2007) General Buildings Information Handover Guide:
Principles, methodology and case studies, industry sector guide of the
Information Handover Guide Series Department of Commerce, United States of America
Harrison, C and Donnelly, IA (2011) A Theory of Smart Cities, in Proceedings of the 55th Annual Meeting of the ISSS-2011, September, Hull, UK 55 (1) HM Gov (2010) Low Carbon Construction Innovation and Growth Team Final
Report, HMSO, London
HM Gov (2011) [accessed 23 February 2015] Government Construction Strategy [Online] https://www.gov.uk/government/publications/government-construction-strategy
Huovila, P, Koskela, L and Lautanala, M (1997) Fast or Concurrent: The art of getting construction improved, Proceedings of International Workshop on Lean Construction, Santiago, Chile
Lee, H and Billington, C (1992) Managing supply chain inventory: pitfalls and opportunities, Sloan Management Review, 33 (3), pp 65–73
McAfee, A and Brynjolfsson, E (2012) Big data: the management revolution,
Harvard Business Review, October, pp 60–68
Manyika, J et al (2011) Big Data: The next frontier for innovation, competition, and productivity, June, McKinsey Global Institute
ONS (2013) Construction Statistics, No 14, 2013 Edition, Office for National Statistics Reed, DA, Gannon, DB and Larus, JR (2012) Imagining the future: thoughts on
computing, IEEE Computer, 45 (1), pp 25–30
Russom, P (2011) Big Data Analytics, TDWI (The Data Warehousing Institute) Report, Fourth Quarter
Sacks, R et al (2010) The interaction of lean and building information modelling in construction, Journal of Construction Engineering and Management, 136 (9), pp 968–80
Thomsen, C et al (2009) Managing Integrated Project Delivery, CMAA
UNPD (United Nations Population Division) (2007) [accessed 23 February 2015] World Urbanization Prospects [Online] http://www.un.org/esa/population/ publications/wup2007/2007WUP_Highlights_web.pdf
van Rijmenam, M (2013) [accessed 23 February 2015] Big Data Can Help Construction Companies Deliver Projects On Time, Datafloq [Online] https:// datafloq.com/read/big-data-construction-companies-deliver-projects-t/143 Williams, TM (1999) The need for new paradigms for complex projects,
International Journal of Project Management, 17 (5), pp 269–73