S kill a s s e s s m e n t in u p p e r li m b
m y o el e c t ri c p r o s t h e si s u s e r s :
v ali d a ti o n of a cli ni c ally f e a si bl e
m e t h o d fo r c h a r a c t e ri si n g u p p e r
li m b t e m p o r a l a n d a m p li t u d e
v a ri a bility d u r i n g t h e
p e r f o r m a n c e of f u n c ti o n al t a s k s
T hi e s, S BA, Ke n n ey, LPJ, S o b u h , M , G al pi n, AJ, Kyb e r d , P, S ti n e , R
a n d M aj or, MJ
h t t p :// dx. d oi.o r g / 1 0 . 1 0 1 6 /j. m e d e n g p hy. 2 0 1 7 . 0 3 . 0 1 0
T i t l e S kill a s s e s s m e n t in u p p e r li m b m y o el e c t ri c p r o s t h e si s u s e r s : v ali d a tio n of a cli ni c ally f e a si bl e m e t h o d fo r c h a r a c t e r i si n g u p p e r li m b t e m p o r al a n d a m p li t u d e v a ri a bility d u r i n g t h e p e r f o r m a n c e of f u n c ti o n al t a s k s A u t h o r s T hi e s , S BA, Ke n n ey, LPJ, S o b u h , M , G al pi n , AJ, Kyb e r d , P,
S ti n e , R a n d M ajor, MJ
Typ e Ar ticl e
U RL T hi s v e r si o n is a v ail a bl e a t :
h t t p :// u sir. s alfo r d . a c . u k /i d/ e p ri n t/ 4 2 3 7 8 / P u b l i s h e d D a t e 2 0 1 7
f r e ely a v ail a bl e o nli n e a n d c a n b e r e a d , d o w nl o a d e d a n d c o pi e d fo r n o
n-c o m m e r n-ci al p r iv a t e s t u d y o r r e s e a r n-c h p u r p o s e s . Pl e a s e n-c h e n-c k t h e m a n u s n-c ri p t fo r a n y f u r t h e r c o p y ri g h t r e s t r i c ti o n s .
Page 1 of 24
Title: Skill assessment in upper limb myoelectric prosthesis users: Validation of a clinically feasible
1
method for characterising upper limb temporal and amplitude variability during the performance of
2
functional tasks.
3
4
Authors: Sibylle B Thies1, Laurence PJ Kenney1, Mohammad Sobuh1,2, Adam Galpin1, Peter Kyberd3, 5
Rebecca Stine4,5, Matthew J Major4,5 6
7
Affiliations:
8
1School of Health Sciences, University of Salford, UK; 2Department of Orthotics and Prosthetics, The 9
University of Jordan, Jordan; 3Engineering Science, University of Greenwich, UK; 4Northwestern 10
University Prosthetics-Orthotics Center, Northwestern University Feinberg School of Medicine, Chicago,
11
IL, USA; 5Jesse Brown VA Medical Center, Chicago, IL, USA 12
13
Contact information for corresponding author:
14
Sibylle Thies
15
School of Health Sciences
16
Brian Blatchford Building Room PO28
17
The University of Salford
18
Salford, Greater Manchester, M6 6PU, UK
19
Email: [email protected] 20
21
Abstract word count: 200
22
Manuscript word count: 3364 (without references), 2 Tables, 5 Figures.
Page 2 of 24
ABSTRACT (200 words)
25
Upper limb myoelectric prostheses remain challenging to use and are often abandoned. A proficient
26
user must be able to plan/execute arm movements while activating the residual muscle(s), accounting
27
for delays and unpredictability in prosthesis response. There is no validated, low cost measure of skill in
28
performing such actions. Trial-trial variability of joint angle trajectories measured during functional task
29
performance, linearly normalised by time, shows promise. However, linear normalisation of time
30
introduces errors, and expensive camera systems are required for joint angle measurements.
31
This study investigated whether trial-trial variability, assessed using dynamic time warping (DTW)
32
of limb segment acceleration measured during functional task performance, is a valid measure of user
33
skill. Temporal and amplitude variability of forearm accelerations were determined in 1) seven
34
myoelectric prosthesis users and six anatomically-intact controls and 2) seven anatomically-intact
35
subjects learning to use a prosthesis simulator over repeated sessions.
36
1: temporal variability showed clear group differences (p<0.05). 2: temporal variability
37
considerably increased on first use of a prosthesis simulator, then declined with training (both p<0.05).
38
Amplitude variability showed less obvious differences. Analysing forearm accelerations using DTW
39
appears to be a valid low-cost method for quantifying movement quality of upper limb prosthesis use
40
during goal-oriented task performance.
41
42
Keywords
43
Myoelectric prostheses, dynamic time warping, accelerations, variability, upper limb.
44
Page 3 of 24
1. INTRODUCTION
46
As a result of concerted efforts over recent decades, there have been significant advances in myoelectric
47
prostheses design. The motors used have become smaller and more powerful, cosmetic covers have
48
become more life-like, and, of most note, multi-functional hands, such as the i-Limb (Touch Bionics,
49
Livingston, UK) and Be-Bionic (Steeper, Leeds, UK) have been developed. Yet, prosthesis users are still
50
greatly limited by the available control modalities and lack of sensory feedback from the prosthesis [1].
51
Hence it is not surprising that such devices remain challenging to use and are often poorly utilized, or
52
rejected [2, 3]. As more expensive multi-function myoelectric prostheses have become available, such as
53
the i-limb full hand and i-limb digits (Touchbionics Inc., Livingston UK), there is an urgent need for
well-54
validated and robust quantitative measures that allow for informed selection of a particular technology
55
(to achieve a better match between user and device), and that have the potential to inform user
56
training.
57
58
Currently, quantifying the effectiveness of a given device, or the proficiency with which it is used,
59
remains limited by the available outcome measures [4].Clinical tests often capture self-reported
60
capabilities (e.g. Orthotics and Prosthetics Users' Survey “OPUS” [5]), evaluate performance subjectively
61
(e.g. Assessment of capacity for myoelectric control [6]), or measure speed of performance of a
pre-62
defined set of tasks (e.g. Southampton Hand Assessment Procedure “SHAP” [7]). Research has
63
discussed the limitations with many of these measures, such as reliance upon self-report and/or
64
observer ratings [8-10]; self-report does not directly measure the person’s physical capabilities and can
65
be influenced by subject bias, and observer-dependent measures are susceptible to (inter-/intra-) rater
66
bias, which inherently reduces reliability compared to performance-based measures in which the
67
administrator does not form part of the instrument. Previous research has also shown that whilst
68
important [10], speed of task completion is only one of several factors which characterize skilled
Page 4 of 24
prosthetic use; other measures, notably gaze and kinematics may further enhance our understanding of
70
user performance and skill level [11].
71
72
Accordingly, Major et al. recently compared the kinematics of myoelectric prosthesis users and
able-73
bodied controls without known pathology [12]. Specifically, considering that motor variability (motor
74
variance across task repetition) has shown to decrease with skill acquisition [13, 14], and given the
75
redundant degrees of freedom (DoFs) in the upper body musculoskeletal architecture that permit
76
various task-equivalent motor strategies, Major et al. [12] focused on studying kinematic variability of
77
these DoFs. Their results showed that joint kinematic variability is higher in prosthesis users than
78
controls, and was correlated with years of experience of prosthesis use. Their findings suggest that
79
increased compensation may be reflected in increased joint kinematic variability above able-bodied
80
individuals.
81
82
In common with almost all studies of upper limb functional task performance, in [12] joint angle
83
trajectories were calculated as follows. Angle trajectories were first linearly normalized with respect to
84
time, and joint level kinematic variability was defined as the variability around a kinematic profile
85
averaged across multiple time-normalized trials. The standard deviation and coefficient of multiple
86
determination then served as outcome measures to characterize variability and repeatability,
87
respectively. However, non-cyclic kinematics are subject to two different aspects of trajectory
88
variability: temporal and amplitude variability (Figure 1). Specifically, the relative duration of different
89
phases of a given functional movement can vary from trial to trial, and linear time normalization of the
90
entire task cannot take this into account [15]. Hence, while these traditional measures can inform on
91
overall differences in movement variability, they remain limited in that they do not consider temporal
92
variability separately to variations in signal amplitude, yet this has shown to be advantageous in the
93
assessment of non-cyclic functional upper limb tasks [15,16].
Page 5 of 24
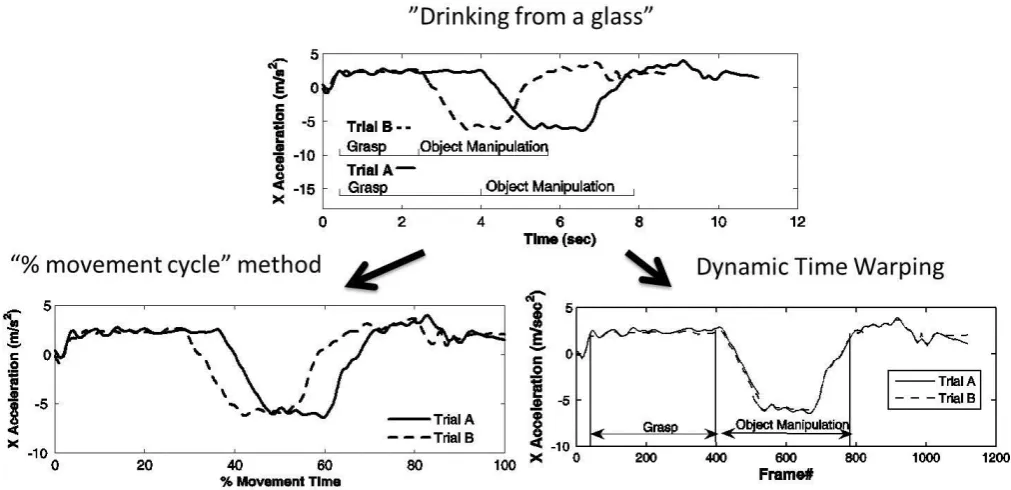
Thies et al. previously introduced a novel methodology based on dynamic time warping (DTW) for curve
95
registration across multiple trials to calculate measures of amplitude and timing variability over entire
96
trajectories of functional movements [15]. In their approach a chosen target signal is warped to a
97
declared reference signal by compressing or stretching the target signal along the time-axis with respect
98
to the reference signal in a non-uniform manner. Warp Cost reflects the amount of time-warping
99
needed to achieve the best possible temporal match between curves and serves as a measure of
100
temporal variability. Following the time warping of signals, RMS error then informs on amplitude
101
variability. Separating out temporal from amplitude variability is of particular advantage during
102
processing of non-cyclic upper limb kinematics: we take the stand that DTW is a more appropriate
103
method to analyse kinematic inter-trial variability of the upper limbs during functional task performance
104
since it minimizes the mismatch of the different movement components (Figure 2).
105
106
A first demonstration of the DTW method involved characterization of acceleration trajectories derived
107
from an arm-worn accelerometer during performance of two daily-living activities in subjects with
108
stroke and matched controls. Findings showed increased timing variability for the stroke subjects as
109
compared to controls, and this outcome was reliably reproduced on a second test day one month later
110
[15]. This finding of increased variability following stroke was consistent with numerous previous
111
studies, which have generally used simpler tasks and discrete, rather than continuous, measures of
112
variability (e.g. variability of end point error in pointing tasks [17, 18]. A more recent study used the
113
DTW method to demonstrate differences in trajectory variability when comparing stroke survivors with
114
right and left hemisphere lesions, as well as to healthy controls [16]. They showed increased timing
115
variability in the paretic arm of stroke survivors with right compared with left hemisphere lesions and
116
further confirmed previous finding [15] of increased variability following stroke compared with controls.
117
The DTW method which assesses contributions of temporal and amplitude variability separately proved
118
particularly suitable to identify differences between left and right hemispheric stroke survivors.
Page 6 of 24
Although already demonstrated for assessment of upper limb kinematics in people with stroke, the
120
potential and validity of this methodology to characterize upper limb movements in relation to
121
functional performance for upper limb prosthesis users has yet to be explored. Hence this paper
122
reports on the characterization of functional task performance with an upper limb myoelectric
123
prosthesis using the DTW method. The purpose of this retrospective study was to investigate whether
124
DTW is a valid tool for assessing temporal and amplitude variability of upper limb prosthesis kinematics
125
through a known-groups assessment (Study 1) and a responsiveness assessment (Study 2).
126
127
2. METHODS
128
In Study 1 we investigated the use of DTW to characterize upper limb function of myoelectric prosthesis
129
users and anatomically intact (AI) controls and its ability to discriminate between these two groups,
130
based on temporal and amplitude variability. In Study 2 we report on the changes in temporal and
131
amplitude variability with practice in using a myoelectric prosthesis simulator (AI subjects), to assess if
132
DTW can identify changes in temporal and amplitude variability resulting from practice of goal-oriented
133
tasks. Since accelerometers are wearable, inexpensive and clinically-accessible devices, we here apply
134
DTW to simulated accelerometer trajectories derived from position data, however, the method is
135
applicable to a range of kinematic data, including joint angle trajectories and data from other
segment-136
mounted inertial measurement units.
137
138
2.1 DTW for assessment of temporal and amplitude variability 139
As previously described [15], the DTW method employed in these two studies utilized dynamic
140
programming [19] to separately quantify timing and amplitude variability across multiple trials. Using
141
custom software in Matlab (Mathworks, Natick, MA), the algorithm first time-warps a chosen target
142
signal to a declared reference signal by compressing or stretching the target signal along the time-axis
143
with respect to the reference signal in a non-uniform manner. Warp Cost is returned as a unitless
Page 7 of 24
measure indicating the amount of time-warping needed to achieve the best possible temporal match
145
between curves. Warp Cost is hence reported as a measure of temporal variability between trials. Figure
146
3 stresses the need for DTW for accurate assessment of upper limb kinematic variability in an
147
anatomically intact subject, an anatomically intact subject using a prosthesis simulator, and an actual
148
prosthesis user. After time warping, the algorithm calculates the remaining root mean square error
149
(RMS Error) between signals after time-warping is complete. We interpret the reported RMS Error as a
150
measure of signal amplitude variations after temporal variations have been addressed.
151
152
2.2 Study 1 (Known-groups assessment) 153
Study 1 was carried out at Northwestern University, USA. Full details of the protocol are provided in [12].
154
Following ethical approval by the Northwestern University Institutional Review Board, six AI individuals (3
155
male, 35±11 years of age) and seven myoelectric transradial prosthesis users (5 male, 49±18 years of age,
156
20±18 years of prosthesis experience) were recruited and tested. Subjects visited the lab on one occasion
157
and, after providing informed consent, performed five trials of three seated, goal-oriented tasks (selected
158
from the SHAP [7]): 1) lifting a carton and emptying liquid contents into a jar using their non-dominant or
159
prosthetic limb, 2) lifting and transferring a weighted container across a low-level barrier using their
non-160
dominant or prosthetic limb, and 3) lifting and transferring a tray across a low-level barrier using both
161
hands. The non-dominant limb of able-bodied individuals was chosen for sensible comparison with
162
prosthesis users whose prosthetic limb we assumed to act as the non-dominant limb [20]. The number of
163
trials (5) was comparable with other studies concerned with assessment of prosthesis kinematics [21, 22].
164
Subjects were asked to perform the task as quickly as possible and the start and end of each trial was
165
denoted by a button-push. Both groups also completed the entire SHAP protocol with their non-dominant
166
hand to assess general upper limb functional abilities. SHAP has shown to have good reliability and validity
167
for assessment of hand function [7], with scores of less than 100 indicating how impaired hand function
168
is. During each task, marker position approximating location of the radial and ulnar styloid processes were
Page 8 of 24
collected and used to track the virtual wrist joint centre. Three markers on the forearm (radial styloid,
170
ulnar styloid, and medial epicondyle) were used to define the forearm local reference frame. The 3D
171
position data were collected at 120 Hz using a twelve camera motion capture system (Motion Analysis
172
Corporation, Santa Rosa, CA, USA). Wrist joint three-axis accelerations were calculated in the global
173
frame, then gravity was added to the vertical acceleration component. Finally, the acceleration vector
174
was rotated from the global to the forearm frame [23]. These simulated accelerometer data were used to
175
calculate inter-trial temporal (Warp Cost) and amplitude (RMS Error) variability [15].
176
177
This known-groups assessment was deemed to support validity of the methodology if the trends in the
178
variability assessed with DTW reflected those previously observed in joint-level kinematics [12], i.e., we
179
hypothesized that prosthesis users would demonstrate greater variability than controls. Moreover, use of
180
DTW in this study would identify individual contributions of temporal- and amplitude-specific variability
181
to overall movement variability. Data were statistically analysed using independent group t-tests to
182
compare mean differences in Warp Cost, RMS Error, and SHAP score between AI and prosthesis user
183
cohorts, and significance was evaluated based on equality of variances as estimated by the Levene’s Test.
184
185
2.3 Study 2 (Responsiveness assessment) 186
Study 2 was carried out at the University of Salford, UK. Following ethical approval by the University of
187
Salford Research Ethics Committee, seven AI individuals (4 male, 6 right handed, 36±10 years of age)
188
provided informed consent and were recruited to the study. AI subjects rather than novel myolecetric
189
prosthesis users were recruited because of the very small numbers of traumatic upper limb amputees
190
referred to limb fitting centres. For example, in 2004/5, there were just 54 new referrals of trans-radial
191
amputees in the UK. Subjects visited the lab on 9 occasions over approximately a 2-week period; full
192
details of the full protocol are published in [24], however, only a subset of visits is reported on here. On
193
their first visit, subjects were asked to perform a seated task which involved reaching with their
Page 9 of 24
anatomic hand for a juice carton, picking it up and pouring the liquid into a cup, before returning it to its
195
original location, then moving their hand back to the original resting point (anatomic hand baseline). The
196
location of the carton, cup and starting point for the hand were fixed for each subject across all trials.
197
Subjects repeated the task 12 times. During their second functional task assessment as well as during
198
their final functional task assessment, subjects performed the same task with the same number of
199
repeats but with a custom-made myoelectric prosthesis simulator [24]. In between these prosthesis
200
simulator sessions, subjects carried out the SHAP on four occasions for practicing with the prosthesis
201
simulator. During task performance, 3D position data of a cluster of 4 reflective markers located on the
202
forearm were collected at 100 Hz using a ten camera Vicon 612® motion capture system (Vicon Motion
203
Systems, Los Angles, USA). The position data of their anatomic hand baseline, their first prosthesis
204
simulator session, and their final session with the prosthesis simulator (after SHAP training) were then
205
used to calculate the simulated output of a three-axis accelerometer [23]. Subsequently, temporal and
206
trajectory variability within session were calculated. It was hypothesized that introduction of the
207
prosthesis would increase variability (anatomic baseline versus initial Prosthesis simulator session), and
208
that training through practice to use a prosthesis simulator would reduce variability. Following checks
209
for their normal distribution, warp cost and remaining RMS error were statistically analyzed using a
one-210
way repeated measures ANOVA (SPSS General Linear Model tab) with post-hoc Bonferroni correction
211
for Type 1 Error.
212
213
For all statistical analyses, the critical α was set at 0.05 to guide interpretation of the results, and
214
statistics were conducted using SPSS software (IBM, Armonk, New York).
215
216
217
218
Page 10 of 24
3. RESULTS
220
221
3.1 Study 1 (Known-groups assessment) 222
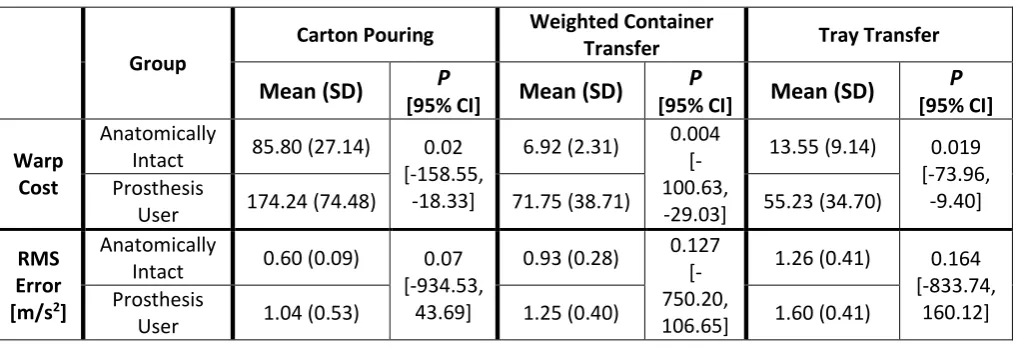
Significant differences in temporal variability (Warp Cost) were found between prosthesis-users and
223
able-bodied controls. Specifically, prosthesis users exhibited greater temporal variability than controls,
224
and this was so for all three tasks (Figure 4 and Table 1). Results suggested that amplitude variability
225
was greater for prosthesis users than able-bodied across tasks, but these group differences were not
226
statistically significant (P>0.05 for all tasks, Figure 4 and Table 1). Average SHAP Index of Function scores
227
for able-bodied and prosthesis users were 96(±3 SD) and 53(±12 SD) (p<0.001), respectively, suggesting
228
lower upper limb functional abilities for prosthesis users.
229
230
3.2 Study 2 (Responsiveness assessment) 231
Clear changes in temporal variability emerged throughout the study period (Figure 5 (left) and Table 2).
232
Specifically, when AI subjects were asked to use the prosthesis simulator for the first time, their
233
temporal variability increased as compared to their baseline performance with the anatomical hand
234
(P=0.022), but as they learned how to use the prosthesis simulator, their variability decreased again
235
(P=0.043) and returned to levels similar to baseline (P=0.267). Changes in amplitude variability likewise
236
emerged, although with a direction of continuous reduction in RMS Error throughout the study period
237
(Figure 5 (right) and Table 2). Specifically, RMS Error slightly decreased from baseline as subjects were
238
introduced to the prosthesis simulator (P=1.000), and a further reduction in RMS Error occurred with
239
practice to use the simulator (P=0.003), interestingly to levels much lower than baseline (P=0.043).
240
241
242
243
Page 11 of 24
4. DISCUSSION
245
The combined results from Studies 1 and 2 support the validity and usefulness of the DTW method for
246
characterizing movement quality of task execution when using an upper limb prosthesis. Study 1 found
247
significant differences in temporal inter-trial variability between prosthesis users and controls, but not in
248
amplitude variability. This finding demonstrates for the first time the nature of differences in
trial-to-249
trial variability between experienced users of myoelectric prostheses and controls. Specifically, by
250
separating out the two elements of trajectory variability, DTW revealed the primary contribution of
251
temporal variability to overall movement quality, with less apparent contributions of amplitude
252
variability. Moreover, that prosthesis users exhibited greater kinematic variability as compared to
253
controls across all three tasks along with reduced function, as quantified by lower SHAP scores, is in
254
agreement with previous findings [12], thereby supporting the validity of this method. It should be
255
noted that one of the possible reasons for the lack of statistical significance in amplitude variability was
256
the low statistical power due to a small sample size. Although consistent group differences in amplitude
257
variability existed across tasks, with magnitudes greater than those found with training in Study 2, these
258
differences were not large enough to reach significance given the within-group variability.
259
260
Although not unexpected, no-one has previously demonstrated that variability reduces with practice
261
with a prosthesis simulator. In Study 2 we investigated the extent by which temporal and amplitude
262
variability each contribute to this outcome and demonstrated that temporal variability in a carton
263
pouring task increased considerably on first use of a prosthesis simulator, then declined with
goal-264
oriented training (SHAP). Temporal variability hence showed to be responsive to effects of training.
265
Consistent with the findings in Study 1, amplitude variability showed less clear changes, especially on
266
first introduction of the prosthesis simulator. Two limitations of Study 2 are that AI subjects used a
267
prosthesis simulator and performed only one functional task. Therefore further research involving actual
Page 12 of 24
myoelectric prosthesis users and a more comprehensive task protocol is required to substantiate the
269
findings of Study 2.
270
271
Consistent with our previous study in stroke [15] temporal variability, as compared to amplitude
272
variability, emerged as the more insightful measure. As all of the tasks studied involved acquiring and
273
releasing objects using the prosthetic hand, and since opening the hand to acquire or release an object
274
is a common challenge in prosthesis control, then hesitations upon grasp and release may be one of the
275
sources of the higher timing variability seen in prosthesis users. It is noteworthy that temporal variability
276
varied significantly across tasks (see Table 1), each of which involved a single grasp and release, and
277
further work is needed to interpret this finding. Furthermore, given the trends observed in Studies 1 and
278
2, higher prosthesis user amplitude variability and a decrease with simulator training respectively, the
279
contribution of amplitude variability to movement quality should be explored further. Previous work has
280
suggested that below-elbow amputees are able to generate an accurate internal model of the prosthetic
281
limb [25] which implies self-integration of the limb to refine relationships between physiological input
282
and performance output. For example, one explanation for the decrease in amplitude variability with
283
practice (Figure 5) is that learning to use a prosthesis simulator with reduced DoFs may require some
284
development of a new internal model with training to minimize limb amplitude variability. The increase
285
(Prosthesis 1, Figure 5) and subsequent decrease (Prosthesis Final, Figure 5) in temporal variability upon
286
introduction to the prosthesis simulator would be reflective of skill acquisition.
287
288
Overall, analysing forearm accelerations using the DTW method appears to be a valid method for
289
quantifying movement quality of upper limb prosthesis use during the execution of goal-oriented tasks.
290
The information delivered from such assessment offers a valuable, objective outcome for monitoring
291
rehabilitation progress that would complement other performance-based and self-report clinical
292
outcome measures. A rich set of outcome data would aid in development of more appropriate,
Page 13 of 24
centric training programs with the aim of maximizing functional performance and minimizing potential
294
for device abandonment. Yet, further work is needed to understand the implications of our work for
295
clinical training. We have shown that in simulator users both amplitude and temporal trajectory
296
variability decrease with practice, suggesting our metrics may be of value in assessing skill. However,
297
research is needed to understand whether patients would benefit from training specifically targeted at
298
reducing variability.
299
300
Importantly, the studies reported here used camera based techniques to derive overall task completion
301
time and simulated accelerometer trajectories. However, both of these parameters could be derived
302
from a forearm-mounted accelerometer and hence the approach offers the potential for clinicians to
303
characterise both overall task completion time and trial-trial temporal and trajectory variability using
304
low cost instrumentation. Accelerometers have previously been used for classification of hand
305
movements [26, 27], and this study shows their potential in assessment of kinematic variability as an
306
aspect of movement quality. Future work should continue to explore use of wearable devices as a
307
simple, reliable, and clinically-accessible method for assessing prosthesis-use skill. When combined with
308
the use of low cost instrumentation, reliability of the DTW method for assessing prosthesis user
309
movement quality should be investigated to complete an evaluation of its psychometric properties.
310
311
ACKNOWLEDGEMENTS
312
This research was supported in part by a Career Development Award (Award #1IK2RX001322-01A1)
313
from the United States (U.S.) Department of Veterans Affairs Rehabilitation Research and Development
314
Service,, the David Rubin, MD, Enrichment Fund, and the Department of Education National Institute on
315
Disability and Rehabilitation Research (Grant No. H133E080009).
316
317
Page 14 of 24
DECLARATIONS
319
Ethics approval and consent to participate: For testing of human subjects, Study 1 (Known-groups 320
assessment) received ethical approval from the Northwestern University Institutional Review Board,
321
USA (Ref # STU00028580), whilst Study 2 (Responsiveness Assessment) received ethical approval from
322
the University of Salford Research Ethics Committee (Ref # REPN09/174). All participants provided
323
informed consent. Animals were not part of the study.
324
Conflicts of interest: The authors declare that no financial and personal relationships with other people 325
or organizations exist that could have inappropriately influenced (biased) this work.
326
327
AUTHOR’S CONTRIBUTIONS
328
All substantial contributions of authors to the paper were as follows: (1) the conception and design of
329
the study (all), or acquisition of data (MS, RS), or analysis and interpretation of data (SBT, LPJK, MJM);
330
(2) drafting the article or revising it critically for important intellectual content (all); (3) final approval of
331
the version to be submitted (all).
332
333
REFERENCES
334
[1] Fougner A, Stavdahl O, Kyberd PJ, Losier YG, Parker PA. Control of upper limb prostheses: terminology
335
and proportional myoelectric control-a review. IEEE Trans Neural Syst Rehabil Eng 2012; 20: 663-77.
336
[2] McFarland LV, Hubbard Winkler SL, Heinemann AW, Jones M, Esquenazi A. Unilateral upper-limb loss:
337
satisfaction and prosthetic-device use in veterans and servicemembers from Vietnam and OIF/OEF
338
conflicts. J Rehabil Res Dev 2010; 47: 299-316.
339
[3] Ostlie K, Lesjø IM, Franklin RJ, Garfelt B, Skjeldal OH, Magnus P. Prosthesis rejection in acquired major
340
upper-limb amputees: a population-based survey. Disabil Rehabil Assist Technol 2012; 7: 294-303.
Page 15 of 24
[4] Resnik L, Borgia M, Silver B, Cancio J. Systematic Review of Measures of Impairment and Activity
342
Limitation for Person with Upper Limb Trauma and Amputation. Arch Phys Med Rehabil 2017. [Epub 343
ahead of print] 344
[5] Heinemann AW, Bode RK, O'Reilly C. Development and measurement properties of the orthotics and
345
prosthetics users' survey (OPUS): a comprehensive set of clinical outcome instruments. Prosthet Orthot
346
Int 2003; 27: 191–206.
347
[6] Hermansson LM, Bodin L, Eliasson AC. Intra- and inter-rater reliability of the assessment of capacity
348
for myoelectric control. J Rehabil Med 2006; 38: 118 –23.
349
[7] Light CM, Chappell PH, Kyberd PJ. Establishing a standardized clinical assessment tool of pathologic
350
and prosthetic hand function: normative data, reliability, and validity. Arch Phys Med Rehabil 2002; 83:
351
776-83.
352
[8] Krakauer JW. Arm function after stroke: from physiology to recovery. Semin Neurol 2005; 25: 384-95.
353
[9] Hummel FC, Celnik P, Pascual-Leone A, Fregni F, Byblow WD, Buetefisch CM, Rothwell J, Cohen LG,
354
Gerloff C. Controversy: Noninvasive and invasive cortical stimulation show efficacy in treating stroke
355
patients. Brain Stimul 2008; 1: 370-82.
356
[10] Bouwsema H, Kyberd PJ, Hill W, van der Sluis CK, Bongers RM. Determining skill level in myoelectric
357
prosthesis use with multiple outcome measures. J Rehabil Res Dev 2012; 49: 1331-48.
358
[11] Bongers RM, Kyberd P, Bouwsema H, Kenney L, Plettenburg DH, Van der Sluis CK. Bernstein’s levels
359
of construction of movements applied to upper limb prosthetics. J Pros Orth 2012; 24: 67–76.
360
[12] Major MJ, Stine RL, Heckathorne CW, Fatone S, Gard SA. Comparison of range-of-motion and
361
variability in upper body movements between transradial prosthesis users and able-bodied controls
362
when executing goal-oriented tasks. J Neuroeng Rehabil 2014; 11:132
Page 16 of 24
[13] Stergiou N, Harbourne R, Cavanaugh J. Optimal movement variability: a new theoretical perspective
364
for neurologic physical therapy. J Neurol Phys Ther 2006; 30: 120-9
365
[14] Shmuelof L, Krakauer JW, Mazzoni P. How is a motor skill learned? Change and invariance at the
366
levels of task success and trajectory control. J Neurophysiol 2012; 108: 578-94.
367
[15] Thies SB, Tresadern PA, Kenney LP, Smith J, Howard D, Goulermas JY, et al. Movement variability in
368
stroke patients and controls performing two upper limb functional tasks: a new assessment
369
methodology. J Neuroeng Rehabil 2009; 6:2.
370
[16] Freitas SM, Gera G, Scholz JP. Timing variability of reach trajectories in left versus right hemisphere
371
stroke. Brain Res 2011; 1419: 19-33
372
[17] Cirstea MC & Levin MF. Compensatory strategies for reaching in stroke. Brain 2000; 123: 940-53.
373
[18] Gordon J, Ghilardi MF, Ghez C. Accuracy of planar reaching movements. I. Independence of
374
direction and extent variability. Exp Brain Res 1994; 99: 97-111
375
[19] Cormen TH, Leiserson CE, Rivest RL, Stein C (2001) Introduction to algorithms. 2. Boston: MIT Press.
376
[20] Philip BA, Frey SH. Compensatory changes accompanying chronic forced use of the nondominant
377
hand by unilateral amputees. J Neurosci 2014; 34: 3622-31.
378
[21] Bertels T, Schmalz T, Ludwigs E. Objectifying the functional advantages of prosthetic wrist flexion. J
379
Prosthet Orthot 2009; 21: 74–78.
380
[22] Carey SL, Jason Highsmith M, Maitland ME, Dubey RV. Compensatory movements of transradial
381
prosthesis users during common tasks. Clin Biomech 2008; 23: 1128-35.
382
[23] Thies SB, Tresadern P, Kenney L, Howard D, Goulermas JY, Smith C, Rigby J. Comparison of linear
383
accelerations from three measurement systems during "reach & grasp". Med Eng Phys 2007; 29: 967-72.
Page 17 of 24
[24] Sobuh MM, Kenney LP, Galpin AJ, Thies SB, McLaughlin J, Kulkarni J, et al. Visuomotor behaviours
385
when using a myoelectric prosthesis. J Neuroeng Rehabil 2014; 11:72.
386
[25] Schabowsky CN, Dromerick AW, Holley RJ, Monroe B, Lum PS. Trans-radial upper extremity
387
amputees are capable of adapting to a novel dynamic environment. Exp Brain Res 2008; 188: 589-601.
388
[26] Soma H, Horiuchi Y, Gonzalez J, Yu W. Preliminary results of online classification of upper limb
389
motions from around-shoulder muscle activities. IEEE Int Conf Rehabil Robot. 2011.
390
[27] Atzori M, Gijsberts A, Müller H, Caputo B. Classification of hand movements in amputated subjects
391
by sEMG and accelerometers. Conf Proc IEEE Eng Med Biol Soc 2014; 2014: 3545-9.
392
Page 18 of 24
TABLES
394
Table 1. Known-groups assessment (Study 1)
395
Group
Carton Pouring Weighted Container
Transfer Tray Transfer
Mean (SD) P
[95% CI] Mean (SD)
P
[95% CI] Mean (SD)
P
[95% CI] Warp
Cost
Anatomically
Intact 85.80 (27.14) 0.02 [-158.55,
-18.33]
6.92 (2.31) 0.004 [-100.63, -29.03]
13.55 (9.14) 0.019 [-73.96,
-9.40] Prosthesis
User 174.24 (74.48) 71.75 (38.71) 55.23 (34.70)
RMS Error [m/s2]
Anatomically
Intact 0.60 (0.09) 0.07 [-934.53,
43.69]
0.93 (0.28) 0.127 [-750.20, 106.65]
1.26 (0.41) 0.164 [-833.74,
160.12] Prosthesis
User 1.04 (0.53) 1.25 (0.40) 1.60 (0.41)
396
Group mean (standard deviation “SD”) and statistical t-test results for Warp Cost and RMS Error for the
397
three functional tasks. 95%CI: 95% Confidence Interval of Mean Difference.
398
399
Table 2. Responsiveness assessment (Study 2)
400
Warp Cost RMS Error [m/s2]
Mean (SD) P†
[95% CI] Mean (SD)
P†
[95% CI] Anatomic 60.45 (17.02)
0.022 [-141.55; -13.07]
0.47 (0.09)
1.000 [-0.15; 0.19]
Prosthesis 1 137.77
(43.92) 0.45 (0.07)
Prosthesis 1 137.77
(43.92) 0.043
[2.15; 125.48]
0.45 (0.07)
[image:20.595.48.549.426.635.2]0.003 [0.05; 0.18]
Prosthesis
Final 73.95 (19.27) 0.33 (0.04)
Prosthesis
Final 73.95 (19.27) 0.267
[-8.38; 35.37]
0.33 (0.04) 0.043
[-0.26; -0.01]
Anatomic 60.45 (17.02) 0.47 (0.09)
†Adjustment for multiple comparisons: Bonferroni.
401
Group mean (standard deviation “SD”) of Warp Cost and RMS Error for AI subjects at baseline (anatomic
402
hand) and during learning to use a prosthesis simulator (myoelectric prosthesis) together with repeated
403
measures GLM pairwise comparisons for test sessions. 95%CI: 95% Confidence Interval of Mean
404
Difference.
Page 19 of 24
FIGURE CAPTIONS
406
Figure 1. Illustration of temporal and amplitude variability.
407
Figure 2. Illustration of the effects of uniform time normalization as compared to DTW. Example
408
(adapted from Thies et al. 2009): “drinking from a glass” involves a reach forward, grasp of the glass,
409
lifting, drinking and replacing the glass onto the table top. Note that for uniform time normalization
410
(left) trials remain inadequately aligned, as evident from the mismatch of the different movement
411
components, thereby leading to inappropriate estimation of inter-trial variation in signal amplitude
412
when RMS Error is calculated subsequently. This is not the case for DTW (right).
413
Figure 3. Use of time-normalization versus non-linear time warping for assessment of upper limb
414
kinematic variability. Example plots show distal-to-proximal forearm acceleration for an anatomically
415
intact individual (top), an anatomically intact individual using a prosthesis simulator (middle), and an
416
amputee (bottom), each pouring juice from a carton into a glass. Shown are original signals of 2 trials
417
(left), the same signals after time normalization (middle) and after time warping (right). A mismatch of
418
movement components remains after time normalization, whilst temporal alignment is optimized
419
through use of DTW for more accurate estimation of amplitude variability.
420
Figure 4. Known-groups assessment (Study 1). Group means and corresponding standard deviations for
421
temporal variability (Warp Cost, left) and amplitude variability (RMS Error, right) for all functional tasks.
422
Figure 5. Responsiveness assessment (Study 2). Group means and corresponding standard deviations
423
for temporal variability (Warp Cost, left) and amplitude variability (RMS Error, right). Anatomic: baseline
424
with anatomic hand; Prosthesis 1: first session with a myoelectric prosthesis simulator, Prosthesis Final:
425
final session with a prosthesis simulator (after four SHAP training sessions).
426
Page 20 of 24 428
Figure 1.
429
Page 21 of 24 431
Figure 2.
432
[image:23.595.47.553.61.306.2]Page 22 of 24 434
Healthy subject anatomic arm “carton pouring task”:
435
436
Healthy subject prosthesis simulator “carton pouring task”:
437
438
Myoelectric prosthesis user “carton pouring task”:
[image:24.595.49.568.125.259.2]439
Figure 3.
440
441
0 5 10 15 20 25
-3 -2 -1 0 1 2 3 4 Time (Sec) A c c X [ m /s e c 2] Original signals Trial 1 Trial 2
0 20 40 60 80 100 120
-3 -2 -1 0 1 2 3 4
% Movement Time
A c c X [ m /s e c 2]
After linear time normalization
Trial 1 Trial 2
0 500 1000 1500 2000 2500
-3 -2 -1 0 1 2 3 Frame # A c c X [ m /s e c 2]
After time warping
Trial 1 Trial 2
0 5 10 15 20
-2 -1 0 1 2 3 4 Time (Sec) A c c X [ m /s e c 2] Original signals Trial 1 Trial 2
0 20 40 60 80 100 120
-2 -1 0 1 2 3 4
% Movement Time
A c c X [ m /s e c 2]
After linear time normalization
Trial 1 Trial 2
0 500 1000 1500 2000
-2 -1 0 1 2 3 4 Frame # A c c X [ m /s e c 2]
After time warping
Trial 1 Trial 2
0 5 10 15
-2 -1 0 1 2 3 4 5 Time (Sec) A c c X [ m /s e c 2] Original signals Trial 1 Trial 2
0 20 40 60 80 100 120
-2 -1 0 1 2 3 4 5
% Movement Time
A c c X [ m /s e c 2]
After linear time normalization
Trial 1 Trial 2
0 500 1000 1500
-2 -1 0 1 2 3 4 5 Frame # A c c X [ m /s e c 2]
After time warping
Page 23 of 24 442
443
Figure 4.
444
Page 24 of 24 446
447
Figure 5.