comment
reviews
reports
deposited research
interactions
information
refereed research
Microarray analysis of orthologous genes: conservation of the
translational machinery across species at the sequence and
expression level
Jose L Jiménez, Michael P Mitchell and John G Sgouros
Address: Computational Genome Analysis Laboratory, Cancer Research UK, 44 Lincoln’s Inn Fields, London WC2A 3PX, UK.
Correspondence: Jose L Jiménez. E-mail: [email protected]
Abstract
Background: Genome projects have provided a vast amount of sequence information. Sequence comparison between species helps to establish functional catalogues within organisms and to study how they are maintained and modified across phylogenetic groups during evolution. Microarray studies allow us to determine groups of genes with similar temporal regulation and perhaps also common regulatory upstream regions for binding of transcription factors. The integration of sequence and expression data is expected to refine our current annotations and provide some insight into the evolution of gene regulation across organisms.
Results: We have investigated how well the protein subcellular localization and functional categories established from clustering of orthologous genes agree with gene-expression data in Saccharomyces cerevisiae. An increase in the resolution of biologically meaningful classes is observed upon the combination of experiments under different conditions. The functional categories deduced by sequence comparison approaches are, in general, preserved at the level of expression and can sometimes interact into larger co-regulated networks, such as the protein translation process. Differences and similarities in the expression between cytoplasmic-mitochondrial and interspecies translation machineries complement evolutionary information from sequence similarity.
Conclusions: Combination of several microarray experiments is a powerful tool for the identification of upstream regulatory motifs of yeast genes involved in protein synthesis. Comparison of these yeast co-regulated genes against the archaeal and bacterial operons indicates that the components of the protein translation process are conserved across organisms at the expression level with minor specific adaptations.
Published: 31 December 2002 GenomeBiology2002, 4:R4
The electronic version of this article is the complete one and can be found online at http://genomebiology.com/2002/4/1/R4
Received: 16 May 2002 Revised: 28 August 2002 Accepted: 31 October 2002
Background
During the past few years sequencing projects have provided the whole genomes of several bacterial [1,2], archaeal [3,4] and eukaryotic [5,6] organisms, including human [7,8]. This genomic information is valuable as, in principle, it encodes all the instructions necessary and sufficient for the life cycle
of each organism. Accurate annotation of genes to describe the gene products by their molecular function, subcellular localization and the biological process(es) they are involved in is crucial for the exploitation of genomic data [9]. Sequence annotation by similarity to known genes for which experimental data is available provides a rough initial
criterion by which to classify the genes of an organism into functional catalogs. These classifications have been shown to be useful, for example, for computational prediction of common upstream regions that might bind the same tran-scription factors [10].
Clusters of Orthologous Groups (COGs) is an example of functional classification based only on standard sequence-similarity methods. COGs is an elegant approach that has used all-against-all sequence comparison of proteins in com-plete genomes to elucidate groups, namely COGs, that contain a set of individual orthologous proteins or ortholo-gous sets of paralogs from different phylogenetic lineages [11-13]. Normally, orthologs are functionally equivalent pro-teins that arise from vertical evolution, whereas paralogs are the result of duplication events and their function may have diverted from the original ancestor. Each COG is repre-sented by a protein with a characterized function or domain. Individual COGs are assigned to general functional cate-gories, which represent major cellular processes, and in some cases, if known, to more specific pathways or systems. The COG functional categories are identified by one-letter codes (Table 1).
This functional classification of genes conserved across dif-ferent organisms has provided new information about how these catalogs of functions are maintained and modified across phylogenetic groups during evolution. However, in overpopulated COGs, the orthologous relationships between their members are difficult to delineate precisely. Such COGs might contain proteins that evolved new functions with respect to the original ancestor, and even though these pro-teins still have significant sequence similarity, at the entire sequence or the domain level, they may be part of different cellular processes. This may be a particular problem in the budding yeast COGs as it is the only eukaryotic organism to be included in the database; therefore, those of its proteins involved in biological processes characteristic of eukaryotes may not have the counterparts in bacterial and archaeal genomes required to enable a finer grouping.
To fully understand the dynamic molecular network in any organism, however, the static information provided by sequencing projects will have to be complemented by high-throughput biochemical data from deletion experiments, DNA hybridization arrays, quantitative proteomics, localiza-tion experiments and two-hybrid interaclocaliza-tion assays (for a review see [14]).
DNA hybridization experiments are a popular tool for moni-toring the differential expression of a large number of genes, even complete genomes, under several conditions (reviewed in [15]). Analysis of the data can uncover sets of genes with similar expression profiles. This is achieved either by com-parison against a set of genes whose expression behavior is already known for the conditions studied, or by unsupervised
classification algorithms that cluster all the genes without imposing any a prioriconstraints or knowledge [16]. Hints about the function of uncharacterized genes can be deduced from other members of the cluster. DNA microarrays of inter-genic regions have also been used for the study of putative binding sites for transcription regulators [17,18].
In the study presented here, we have investigated how well the expression of protein-coding genes in Saccharomyces cerevisiae agrees with the proteins’ subcellular localization and functional classification as defined by the S. cerevisiae
COG database. Using the available biological information on the yeast genes as the starting point, we have built groups of genes and compared the expression behavior of the proteins within and between these groups. The expression experi-ments included in our study comprise microarray data [16] of time series analyzing the effects of cell-cycle progression [19], sporulation [20], stress (temperature and reducing shocks) [21] and diauxic shift [22]. The data have been ana-lyzed as a whole and as individual experiments, and an increase in resolution of the classification was observed when several datasets were combined. Although the classes defined by the COGs are, in general, preserved during gene expression, it is possible to divide broad groups into sub-classes that reflect the oligomerization state of the proteins, subcellular location and/or more specific functionality, which sometimes clarify the boundaries of the cellular processes they are involved in. The results may be a comple-mentary tool for the COGs, especially for those containing many paralogs that cannot be distinguished by sequence comparison alone but whose expression profiles are clearly different. Finally, the set of genes involved in cytoplasmic protein translation was analyzed in detail and compared to bacterial and archaeal ‘ribosomal operons’ to investigate the conservation of this key process at the level of gene sequence and expression across phylogenetic groups.
Results
Overview of the experimental data
S. cerevisiae genes present in the COG database were extracted from Eisen’s dataset [16]. After removal of genes with low differential expression or too many missing time points, pairwise comparisons of the expression profiles of every possible gene pair were calculated for individual experiments and for the combined dataset by the standard Pearson correlation (see Materials and methods). The value of this comparison, the correlation coefficient (CCF), ranges from -1 to 1, indicating how different or similar, respectively, the compared expression profiles are.
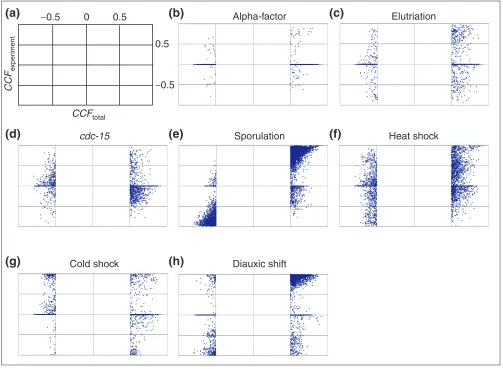
scaled enough to separate them, or because they are occa-sionally required in otherwise independent pathways to maintain a cellular state under certain conditions. If this were true, some gene pairs would be expected to give both positive and negative correlations depending on the experi-ment considered. In fact, 27% of all the possible gene pairs in the dataset fell into this category. Furthermore, the CCFs derived from a comparison of the whole expression profile of these conflicting pairs can still be significant, that is, above 0.5 or below -0.5 (Figure 1). However, this only affects less than 3% of all the pairs and it is probably due to an unbal-anced CCF by experiments with extremely high intensity peaks, as it might be the case with the sporulation data.
Protein subcellular localization versus gene expression
[image:3.609.313.555.98.334.2]The advantage of using a large number of time points in dif-ferent conditions to resolve finer relationships was also tested to determine whether the genes for proteins located in the same subcellular compartment tend to be transcribed at the same time.
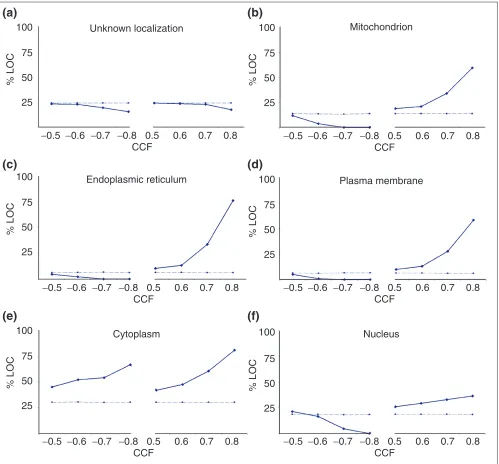
Figure 2 shows the results for the following compartments: plasma membrane, endoplasmic reticulum, mitochondrion, nucleus and cytoplasm. When a set of proteins of unknown localization (a probable mixture of proteins from different compartments), was analyzed as a control, the CCFs obtained approximated to those expected by chance
comment
reviews
reports
deposited research
interactions
information
refereed research
Table 1
COG codes for general function and pathway/systems
Code Genes Description General function
416 Information storage and processing
J 242 Translation, ribosomal structure and biogenesis
K 80 Transcription
L 94 DNA replication, recombination and repair 429 Metabolism
C 62 Energy production and conversion G 71 Carbohydrate transport and metabolism E 153 Amino acid transport and metabolism F 50 Nucleotide transport and metabolism H 54 Coenzyme metabolism
I 39 Lipid metabolism 226 Cellular processes
D 4 Cell division and chromosome partitioning O 98 Posttranslational modification, protein turnover,
chaperones
M 9 Cell envelope biogenesis, outer membrane N 6 Cell motility and secretion
P 71 Inorganic ion transport and metabolism T 38 Signal transduction mechanisms
127 Poorly characterized
R 119 General function prediction only
S 8 Function unknown
Pathway/system
- 613 No pathway/system assigned C1 2 Pyruvate decarboxylation
C2 18 TCA cycle
C3 3 Glyoxylate bypass E1 6 Arginine biosynthesis
E2 3 Phenylalanine/tyrosine biosynthesis E3 3 Tryptophan biosynthesis
E4 2 Threonine biosynthesis E5 1 Isoleucine biosynthesis E7 19 Leucine biosynthesis E8 7 Methionine biosynthesis E9 4 Proline biosynthesis E10 4 Histidine biosynthesis F1 15 Purine biosynthesis F2 3 Purine salvage F3 12 Pyrimidine biosynthesis F4 2 Pyrimidine salvage F5 7 Thymidylate biosynthesis
G1 4 Glycolysis
G2 14 Gluconeogenesis
G3 6 Pentose phosphate pathway G4 4 Entner-doudoroff pathway H1 8 Heme biosynthesis
Table 1(continued)
Code Genes Description H3 2 FAD biosynthesis H4 7 Biotin biosynthesis H5 1 NAD biosynthesis H6 7 Ubiquinone biosynthesis H7 3 Menaquinone biosynthesis H8 2 Thiamine biosynthesis
H9 1 Pyridoxal phosphate biosynthesis I1 10 Fatty acid biosynthesis
J1 26 Translation factors and enzymes involved in translation
J2 30 Aminoacyl-tRNA synthetases, amino acid activation J3 47 Ribosomal proteins - small subunit
J4 77 Ribosomal proteins - large subunit K1 14 DNA-dependent RNA polymerase subunits K2 7 Basal transcription factors
K3 2 Transcriptional regulators L1 20 Basal replication machinery
[image:3.609.58.306.117.741.2](Figure 2a). The expression of genes whose products will end up in mitochondria, endoplasmic reticulum or plasma mem-brane all show similar trends (Figure 2b-d). The expression of gene pairs from the same compartment shows few nega-tive correlations and many strong posinega-tive correlations, especially at very high cutoffs. There is a similar trend for nuclear proteins (Figure 2f); however, its slope is lower, because some nuclear proteins are tightly co-expressed with a considerable number of cytoplasmic proteins involved in protein translation. The cytoplasm behaves as expected with respect to positive correlations, but its proteins correlated negatively more than expected (Figure 2e). This may reflect the fact that, although subcellular compartments are usually populated by proteins involved in specialized interconnected
processes [23], the cytoplasm holds a considerable number of different processes that can be independent or mutually exclusive of each other.
[image:4.609.54.557.87.456.2]The trends of Figure 2 were not so obvious when analyzing individual experiments (data not shown). In particular, two datasets for cell division - the dataset synchronized by elutri-ation and the sporulelutri-ation experiment - as well as the cold-shock series, showed little discrimination between the expression of proteins from different compartments. This could be due to the reduced number of time points in the experiments, limiting the resolution of the classes. It is also possible that the quality of some experiments was somewhat poor, in particular in the case of the cell-division experiment
Figure 1
Correlation inconsistency in the expression of some gene pairs between different experiments. For each gene pair, CCF values obtained from combining expression profiles of all experiments (CCFTOTAL, x-axis) are plotted versus those of individual experiments (CCFEXPERIMENT, y-axis). Only gene pairs with a CCFTOTALvalue above 0.5 or below -0.5 are shown. x- and y-axis values go from -1 to 1 in steps of 0.5 as depicted in (a). (b-d) Genes involved in the cell cycle: (b) alpha-factor, (c) elutriation and (d) cdc-15strain. (e) Sporulation. (f,g)Response to stress: (f) heat and (g) cold shocks. (h)Diauxic shift.
CCFEXPERIMENTvalues can spread over a considerable range regardless of their CCFTOTAL(for example, heat shock), even to the point of being significant
and with opposite sign to CCFTOTAL(for example, cold stress and diauxic shift). This inconsistency is less pronounced in the sporulation data, perhaps because it contains very high intensity values that may bias the CCFTOTALto be more similar to CCFspo. Note that only genes whose expression was increased or decreased by 2.3-fold were considered. Those that did not pass the filtering were given a value equal to zero.
Alpha-factor
Elutriation
cdc-15
Sporulation
Heat shock
Cold shock
Diauxic shift
CCF
totalCCF
e
xper
iment
−
0.5
0.5
0.5
−
0.5
0
(a)
(b)
(c)
(d)
(e)
(f)
synchronized by elutriation because of the difficulty of obtaining synchronized cells just by size separation.
COG functional classes of the genes in the expression data
Table 1 summarizes the distribution of the COG functional categories of theS. cerevisiaegenes in the microarray data. The highest number of orthologs is found in metabolic
processes (CGEFHI), followed by the machinery for storage and processing of information (JKL), especially those genes involved in protein translation (J). Under-represented groups are genes involved in ‘Cell division and chromosome partitioning’ (D), ‘Cell envelope biogenesis’ (M), ‘Cell motil-ity and secretion’ (N), and ‘Signal transduction mechanisms’ (T). This may reflect a bias in the number of genes for each class in the dataset but also the current bias of the COGs due
comment
reviews
reports
deposited research
interactions
information
[image:5.609.57.556.86.550.2]refereed research
Figure 2
Proteins localized in the same compartment tend to be expressed at the same time. The plots show the trend for the percentage of genes from the same compartment (%LOC, y-axis) with respect to the total number of genes to which they correlate at a given threshold (CCF, x-axis). The solid lines correspond to the values obtained from the experimental data, whereas the dashed lines are the values expected by chance. The expected trend matches with that of a set of proteins with unknown localization (a), in contrast to sets of proteins with identified compartment: (b) mitochondrion,
(c)endoplasmic reticulum, (d) plasma membrane, (e) cytoplasm and (f) nucleus.
Unknown localization
Mitochondrion
Plasma membrane
Nucleus
Cytoplasm
Endoplasmic reticulum
CCF
% LOC
−
0.5
−
0.6
−
0.7
−
0.8
0.5
0.6
0.7
0.8
100
75
50
25
CCF
% LOC
−
0.5
−
0.6
−
0.7
−
0.8
0.5
0.6
0.7
0.8
100
75
50
25
CCF
% LOC
−
0.5
−
0.6
−
0.7
−
0.8
0.5
0.6
0.7
0.8
100
75
50
25
CCF
% LOC
−
0.5
−
0.6
−
0.7
−
0.8
0.5
0.6
0.7
0.8
100
75
50
25
CCF
% LOC
−
0.5
−
0.6
−
0.7
−
0.8
0.5
0.6
0.7
0.8
100
75
50
25
CCF
% LOC
−
0.5
−
0.6
−
0.7
−
0.8
0.5
0.6
0.7
0.8
100
75
50
25
(a)
(b)
(c)
(d)
to the over-representation of bacterial and archaeal organ-isms compared to eukaryotes. Whereas core processes, such as metabolism and information-handling mechanisms, are conserved in all the phylogenetic lineages, other processes will be representative of their evolutionary group. For example, the proportion of proteins associated with intra-and intercellular communication will be higher in eukary-otes, especially in higher organisms [24].
Table 1 also shows the distribution of the genes with respect to known pathways and functional systems defined in the COGs. Most of them are not assigned to any system/pathway. The populated group corresponding to the protein transla-tion system is split into four finer subclasses.
Overall expression behavior of predefined functional classes
Assuming that three characteristics (COG general function (F), COG pathway/system (P), and subcellular location (L)) can be assigned to every gene, the following combinations were considered to compare the expression behavior of the genes with respect to their annotation: F--, -P-, FP-, F-L, -PL and FPL. For example, class F-- will contain all the gene pairs in which both members have the same general function regardless of their pathway/system and subcellular location. Therefore, the FPL class will hold pairs in which both genes have the same general function, pathway/system (if any) and location. The localization included only two possibilities, mitochondrial or non-mitochondrial genes. Only mitochon-drial genes were considered, because this was a large group with a clear positive correlation (Figure 2b). A diagram with detailed examples of some classifications can be found in the additional data files.
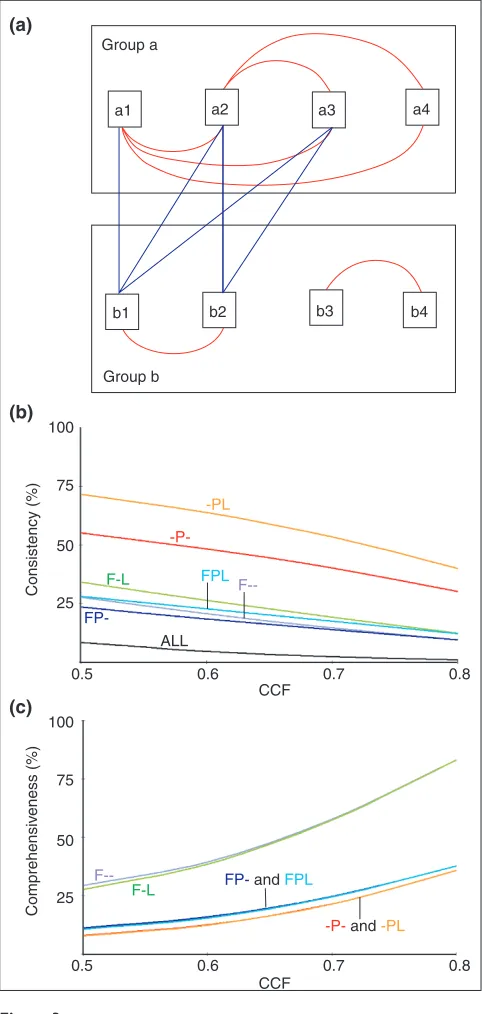
Any a priori classification scheme should consider the quality of the resulting classes and the number (and charac-teristics) of the elements not included. The elements of high-quality classes should show consistent relations between them as a whole; in this case all the genes should have similar expression profiles. Usually, consistent classes will tend to have few elements and thus consideration of which genes are not included may be important because strict clas-sifications may leave out significantly correlating gene pairs. In our study, the overall trend of the gene pairs for each clas-sification was studied in two different ways. These two ways are depicted in Figure 3a.
The first reflects the ‘consistency’ of a class. This measure describes the proportion of all the possible gene pairs in each class that correlate significantly at a given CCF value (see Materials and methods). The consistency of a class in which the expression of all the genes is induced or repressed at the same time will be higher than other classes where only sub-groups of genes are significantly co-regulated. Figure 3b shows the results for a range of CCF values, from 0.5 to 0.8. The classes can be grouped into three sets. The one at the
bottom (class ALL) gives the poorest consistency and corre-sponds to all gene pairs without an initial functional pre-grouping. The middle set contains four classes, the ones incorporating the general function, that is, F--, FP-, F-L and FPL. This set presents higher consistency, but further sub-grouping would raise it. The third set, containing -P- and -PL, is at the top, indicating that the original groups defined by this notation are consistent and maintained even at very high thresholds. The group with the highest consistency is that combining pathway and mitochondrial location infor-mation. This suggests that processes are best characterized when their compartments are also taken into account (which is true, at least in this case, mainly because it allows the sep-aration of the cytoplasmic and mitochondrial ribosomes). Neither of these classes contains more than 3% of their gene pairs when using an equivalent negative correlation range, from -0.5 to -0.8 (not shown).
The second measure, ‘comprehensiveness’, tackles the ques-tion of how many of the significantly correlated gene pairs are included by these classification schemes. A broad classi-fication will miss less correlating pairs (that is, it is more comprehensive) than other classification in which the groups are very specific (probably very consistent) but in which relationships between some groups may have been left out. The ‘comprehensiveness’ is assessed by calculating the proportion of correlated gene pairs for each classification with respect to the total number of correlated gene pairs in the whole dataset at a given threshold (Materials and methods). For positive thresholds two sets can be observed (Figure 3c). The set with higher number of pairs contains F--and F-L, F--and the second one all the P groups (-P-, FP-, -PL and FPL). The results indicate that for broad classification schemes, F-- and F-L, the higher the threshold, the more similar the expression behavior of the genes with respect to their annotation. On the other hand, when considering groups with ‘better defined boundaries’ (that is, -P-, -PL, FP-and FPL), the relationships between subclasses are expected to be more important. An example is the protein translation category J. Although many genes in this category can be assigned to a more specific system, for example, initiation and termination factors or ribosomal subunits, they all will work together during protein synthesis. Therefore, by con-sidering very specific groups we will miss the relationships between them.
The next sections tackle the comparison of the expression profiles of gene pairs for each functional group, how their members can sometimes split into more functionally consis-tent subgroups and which of the resulting subgroups may act together in the same cellular processes.
Subgrouping of genes with the same FPL
were split into subgroups according to the similarity of their expression profiles as described in Materials and methods.
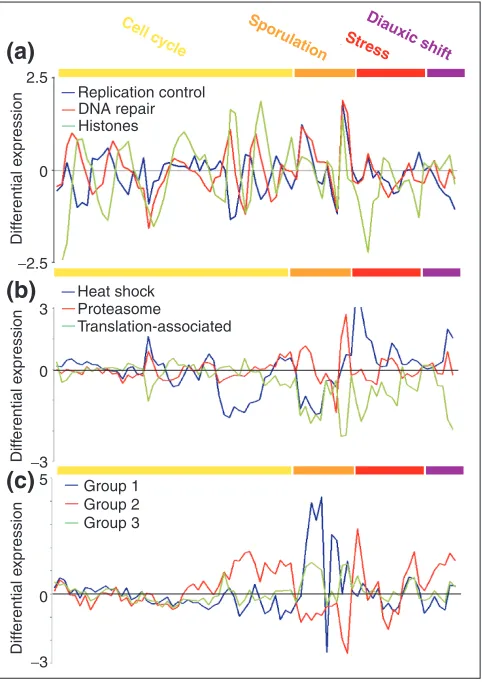
Figure 4a shows an example of three subgroups obtained from genes preassigned to the class ‘L - -’; their COG general function is ‘DNA replication, recombination and repair’ (L), they have not been assigned to any pathway nor are they localized in the mitochondrion. The averaged profiles of the subgroups suggest that they are periodically regulated during
the cell cycle. First, a subgroup of genes involved mainly in replication control is expressed, followed by a subgroup con-taining genes with DNA-repair functions, and finally the histone subgroup. This agrees well with some of the major processes taking place during cellular division: arrest of the cell cycle until everything is ready for division, DNA repair to ensure the fidelity in the transmission of the information to the daughter cells during DNA replication, and then chromo-some condensation before mitosis. The periodicity is not observed in the sporulation data, probably because the experiment was not designed to take fine enough points to resolve these groups. In fact, the subgroups split at low thresholds (0.5) when analyzing individual experiments of the cell cycle separately. It is only when combining all the experiments that a higher cutoff (0.7) is needed because of the overlap of peaks in the sporulation series.
Another example is the subgrouping within the set ‘O - -’ (that is, ‘post-translational modification, protein turnover and chaperones’). Figure 4b shows three subgroups with dis-tinguishable expression. The heat-shock protein subgroup is repressed in the cdc-15 and sporulation experiments, but induced under stress and during diauxic shift. On the other hand, the proteasome is only differentially expressed in the sporulation experiments. Finally, the third subgroup con-tains three proteins: PDR13, SSB2 and FPR4. PDR13 and SSB2 are both Hsp70 homologs. PDR13 interacts with Zuo1p to form a ribosome-associated complex [25]. SSB2 is also
comment
reviews
reports
deposited research
interactions
information
[image:7.609.56.297.221.728.2]refereed research
Figure 3
-PL
-P-ALL
F-L FPL
F--
FP-
F--F-L FP- and FPL
-P- and -PL
Comprehensiv
eness (%)
Consistency (%)
a1 a2 a3 a4
b1 b2 b3 b4
Group a
Group b
(a)
(b)
(c)
0.5 100
75
50
25
100
75
50
25
0.6 0.7
CCF
CCF
0.8
0.5 0.6 0.7 0.8
Figure 3
Agreement of functional annotation and expression data of genes. (a)Two groups of genes obtained after an a prioriclassification by, for example, functional annotation. The red lines connecting the elements within each group represent significant similarity between their expression profiles. The number of red lines with respect to all possible ones gives and indication of the consistency of the group. Thus, group a is very consistent, as all the possible connections but one, a3-a4, are made. On the other hand, the consistency of group b is poorer, as its elements form two subgroups (b1-b2 and b3-b4). The blue lines connecting the elements between each group are relations lost upon the a priori classification used. The higher the number of lost connections the less comprehensive the classification will be. In this case, the subgroup b1-b2 significantly correlates with group a. (b)Consistency of the functional groups established by gene annotation. A decreasing trend implies loss of interactions between members. F--, -P-, FP-, F-L, -PL and FPL indicate functional classes as defined in the text. For example, class F-- contains all gene pairs in which both members have the same general function regardless of their pathway/system (P) or location (L), class FP- contains all gene pairs with the same general function and the same
associated with translating ribosomes and it may bind directly the nascent polypeptide chains [26]. FPR4 is a pre-dicted peptidyl-prolyl cis-transisomerase. The expression of this subgroup will be shown later to be associated to the cytoplasmic translation machinery and therefore it may have a role in folding of newly synthesized proteins.
Subgrouping of paralogs in populated COGs
At this point it is worth considering some examples of how similar the differential expression of paralogs is. The
overpopulation of genes in a COG can be due to the presence of: duplicated genes which may or may not be involved in the same cellular process; functionally equivalent orthologs that are the result of an ancient horizontal gene transfer (for example, mitochondrial ribosomal genes); and promiscuous domains that are found in proteins that are not necessarily functionally related. An example of the latter is COG0515, which holds a number of proteins containing Ser/Thr protein kinase domains. The expression of these genes was diverse and the CCF values for all the different pairs varied between -0.8 and 0.8.
COG0477 is an example of a COG populated with paralogs. This group is a collection of various homologous permeases of the major facilitator superfamily [27]. Figure 4c shows some of the groups obtained by analysis of the expression of the genes in this COG. The proteins naturally form sub-groups according to their differential expression. Group 1 contains SEO1, HXT10 and HXT14. SEO1 is a putative per-mease similar to the allantoate perper-mease family, also called anion:cation symporter. HXT10 and HXT14 belong to the sugar transporter family, although none of them seems to transport glucose [28]. Group 2 contains four of the six major hexose transporters in yeast: HXT3, HXT4, HXT6 and HXT7 [29]. Finally, group 3 contains the genes HXT9, HXT11 and HXT12. None of them is a glucose transporter. In fact, HXT12 is not functional for hexose transport when overexpressed in a mutant lacking all HXT genes [30], whereas HXT9 and HXT11 may be involved in pleiotropic uptake of chemotherapeutic drugs, since a hxt9-hxt11
double-null mutant shows increased resistance to a number of drugs [31].
This could be taken as an example of the potential for finer subgrouping within COGs by comparing functional-expres-sion information of proteins with similar primary structure.
Cross-talk between functional subgroups
The next step was to compare the calculated subgroups to find out how they could be related to each other. For that, the expression profiles of the genes in each selected group were averaged. The averaged profiles of these sub-groups, representing all the functional classes, were then correlated and clustered according to their similarity (see Materials and methods).
At 0.71 threshold, a large number of the subgroups did not have a correlating partner, and only three sets were found to contain more than one subgroup. These sets represented two highly conserved processes in living organisms: protein translation (both mitochondrial and cytoplasmic), and DNA replication.
[image:8.609.56.297.87.428.2]Figure 5 shows the DNA replication set. The four averaged profiles of the functional subgroups, including the ‘L - -’ sub-group of DNA-repair genes, are all very similar (Figure 5a)
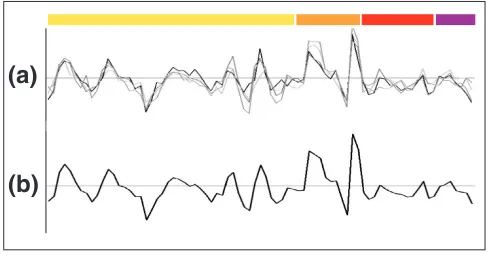
Figure 4
Examples of gene subgrouping within broad functional classes. Expression profiles for several sets of genes after combining experiments under different conditions. The experiments are color-coded (upper bar) as follows: yellow (cell cycle), orange (sporulation), red (stress) and purple (diauxic shift). (a)Subgroups obtained from the ‘L - -’ class (‘DNA replication, recombination and repair’). (b)Subgroups obtained from the ‘O - -’ class (‘post-translational modification, protein turnover and chaperones’). (c)Subgroups obtained from the ‘GEPR - -’ class, which contains permeases of the major facilitator superfamily. GEPR comprises several functional groups reflecting that their actual function is not clear (R) although they may be involved in the transport of sugars (G), amino-acids (E) and inorganic ions (P). The vertical axis represents the differential expression of genes as the log ratio of the mRNA abundance in experimental versus control samples. At zero values, the mRNA levels are identical. The list of genes included in every subgroup can be found in the additional data files.
Replication control DNA repair Histones
Heat shock
Group 1 Group 2 Group 3
Cell c
ycle Stress
Sporulation Diauxic shift
Diff
erential e
xpression
Diff
erential e
xpression
Diff
erential e
xpression
Proteasome
Translation-associated 2.5
−2.5 0
3
−3 5
−3 0
0
(a)
(b)
and the resulting total average (Figure 5b) clearly retains the periodic features observed already in Figure 4a. In addition to the subgroup involved in DNA repair (genes: MSH2,
MSH6, RAD51, OGG1), this class also contains subgroups involved in thymidylate biosynthesis ‘F F5 -’ (genes: DUT1,
RNR1, RNR3, CDC21), basal replication machinery ‘L L1 -’ (genes: RFA1, POL2, POL30), and cell division and chromo-some partitioning ‘D - -’ (genes: SMC3, RHC18).
The mitochondrial translation set only included subgroups with general function J (protein translation), that is, transla-tion factors (J1), aminoacyl-tRNA synthetases (J2), and the ribosomal proteins (J3 and J4). In contrast, the cytoplasmic translation set included several other functional subgroups in addition to the J ones.
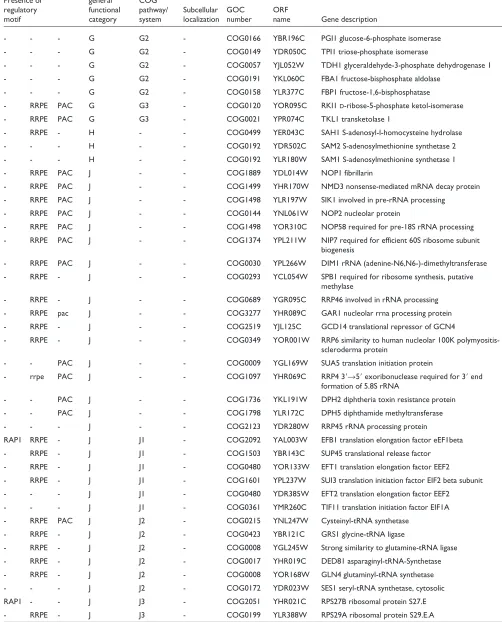
Cytoplasmic protein translation set
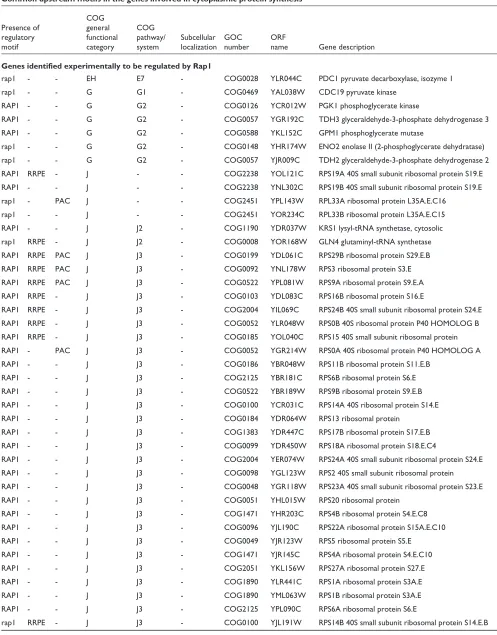
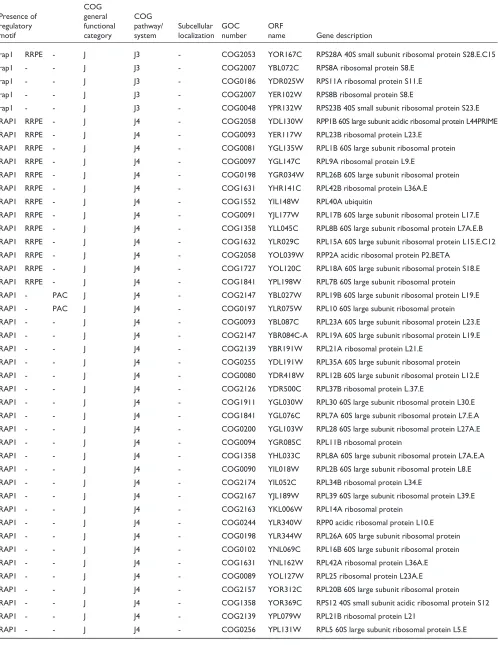
A quick survey of the COG functional categories of the pro-teins in the set provides a good overview of the processes related to protein synthesis (Table 2). These are: E (general amino-acid metabolism, including leucine synthesis, E7), F (general nucleotide metabolism, including purine and pyrimidine biosynthesis, F1 and F3 respectively, and purine salvage, F2), G (general carbohydrate metabolism, including glycolysis, G1, gluconeogenesis, G2, and pentose phosphate pathway, G3), H (general coenzyme metabolism, including menaquinone biosynthesis, H7), J (general translation, including translation factors, J1, aminoacyl-tRNA syn-thetases, J2, and ribosomal proteins for the small subunit, J3, and large subunit, J4), K (general transcription, includ-ing DNA-dependent RNA polymerases, K1) and L (general DNA handling, although it mainly contains helicases and RNA-processing proteins).
The key player in the translation process, the ribosome, is accompanied by its cofactors, RNA polymerases and RNA-handling proteins. These include proteins related to the
spliceosome, which was expected as mRNA splicing is mostly devoted to ribosomal proteins in yeast [32]. In addi-tion, a number of other processes may also be necessary for a successful translation. These back-up processes may feed the raw materials necessary for the synthesis of riboso-mal/messenger RNA (sugar and nucleotide metabolism) as well as polypeptide chains (amino-acid metabolism). However, the tight association of the translation machinery with sugar metabolism may also reflect the close relation between the amount of nutrients in the environment and cellular growth [32].
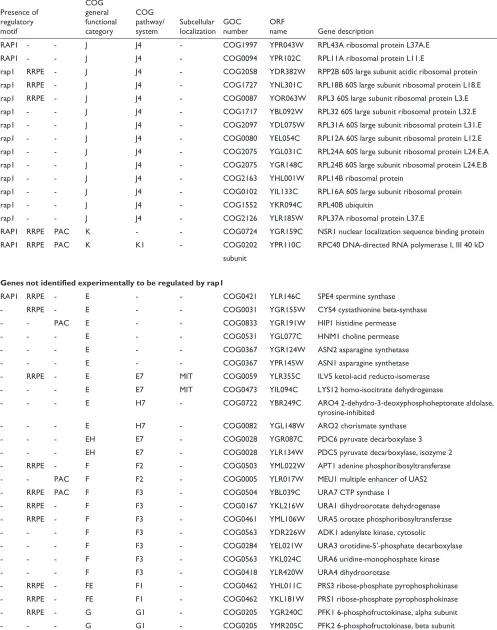
The fact that these functional subgroups come together when very different experiments are analyzed supports the hypothesis that their transcription may indeed be co-regu-lated. Therefore, the upstream regions of the genes encoding these proteins might share common motifs that may serve as binding sites for the same transcription factors. A computa-tional analysis of the upstream regions of this gene subset was carried out to investigate the presence of common local sequences (Materials and methods). Three significant motifs were found: rap1, rrpe and pac. The results are summarized in Table 2 and the sequence consensus for each motif shown in Figure 6.
It is well known that repressor-activator P protein 1 (Rap1) targets upstream motifs of a number of ribosomal protein genes (RPG) as well as being central to the cellular economy during rapid growth [33]. Previous experimental studies have uncovered a number of genes regulated by Rap1 including RPGs and genes involved in protein synthesis and sugar metabolism [18]. Approximately half the genes in our set were identified in that study as targets of Rap1. However, the rap1 motif was not found in 25% of these genes, perhaps because they have a degenerate sequence, weaker for com-putational detection. On the other hand, additional putative rap1 motifs were found in some of the genes that had not been identified previously as Rap1 targets, including genes involved in amino-acid synthesis (SPE4), and genes for a translation elongation factor (EFB1) and a ribosomal protein (RPS27B).
Rrpe is an experimentally uncharacterized motif that has been suggested by computational studies to be specific for rRNA-processing genes [10]. The PAC box (pac motif), which stands for polymerase A and C box, has been found to be conserved in at least 10 genes encoding subunits of RNA polymerases A and C [34], although neither a function nor a
trans-acting factor for this motif has been identified. We have identified a number of new genes containing rrpe and pac motifs in their upstream regions.
Genes with either only rap1 (33%) or only rrpe (16%) motifs were frequent, as were genes with a combination of rrpe and pac (around 12%) and rap1 and rrpe (around 13%). The other combinations (pac, rap1/pac and rap1/rrpe/pac) were very
comment
reviews
reports
deposited research
interactions
information
[image:9.609.54.298.544.679.2]refereed research
Figure 5
‘DNA replication-related’ genes. The experiments are color-coded as in Figure 4. (a)The four subgroups with very similar periodic profiles are shown. As mentioned in the text, they correspond to DNA repair and replication, thymidylate biosynthesis, and chromosome partitioning. (b) Profile obtained by averaging those shown in (a).
(a)
Table 2
Common upstream motifs in the genes involved in cytoplasmic protein synthesis
COG
Presence of general COG
regulatory functional pathway/ Subcellular GOC ORF
motif category system localization number name Gene description Genes identified experimentally to be regulated by Rap1
rap1 - - EH E7 - COG0028 YLR044C PDC1 pyruvate decarboxylase, isozyme 1
rap1 - - G G1 - COG0469 YAL038W CDC19 pyruvate kinase
RAP1 - - G G2 - COG0126 YCR012W PGK1 phosphoglycerate kinase
RAP1 - - G G2 - COG0057 YGR192C TDH3 glyceraldehyde-3-phosphate dehydrogenase 3
RAP1 - - G G2 - COG0588 YKL152C GPM1 phosphoglycerate mutase
rap1 - - G G2 - COG0148 YHR174W ENO2 enolase II (2-phosphoglycerate dehydratase)
rap1 - - G G2 - COG0057 YJR009C TDH2 glyceraldehyde-3-phosphate dehydrogenase 2
RAP1 RRPE - J - - COG2238 YOL121C RPS19A 40S small subunit ribosomal protein S19.E RAP1 - - J - - COG2238 YNL302C RPS19B 40S small subunit ribosomal protein S19.E
rap1 - PAC J - - COG2451 YPL143W RPL33A ribosomal protein L35A.E.C16
rap1 - - J - - COG2451 YOR234C RPL33B ribosomal protein L35A.E.C15
RAP1 - - J J2 - COG1190 YDR037W KRS1 lysyl-tRNA synthetase, cytosolic
rap1 RRPE - J J2 - COG0008 YOR168W GLN4 glutaminyl-tRNA synthetase
RAP1 RRPE PAC J J3 - COG0199 YDL061C RPS29B ribosomal protein S29.E.B
RAP1 RRPE PAC J J3 - COG0092 YNL178W RPS3 ribosomal protein S3.E
RAP1 RRPE PAC J J3 - COG0522 YPL081W RPS9A ribosomal protein S9.E.A
RAP1 RRPE - J J3 - COG0103 YDL083C RPS16B ribosomal protein S16.E
RAP1 RRPE - J J3 - COG2004 YIL069C RPS24B 40S small subunit ribosomal protein S24.E
RAP1 RRPE - J J3 - COG0052 YLR048W RPS0B 40S ribosomal protein P40 HOMOLOG B
RAP1 RRPE - J J3 - COG0185 YOL040C RPS15 40S small subunit ribosomal protein
RAP1 - PAC J J3 - COG0052 YGR214W RPS0A 40S ribosomal protein P40 HOMOLOG A
RAP1 - - J J3 - COG0186 YBR048W RPS11B ribosomal protein S11.E.B
RAP1 - - J J3 - COG2125 YBR181C RPS6B ribosomal protein S6.E
RAP1 - - J J3 - COG0522 YBR189W RPS9B ribosomal protein S9.E.B
RAP1 - - J J3 - COG0100 YCR031C RPS14A 40S ribosomal protein S14.E
RAP1 - - J J3 - COG0184 YDR064W RPS13 ribosomal protein
RAP1 - - J J3 - COG1383 YDR447C RPS17B ribosomal protein S17.E.B
RAP1 - - J J3 - COG0099 YDR450W RPS18A ribosomal protein S18.E.C4
RAP1 - - J J3 - COG2004 YER074W RPS24A 40S small subunit ribosomal protein S24.E
RAP1 - - J J3 - COG0098 YGL123W RPS2 40S small subunit ribosomal protein
RAP1 - - J J3 - COG0048 YGR118W RPS23A 40S small subunit ribosomal protein S23.E
RAP1 - - J J3 - COG0051 YHL015W RPS20 ribosomal protein
RAP1 - - J J3 - COG1471 YHR203C RPS4B ribosomal protein S4.E.C8
RAP1 - - J J3 - COG0096 YJL190C RPS22A ribosomal protein S15A.E.C10
RAP1 - - J J3 - COG0049 YJR123W RPS5 ribosomal protein S5.E
RAP1 - - J J3 - COG1471 YJR145C RPS4A ribosomal protein S4.E.C10
RAP1 - - J J3 - COG2051 YKL156W RPS27A ribosomal protein S27.E
RAP1 - - J J3 - COG1890 YLR441C RPS1A ribosomal protein S3A.E
RAP1 - - J J3 - COG1890 YML063W RPS1B ribosomal protein S3A.E
RAP1 - - J J3 - COG2125 YPL090C RPS6A ribosomal protein S6.E
comment
reviews
reports
deposited research
interactions
information
[image:11.609.57.555.103.748.2]refereed research
Table 2(continued)
COG
Presence of general COG
regulatory functional pathway/ Subcellular GOC ORF
motif category system localization number name Gene description
rap1 RRPE - J J3 - COG2053 YOR167C RPS28A 40S small subunit ribosomal protein S28.E.C15
rap1 - - J J3 - COG2007 YBL072C RPS8A ribosomal protein S8.E
rap1 - - J J3 - COG0186 YDR025W RPS11A ribosomal protein S11.E
rap1 - - J J3 - COG2007 YER102W RPS8B ribosomal protein S8.E
rap1 - - J J3 - COG0048 YPR132W RPS23B 40S small subunit ribosomal protein S23.E RAP1 RRPE - J J4 - COG2058 YDL130W RPP1B 60S large subunit acidic ribosomal protein L44PRIME
RAP1 RRPE - J J4 - COG0093 YER117W RPL23B ribosomal protein L23.E
RAP1 RRPE - J J4 - COG0081 YGL135W RPL1B 60S large subunit ribosomal protein
RAP1 RRPE - J J4 - COG0097 YGL147C RPL9A ribosomal protein L9.E
RAP1 RRPE - J J4 - COG0198 YGR034W RPL26B 60S large subunit ribosomal protein
RAP1 RRPE - J J4 - COG1631 YHR141C RPL42B ribosomal protein L36A.E
RAP1 RRPE - J J4 - COG1552 YIL148W RPL40A ubiquitin
RAP1 RRPE - J J4 - COG0091 YJL177W RPL17B 60S large subunit ribosomal protein L17.E RAP1 RRPE - J J4 - COG1358 YLL045C RPL8B 60S large subunit ribosomal protein L7A.E.B RAP1 RRPE - J J4 - COG1632 YLR029C RPL15A 60S large subunit ribosomal protein L15.E.C12
RAP1 RRPE - J J4 - COG2058 YOL039W RPP2A acidic ribosomal protein P2.BETA
RAP1 RRPE - J J4 - COG1727 YOL120C RPL18A 60S large subunit ribosomal protein S18.E RAP1 RRPE - J J4 - COG1841 YPL198W RPL7B 60S large subunit ribosomal protein RAP1 - PAC J J4 - COG2147 YBL027W RPL19B 60S large subunit ribosomal protein L19.E RAP1 - PAC J J4 - COG0197 YLR075W RPL10 60S large subunit ribosomal protein RAP1 - - J J4 - COG0093 YBL087C RPL23A 60S large subunit ribosomal protein L23.E RAP1 - - J J4 - COG2147 YBR084C-A RPL19A 60S large subunit ribosomal protein L19.E
RAP1 - - J J4 - COG2139 YBR191W RPL21A ribosomal protein L21.E
RAP1 - - J J4 - COG0255 YDL191W RPL35A 60S large subunit ribosomal protein
RAP1 - - J J4 - COG0080 YDR418W RPL12B 60S large subunit ribosomal protein L12.E
RAP1 - - J J4 - COG2126 YDR500C RPL37B ribosomal protein L.37.E
RAP1 - - J J4 - COG1911 YGL030W RPL30 60S large subunit ribosomal protein L30.E RAP1 - - J J4 - COG1841 YGL076C RPL7A 60S large subunit ribosomal protein L7.E.A RAP1 - - J J4 - COG0200 YGL103W RPL28 60S large subunit ribosomal protein L27A.E
RAP1 - - J J4 - COG0094 YGR085C RPL11B ribosomal protein
RAP1 - - J J4 - COG1358 YHL033C RPL8A 60S large subunit ribosomal protein L7A.E.A RAP1 - - J J4 - COG0090 YIL018W RPL2B 60S large subunit ribosomal protein L8.E
RAP1 - - J J4 - COG2174 YIL052C RPL34B ribosomal protein L34.E
RAP1 - - J J4 - COG2167 YJL189W RPL39 60S large subunit ribosomal protein L39.E
RAP1 - - J J4 - COG2163 YKL006W RPL14A ribosomal protein
RAP1 - - J J4 - COG0244 YLR340W RPP0 acidic ribosomal protein L10.E
RAP1 - - J J4 - COG0198 YLR344W RPL26A 60S large subunit ribosomal protein
RAP1 - - J J4 - COG0102 YNL069C RPL16B 60S large subunit ribosomal protein
RAP1 - - J J4 - COG1631 YNL162W RPL42A ribosomal protein L36A.E
RAP1 - - J J4 - COG0089 YOL127W RPL25 ribosomal protein L23A.E
RAP1 - - J J4 - COG2157 YOR312C RPL20B 60S large subunit ribosomal protein
RAP1 - - J J4 - COG1358 YOR369C RPS12 40S small subunit acidic ribosomal protein S12
RAP1 - - J J4 - COG2139 YPL079W RPL21B ribosomal protein L21
Table 2(continued)
COG
Presence of general COG
regulatory functional pathway/ Subcellular GOC ORF
motif category system localization number name Gene description
RAP1 - - J J4 - COG1997 YPR043W RPL43A ribosomal protein L37A.E
RAP1 - - J J4 - COG0094 YPR102C RPL11A ribosomal protein L11.E
rap1 RRPE - J J4 - COG2058 YDR382W RPP2B 60S large subunit acidic ribosomal protein rap1 RRPE - J J4 - COG1727 YNL301C RPL18B 60S large subunit ribosomal protein L18.E rap1 RRPE - J J4 - COG0087 YOR063W RPL3 60S large subunit ribosomal protein L3.E rap1 - - J J4 - COG1717 YBL092W RPL32 60S large subunit ribosomal protein L32.E rap1 - - J J4 - COG2097 YDL075W RPL31A 60S large subunit ribosomal protein L31.E rap1 - - J J4 - COG0080 YEL054C RPL12A 60S large subunit ribosomal protein L12.E rap1 - - J J4 - COG2075 YGL031C RPL24A 60S large subunit ribosomal protein L24.E.A rap1 - - J J4 - COG2075 YGR148C RPL24B 60S large subunit ribosomal protein L24.E.B
rap1 - - J J4 - COG2163 YHL001W RPL14B ribosomal protein
rap1 - - J J4 - COG0102 YIL133C RPL16A 60S large subunit ribosomal protein
rap1 - - J J4 - COG1552 YKR094C RPL40B ubiquitin
rap1 - - J J4 - COG2126 YLR185W RPL37A ribosomal protein L37.E
RAP1 RRPE PAC K - - COG0724 YGR159C NSR1 nuclear localization sequence binding protein RAP1 RRPE PAC K K1 - COG0202 YPR110C RPC40 DNA-directed RNA polymerase I, III 40 kD
subunit
Genes not identified experimentally to be regulated by rap1
RAP1 RRPE - E - - COG0421 YLR146C SPE4 spermine synthase
- RRPE - E - - COG0031 YGR155W CYS4 cystathionine beta-synthase
- - PAC E - - COG0833 YGR191W HIP1 histidine permease
- - - E - - COG0531 YGL077C HNM1 choline permease
- - - E - - COG0367 YGR124W ASN2 asparagine synthetase
- - - E - - COG0367 YPR145W ASN1 asparagine synthetase
- RRPE - E E7 MIT COG0059 YLR355C ILV5 ketol-acid reducto-isomerase
- - - E E7 MIT COG0473 YIL094C LYS12 homo-isocitrate dehydrogenase
- - - E H7 - COG0722 YBR249C ARO4 2-dehydro-3-deoxyphosphoheptonate aldolase,
tyrosine-inhibited
- - - E H7 - COG0082 YGL148W ARO2 chorismate synthase
- - - EH E7 - COG0028 YGR087C PDC6 pyruvate decarboxylase 3
- - - EH E7 - COG0028 YLR134W PDC5 pyruvate decarboxylase, isozyme 2
- RRPE - F F2 - COG0503 YML022W APT1 adenine phosphoribosyltransferase
- - PAC F F2 - COG0005 YLR017W MEU1 multiple enhancer of UAS2
- RRPE PAC F F3 - COG0504 YBL039C URA7 CTP synthase 1
- RRPE - F F3 - COG0167 YKL216W URA1 dihydroorotate dehydrogenase
- RRPE - F F3 - COG0461 YML106W URA5 orotate phosphoribosyltransferase
- - - F F3 - COG0563 YDR226W ADK1 adenylate kinase, cytosolic
- - - F F3 - COG0284 YEL021W URA3 orotidine-5’-phosphate decarboxylase
- - - F F3 - COG0563 YKL024C URA6 uridine-monophosphate kinase
- - - F F3 - COG0418 YLR420W URA4 dihydroorotase
- RRPE - FE F1 - COG0462 YHL011C PRS3 ribose-phosphate pyrophosphokinase
- RRPE - FE F1 - COG0462 YKL181W PRS1 ribose-phosphate pyrophosphokinase
- RRPE - G G1 - COG0205 YGR240C PFK1 6-phosphofructokinase, alpha subunit
comment
reviews
reports
deposited research
interactions
information
[image:13.609.52.554.119.741.2]refereed research
Table 2(continued)
COG
Presence of general COG
regulatory functional pathway/ Subcellular GOC ORF
motif category system localization number name Gene description
- - - G G2 - COG0166 YBR196C PGI1 glucose-6-phosphate isomerase
- - - G G2 - COG0149 YDR050C TPI1 triose-phosphate isomerase
- - - G G2 - COG0057 YJL052W TDH1 glyceraldehyde-3-phosphate dehydrogenase 1
- - - G G2 - COG0191 YKL060C FBA1 fructose-bisphosphate aldolase
- - - G G2 - COG0158 YLR377C FBP1 fructose-1,6-bisphosphatase
- RRPE PAC G G3 - COG0120 YOR095C RKI1 D-ribose-5-phosphate ketol-isomerase
- RRPE PAC G G3 - COG0021 YPR074C TKL1 transketolase 1
- RRPE - H - - COG0499 YER043C SAH1 S-adenosyl-l-homocysteine hydrolase
- - - H - - COG0192 YDR502C SAM2 S-adenosylmethionine synthetase 2
- - - H - - COG0192 YLR180W SAM1 S-adenosylmethionine synthetase 1
- RRPE PAC J - - COG1889 YDL014W NOP1 fibrillarin
- RRPE PAC J - - COG1499 YHR170W NMD3 nonsense-mediated mRNA decay protein
- RRPE PAC J - - COG1498 YLR197W SIK1 involved in pre-rRNA processing
- RRPE PAC J - - COG0144 YNL061W NOP2 nucleolar protein
- RRPE PAC J - - COG1498 YOR310C NOP58 required for pre-18S rRNA processing
- RRPE PAC J - - COG1374 YPL211W NIP7 required for efficient 60S ribosome subunit biogenesis
- RRPE PAC J - - COG0030 YPL266W DIM1 rRNA (adenine-N6,N6-)-dimethyltransferase
- RRPE - J - - COG0293 YCL054W SPB1 required for ribosome synthesis, putative methylase
- RRPE - J - - COG0689 YGR095C RRP46 involved in rRNA processing
- RRPE pac J - - COG3277 YHR089C GAR1 nucleolar rrna processing protein
- RRPE - J - - COG2519 YJL125C GCD14 translational repressor of GCN4
- RRPE - J - - COG0349 YOR001W RRP6 similarity to human nucleolar 100K polymyositis-scleroderma protein
- - PAC J - - COG0009 YGL169W SUA5 translation initiation protein
- rrpe PAC J - - COG1097 YHR069C RRP4 3⬘씮5⬘exoribonuclease required for 3⬘end formation of 5.8S rRNA
- - PAC J - - COG1736 YKL191W DPH2 diphtheria toxin resistance protein
- - PAC J - - COG1798 YLR172C DPH5 diphthamide methyltransferase
- - - J - - COG2123 YDR280W RRP45 rRNA processing protein
RAP1 RRPE - J J1 - COG2092 YAL003W EFB1 translation elongation factor eEF1beta
- RRPE - J J1 - COG1503 YBR143C SUP45 translational release factor
- RRPE - J J1 - COG0480 YOR133W EFT1 translation elongation factor EEF2
- RRPE - J J1 - COG1601 YPL237W SUI3 translation initiation factor EIF2 beta subunit
- - - J J1 - COG0480 YDR385W EFT2 translation elongation factor EEF2
- - - J J1 - COG0361 YMR260C TIF11 translation initiation factor EIF1A
- RRPE PAC J J2 - COG0215 YNL247W Cysteinyl-tRNA synthetase
- RRPE - J J2 - COG0423 YBR121C GRS1 glycine-tRNA ligase
- RRPE - J J2 - COG0008 YGL245W Strong similarity to glutamine-tRNA ligase
- RRPE - J J2 - COG0017 YHR019C DED81 asparaginyl-tRNA-Synthetase
- RRPE - J J2 - COG0008 YOR168W GLN4 glutaminyl-tRNA synthetase
- - - J J2 - COG0172 YDR023W SES1 seryl-tRNA synthetase, cytosolic
RAP1 - - J J3 - COG2051 YHR021C RPS27B ribosomal protein S27.E
Table 2(continued)
COG
Presence of general COG
regulatory functional pathway/ Subcellular GOC ORF
motif category system localization number name Gene description
- RRPE - J J3 - COG2053 YOR167C RPS28A 40S small subunit ribosomal protein S28.E.C15 - - - J J3 - COG1998 YLR167W RPS31 ubiquitin/40S small subunit ribosomal protein
- - - J J3 - COG2053 YLR264W RPS28B 40S small subunit ribosomal protein S28.E.C12
- - - J J3 - COG0096 YLR367W RPS22B ribosomal protein S15A.E.C12
- RRPE PAC J J4 - COG0244 YKL009W MRT4 mRNA turnover 4
- RRPE PAC J J4 - COG2075 YLR009W Similarity to ribosomal protein L24.E.B
- RRPE - J J4 - COG0088 YBR031W RPL4A ribosomal protein
- RRPE - J J4 - COG0088 YDR012W RPL4B ribosomal protein L4.E.B
- - - J J4 - COG2058 YDL081C RPP1A 60S large subunit acidic ribosomal protein A1
- - - J J4 - COG1632 YMR121C RPL15B 60S large subunit ribosomal protein L15.E.C13
- - - J J4 - COG2157 YMR242C RPL20A 60S large subunit ribosomal protein
- - - J J4 - COG0097 YNL067W RPL9B ribosomal protein L9.E.C14
- - - J J4 - COG0081 YPL220W RPL1A ribosomal protein
- RRPE - JE J1 - COG0050 YDR172W SUP35 eukaryotic peptide chain release factor GTP-binding subunit
- RRPE - JE J1 - COG0050 YER025W GCD11 translation initiation factor EIF2 gamma chain
- RRPE PAC K - - COG0571 YMR239C RNT1 double-stranded ribonuclease
- RRPE PAC K - - COG0724 YPL043W NOP4 nucleolar protein
- RRPE - K - - COG0724 YER165W PAB1 mRNA polyadenylate-binding protein
- - - K - - COG0724 YDR429C TIF35 translation initiation factor EIF3 (P33 subunit)
- - - K - - COG0724 YOR361C PRT1 translation initiation factor EIF3 subunit
- RRPE PAC K K1 - COG2012 YBR154C RPB5 DNA-directed RNA polymerase I, II, III 25 kD subunit
- - PAC K K1 - COG1761 YNL113W RPC19 DNA-directed RNA polymerase I,III 16 kD
subunit
- - - K K1 - COG0202 YIL021W RPB3 DNA-directed RNA-polymerase II, 45 kDA
- - - K K1 - COG1644 YOR210W RPB10 DNA-directed polymerase I, II, III 8.3 subunit
- - - K K1 - COG1758 YPR187W RPO26 DNA-directed RNA polymerase I, II, III 18 kD
subunit
- RRPE PAC L - - COG1643 YGL120C PRP43 involved in spliceosome disassembly
- RRPE PAC L - - COG1643 YMR128W ECM16 similarity to helicases
- RRPE PAC LKJ - - COG0513 YGL078C DBP3 putative RNA helicase required for pre-rRNA processing
- RRPE PAC LKJ - - COG0513 YGL171W ROK1 ATP-dependent RNA helicase
- RRPE PAC LKJ - - COG0513 YJL033W HCA4 can suppress the U14 snoRNA rRNA processing function
- RRPE PAC LKJ - - COG0513 YKR024C DBP7 RNA helicase required for 60S ribosomal subunit assembly
- RRPE PAC LKJ - - COG0513 YLL008W DRS1 RNA helicase of the DEAD box family
- RRPE - LKJ - - COG0513 YKR059W TIF1 translation initiation factor 4A
- - PAC LKJ - - COG0513 YJL138C TIF2 translation initiation factor EIF4A
- RRPE - O - - COG0545 YLR449W FPR4 strong similarity to peptidylprolyl isomerase FPR3P
- RRPE - O - - COG0443 YNL209W SSB2 heat shock protein of HSP70 family, cytosolic - - - O - - COG0443 YHR064C PDR13 regulator protein involved in pleiotropic drug
resistance
rare, that is, less than 4%. None of these motifs was found in a quarter of the analyzed sequences.
To determine the specificity of these motifs for our set of proteins, the motifs were compared to all upstream regions of coding sequences in S. cerevisiae. The distributions of scores for all genes and those in our ‘cytoplasmic translation’ set are plotted in Figures 6a-c. As expected, the sequences used to build the motifs matched with higher scores. A more informative plot is shown in Figure 6d, in which the ratios of sequences in our set with respect to all S. cerevisiaegenes matching a motif at a given score are depicted. rap1 gives the best ratio, which means that our set contains a good repre-sentation of all genes regulated by Rap1, even though it only
contains 100 of the approximately 300 genes known to bind Rap1 [18]. The low values for the other two motifs might rep-resent the absence of other functionally related genes con-taining these motifs in our dataset or the occurrence of these motifs in genes involved in other processes. Although the latter possibility cannot be discarded, previous genes identi-fied to contain rrpe and pac motifs also presented functions related to protein translation [10], which suggests a role for these motifs as regulators of this process.
Genes containing rrpe and pac motifs function as RNA poly-merases and helicases, or are involved in RNA processing and the pentose pathway. The rrpe motif may also regulate the expression of some aminoacyl-tRNA synthetases, pyrimidine
comment
reviews
reports
deposited research
interactions
information
[image:15.609.56.557.85.472.2]refereed research
Figure 6
Motifs found in upstream regions of genes involved in protein synthesis. (a-c)The motif logo and the distribution of scores from the matches of these motifs to the upstream regions of all yeast genes (dark blue) or just to those from which the motif was built (red). (a) The motif rap1 presents a periodicity that roughly corresponds to the pitch of a DNA helix and is similar to the sequence repeat found in telomeres, which is also targeted by the protein Rap1 [64]. (b) The motif rrpe contains an A-rich patch followed by a T-rich patch. The lengths of these two patches vary between genes. This motif may be palindromic. (c) The motif pac is made of highly conserved residues (around 100%) at several neighboring positions. (d)Ratio of genes in the cytoplasmic protein translation set and all S. cerevisiaegenes matching at a given score to rap1 (purple), rrpe (red) and pac (orange) motifs.
25
20
15
10 20
10 50
40
30
20
10 50
40
30
1 5 10 15 20 1 5 10
Score Score
Score
F
requency (%)
F
requency (%)
F
requency (%)
F
requency (%)
Score
15 20
1 5 10 15 20 1 5 10 15 20
5
20
15
10
5
rap1 rrpe
pac
(a)
(b)
biosynthetic proteins and the chaperones FPR4 and SSB2. FPR4 is a putative peptidyl-prolyl isomerase, and SSB2 belongs to the Hsp70 family. An SSB2 homolog, SSB1, was shown to be regulated by Rap1 and transcribed at the same time as ribosomal proteins [35]. This suggested an active role of SSB1 in folding of newly synthesized polypeptide chains, as also shown for other SSB proteins [26]. This may also be the case for the chaperones found in the present work. SSB2, an Hsp70 protein, may prevent aggregation of nascent polypeptides, whereas FPR4 may speed up folding by facilitating proline isomerization.
All these genes were repressed under the conditions studied (Figure 7c). It remains to be seen whether the motifs found might control both the repression and activation of genes. In
eukaryotes, it is quite common for a protein to serve either as an activator or as a repressor, depending on the gene-regulatory proteins present in the cell [36]. In fact, some cases of Rap1 bound to the promoters of inactive genes have been reported, which suggests that other cofactors may determine the transcriptional activity of genes downstream of Rap1 binding [18]. The same mechanism may take place in regulation via pac and rrpe.
Analysis of the protein translation class: compartmentalization and homology
[image:16.609.56.556.290.611.2]The proteins of the COG functional class J, protein transla-tion, are mainly localized in cytoplasm, nucleus and mito-chondrion. We observed a clear distinction in the expression of the J genes with respect to their subcellular localization.
Figure 7
Cytoplasmic versus mitochondrial translation machinery. (a,b)The distribution of CCF values for gene pairs in which both members belong to the COG functional category J, protein translation. (a) The distribution of CCF values for gene pairs in which both members are mitochondrial proteins (dark blue) or one member is mitochondrial and the another one is not (red). (b) The distribution of CCF values for gene pairs in which both members are cytoplasmic (orange), both nuclear (red), or one member is cytoplasmic and the another one is nuclear (dark blue). (c)The averaged expression profiles of the mitochondrial translation machinery (dark blue) and the set of genes involved in protein translation in the cytoplasm, including those involved in the metabolism of sugar, amino acids and nucleotides, as well as RNA processing proteins and polymerases. The color-coding for the experiments is the same as in Figure 4. (d)Distribution of CCF values for pairs of genes that belong to the same COG. The cytoplasmic pairs (dark blue) correspond to paralog-paralog relationships whereas the ones involving cytoplasmic and mitochondrial proteins (red) correspond to orthologs. The expression of duplicated genes can be distinguished from each other because even though two genes can encode two proteins with identical amino-acid sequences, the degree of identity at the DNA level can be low enough to make a selective DNA hybridization onto the chip feasible. This seems to be the case for the genes analyzed in (d).
Mitochondria Mitochondria vs others
Mitochondria vs cytoplasmic
Cytoplasmic
Mitochondrial Cytoplasmic
Nucleus
Nucleus vs cytoplasm
Cytoplasm
Diff
erential e
xpression
F
requency
F
requency
18 30
25
20
15
10
5 16
14
−0.8 −0.6−0.4−0.2 0.0
CCF CCF
CCF 0.2 0.4 0.6 0.8 1 −0.8 −0.6−0.4−0.2 0.0
0.0 0.5
−0.5 −1
0.2 0.4 0.6 0.8 1 12
10 8 6 4 2
1
0
−2
(a)
(b)
The correlations of mitochondrial and non-mitochondrial (nuclear and cytoplasmic) gene pairs stopped at 0.7 (Figure 7a). On the other hand, the J genes found in the nucleus and the cytoplasm still correlate at very high thresh-olds, which implies that their expressions may be coupled (Figure 7b). The nuclear genes, which are mainly involved in the assembly of ribosomal subunits and in the processing and transport of RNAs should, in principle, only be required for cytoplasmic translation.
Functional class J also contains a number of COGs with more than one protein. Some of them are real orthologs and others are paralogs, which are very common in S. cerevisiae
as half its genome is duplicated [37]. These paralogs can, in some cases, conserve the function of their ancestors and even replace each other. For example, most ribosomal sub-units are encoded by two genes that yield nearly identical proteins. On the other hand, the ‘repeated’ orthologs do not complement each other. This is the case for the translational machineries - cytoplasmic and mitochondrial. Even though they have different origins (the mitochondrial one originated by gene transfer from its endosymbiotic bacterial ancestor to the nucleus), they have retained the same function. We observed a poor correlation between cytoplasmic and mito-chondrial ribosomal genes, although in some experiments, for example, sporulation, they might seem to be correlated (Figure 7c).
Both cytoplasmic and mitochondrial translation machineries still require the same ingredients for transcription (sugar and nucleotides) and translation (amino acids). However, this metabolic network seems to be coupled only to the cyto-plasmic machinery. During the evolution of the endosymbi-otic mitochondria, most of the metabolic genes have been passed onto the host nucleus and their function developed in its host cytoplasm [38,39]. The mitochondrion takes in all metabolites and factors by transporters added de novoto its membrane to ensure the delivery of all the necessary primary raw material. However, none of the few mitochon-drial transporter genes present in the microarray data was associated with the mitochondrial translation set.
The analysis of the J COGs with more than one protein pro-vides some interesting insight into the behavior of paralogs and orthologs. Plotting the CCF values of paralog-paralog pairs (mostly redundant cytoplasmic ribosomal proteins) and ortholog-ortholog pairs (cytoplasmic and mitochondrial ribosomal partners) shows that there is a spatial and tempo-ral separation of their gene products (Figure 7d). Also, the range of CCF values for cytoplasmic paralogs is somewhat broad, indicating that duplicated genes, even in the case of duplicated ribosomal genes, are not necessarily expressed identically. The reason for keeping duplicated ‘redundant’ genes is unknown, although it may be related to a selection mechanism for increased level of expression, as many of the over-duplicated gene functional categories include highly
expressed genes, for example, heat shock, glucose metabo-lism and ribosomal proteins [40].
Comparison of the expression of the translation machinery of Escherichia coliand S. cerevisiae
Protein translation is a universal mechanism present in all organisms. In fact, most of the proteins conserved in all organisms are involved either in translation (J) or transcrip-tion (K). We wanted to know if the expression of the sets of genes associated with the ribosome is co-regulated across different species in a similar way to our budding yeast cyto-plasmic translation set. A comparison against bacterial and archaeal organisms could be carried out by taking advantage of the operon organization of their genomes. An operon is made up of genes that are transcribed as part of a single mRNA molecule. Co-transcribed genes are co-regulated at the transcriptional level and often have related roles, for example involving protein-protein interactions or as part of the same metabolic pathway [41].
The first comparison was against E. coli, as its operons have been best characterized experimentally. All the operons con-taining ribosomal protein genes as well as others concon-taining genes for proteins that may be involved in translation were selected (see Materials and methods). Table 3 shows all the genes in these operons along with their corresponding COG and whether or not there is a yeast homolog in the microar-ray dataset. The ‘ribosomal operons’ contain genes involved in: J (general translation, including translation factors, J1, and ribosomal proteins for the small subunit, J3, and large subunit, J4), K1 (DNA-dependent RNA polymerases), F3 (pyrimidine biosynthesis), EHR (amino-acid transport and metabolism), L (general DNA handling, including basal replication machinery, L1) and a gene with unknown func-tion (R) that may possibly be a nucleic-acid-binding protein. The other operons include genes with other functional cate-gories such as: J2 (aminoacyl-tRNA synthetases), N (protein secretion), H (general coenzyme metabolism, including menaquinone biosynthesis, H7, and pyridoxal phosphate biosynthesis, H9), K2 (basal transcription factors), O (chap-erones) and G3 (pentose phosphate pathway).
The functional categories found in these operons closely resemble those in the yeast cluster deduced from gene-expression experiments, with the exception of the genes involved in protein secretion (N), which do not have yeast homologs. Interestingly, two chaperones were also found in the protein translation operons of E. coli. Both were pep-tidyl-prolyl cis-transisomerases (PPI). B0028 is an FKBP-type PPI homologous to the yeast PPI identified above (FPR4). B0053 also has a yeast homolog although it was not present in the microarray dataset. It is well known that in bacteria, in addition to some Hsp70-like chaperones, the trigger factor is associated with the ribosome [42]. The bac-terial trigger factor, which lacks a eukaryotic homolog, has PPI and chaperone activity and is thus probably involved in
comment
reviews
reports
deposited research
interactions
information
Table 3
List of proteins in the E. coliprotein translation operons
Operon name Eco ORF Yeast COG ID Function ORF description
tRNA synthetase and peptidase b0026 Yes* COG0060 J2 Isoleucine tRNA synthetase tRNA synthetase and peptidase b0027 No COG0597 N Prolipoprotein signal peptidase
tRNA synthetase and peptidase b0028 No COG1047 O Probable FKBX-type 16kD peptidyl-prolyl cis-transisomerase rRNA modification and chaperone b0049 Yes* COG0639 T Diadenosine tetraphosphatase
rRNA modification and chaperone b0050 No COG2967 P Uncharacterized protein affecting Mg2+/Co2+transport rRNA modification and chaperone b0051 Yes** COG0030 J 6-m-2-A methyltransferase; put. 16S rRNA methyltransferase rRNA modification and chaperone b0052 No COG1995 H9 Pyridoxine and pyridoxal phosphate biosynthesis
rRNA modification and chaperone b0053 Yes COG0760 O Peptidyl prolyl isomerase Ribosomal protein 1 b0169 Yes** COG0052 J3 Ribosomal protein S2
Ribosomal protein 1 b0170 No COG0264 J1 Translation elongation factor EF-Ts
Ribosomal protein 1 b0171 No COG0528 F3 Uridylate kinase
Ribosomal protein 1 b0172 Yes* COG0233 J1 Ribosome releasing factor operon?
tRNA modification and protein export b0405 No COG0809 J S-adenosylmethionine:tRNA ribosyltransferase-isomerase tRNA modification and protein export b0406 No COG0343 J Queuine tRNA-ribosyltransferase
tRNA modification and protein export b0407 No COG1862 N ORF, hypothetical protein
tRNA modification and protein export b0408 No COG0342 N Protein-export membrane protein SecD tRNA modification and protein export b0409 No COG0341 N Protein-export membrane protein SecF Ribosomal protein 2 b0910 No COG0283 F3 Cytidine monophosphate kinase Ribosomal protein 2 b0911 Yes* COG0539 J3 Ribosomal protein S1
Ribosomal protein 3 b1088 No COG1399 R Predicted metal-binding, possibly nucleic acid-binding protein Ribosomal protein 3 b1089 Yes COG0333 J4 Ribosomal protein L32
tRNA synthetase and oxidase b1637 Yes* COG0162 J2 Transfer RNA-Tyr synthetase tRNA synthetase and oxidase b1638 Yes COG0259 H9 Pyridoxamine 5’-phosphate oxidase Phenylalanine tRNA synthetase b1713 Yes COG0073 R Phenylalanine tRNA synthetase, beta subunit Phenylalanine tRNA synthetase b1714 Yes* COG0016 J2 Phenylalanine tRNA synthetase, alpha subunit Ribosomal protein 4 b2606 Yes* COG0335 J4 Ribosomal protein L19
Ribosomal protein 4 b2607 No COG0336 J tRNA (m1G) methyltransferae Ribosomal protein 4 b2608 No COG0806 J ORF, hypothetical protein Ribosomal protein 4 b2609 Yes COG0228 J3 Ribosomal protein S16
Ribosomal protein 5 b3065 No COG0828 J3 Ribosomal protein S21
Ribosomal protein 5 b3066 No COG0358 L1 DNA primase
Ribosomal protein 5 b3067 No COG0568 K1 RNA polymerase sigma-subunit Ribosomal protein 6 b3164 No COG1185 J Polynucleotide phosphorilase Ribosomal protein 6 b3165 Yes** COG0184 J3 Ribosomal protein S15
RNA modification b3166 Yes* COG0130 J tRNA pseudouridine 55 synthase; P35 RNA modification b3167 No COG0858 J Ribosome-binding factor A; P15B Transcription and translation b3168 Yes COG0532 J1 Initiation factor IF2-alpha (infB) Transcription and translation b3169 No COG0195 K2 NusA protein
Transcription and translation b3170 No COG0779 S Hypothetical 16.8 kD protein Ribosomal protein 7 b3185 Yes* COG0211 J4 Ribosomal protein L27
Ribosomal protein 7 b3186 No COG0261 J4 Ribosomal protein L21