Munich Personal RePEc Archive
Bankruptcy and product-market
competition: evidence from the airline
industry
Ciliberto, Federico and Schenone, Carola
University of Virginia, University of Virginia McIntire School of
Commerce
10 April 2012
Online at
https://mpra.ub.uni-muenchen.de/38624/
Bankruptcy and Product-Market Competition:
Evidence from the Airline Industry
Federico Cilibertoy University of Virginia
Carola Schenonez University of Virginia
February 2012
Abstract
We investigate the e¤ects of Chapter 11 bankruptcy …lings on product market competition using data from the US airline industry. We …nd: i) bankrupt air-lines permanently downsize their national route structure, their airport-speci…c networks, and their route-speci…c ‡ight frequency and capacity; ii) bankrupt air-lines lower their route-speci…c prices while under bankruptcy protection, and in-crease them after emerging. We do not …nd robust evidence of signi…cant changes by the bankrupt airline’s competitors along any of the dimensions above.
Keywords: Airline Industry, Bankruptcy, Product Market Competition, Chap-ter 11.
JEL Codes: G33, L13, L93, K2.
We thank Ken Ayotte, Murillo Campello, Sofronis Clerides, Leora Friedberg, Rick Green, Bar-ton HamilBar-ton, Nick Kumino¤, Michael Levine, Vikas Mehrotra, Amalia Miller, Harikesh Nair, Oliver Richard, David Robinson, Nicholas Rupp, Patrik Sandas, David C. Smith, Andrew Sweeting, and William Wilhelm for comments and suggestions. We also thank seminar participants at the Work-shop on Airline Competition organized by the Antitrust Division of the U.S. Department of Justice on October 23, 2008, in Washington, DC; the North America Econometric Society Meetings in Pitts-burgh; the American Finance Association Meetings in Chicago; the Olin Business School at St. Louis, Virginia Tech, University of Illinois at Urbana-Champaign; the Empirical Research in Corporate Fi-nance Conference at the University of Oregon, Eugene; the International Industrial Organization Conferences in Boston and Washington; the Southern Economic Association Conference in Wash-ington. Lynn LoPucki generously shared his Bankruptcy Research Database. A previous version of this paper was circulated under the title “Financial Decisions, Bankruptcy, and Product-Market Competition in the Airline Industry”. All remaining errors are our own.
yDepartment of Economics, University of Virginia,
ciliberto@virginia.edu, ph: (434) 924-6755.
zMcIntire School of Commerce, University of Virginia,
1
Introduction
In the past few years thousands of …rms have …led for bankruptcy protection under Chapter 11 of the United States Bankruptcy Law.1 Firms …ling for bankruptcy
protection belong to a wide range of industries, from Lehman Brothers to Chrysler and GM.2 The unprecedented number of …lings has led to a renewed interest in the
economics of bankruptcy. Most of the previous work has examined the direct costs of bankruptcy proceedings, such as legal and administrative expenses, as well as their indirect costs, such as lost sales (Franks and Torous (1989), Thorburn (2000), Bris, Welch, and Zhu (2006), Hennesy and Whited (2007), Bebchuk (2002)).3 There is also work on the e¤ects of bankruptcy on …rm survival (Hotchkiss (1995)), on equity returns (Jorion and Zhang (2008)), and on innovation (Acharya and Subramanian (2009)). Nonetheless, there is surprisingly little work on the e¤ects of bankruptcy …lings on product market competition.
This paper uses data from the US airline industry to investigate the e¤ect of Chapter 11 …lings on prices, capacity choices, and networks. These data are from one single industry for which we have data from a cross-section of local markets. This allows an examination of how bankruptcy …lings a¤ect the strategic decisions of …rms, holding industry …xed. In this sense, our approach is in the same spirit as Chevalier (1995), who uncovers basic stylized patterns in the relationship between leverage buyouts and the pricing behavior of …rms and their rivals using cross-section data from the US supermarket industry.
The airline industry provides an interesting empirical framework for several ad-ditional reasons. First, air transport is arguably the most important means of transportation in the US Second, the airlines seeking bankruptcy protection form a heterogeneous group, including low cost carriers such as ATA, and national carriers such as United and USAir. The range of variation in the identities of the bankrupt
1There has also been an outstanding number of personal bankruptcy …lings. See White [2007] for
2Lehman Brothers …led in July2008. Chrysler and GM …led in April and June2009;respectively. 3See also the early work by White [1982]. Recently, there has been extended research comparing
airlines ensures that our empirical analysis provides insights on other industries as well. Third, because it is one industry where carriers interact over many distinct markets and over time, we can identify the e¤ects of bankruptcy on product market competition, independent of potentially confounding market, …rm, and time e¤ects. Finally, because there are bankrupt and non-bankrupt carriers serving the same mar-ket, we can investigate di¤erent carriers’ price reactions to one carrier’s bankruptcy. We start our analysis by looking at how bankruptcy …lings a¤ect the network of the bankrupt carrier and of its rivals. We …nd that at the US national level, the bankrupt carrier permanently drops approximately 25 percent of its pre-bankruptcy routes. We also look at airport speci…c networks. Not surprisingly, we …nd similar results. The bankrupt carrier reduces its average number of markets out of an airport by26percent while under bankruptcy protection, and by24after its emergence from Chapter 11 relative to its pre-bankruptcy numbers. Its rivals increase the average number of markets they serve at the US national level, but this result is not very robust across speci…cations and we do not con…rm it when we look at changes in the number of markets out of airports. Next, we investigate how bankruptcy …lings a¤ect the ‡ight frequency and capacity decisions. We …nd that the bankrupt …rm lowers by
21percent the average frequency of ‡ights within a route while operating under court protection, and by 32:8percent once the carrier emerges from bankruptcy. We also …nd that bankruptcy …lings have an equally signi…cant e¤ect on the bankrupt’s aver-age capacity (measured by seats in a route) both during and following a bankruptcy …ling. We do not …nd robust evidence of any signi…cant changes by the bankrupt airline’s competitors along any of the dimensions above. We conclude our analysis with a study of the e¤ects of bankruptcy …lings on airline market mean prices. We …nd that the insolvent carrier’s price drops by 3:1 percent while under bankruptcy protection, and increase by almost 5 percent after emerging, both of these numbers relative to pre-bankruptcy prices. Again, we do not …nd evidence of any signi…cant changes by the bankrupt airline’s competitors along any of the dimensions above.
relation-ship between bankruptcy …lings and product-market competition.4 In looking at the e¤ect on prices and on frequency, they …nd that in the quarter during which a carrier …les for Chapter11protection, the number of ‡ights at the airports where the bankrupt carrier operates declines by about20percent relative to the pre-bankruptcy level. Borenstein and Rose (1995) do not …nd any systematic evidence that either bankrupt …rms or their competitors changed prices after a bankrupt …rm’s Chapter
11 …ling. Mainly, our analysis di¤ers from theirs along four dimensions. First, we look at multiple strategic decisions (airport and national network structure, capacity choices, prices). Thus, we can provide a uni…ed framework to understand the e¤ect of bankruptcy …lings. Instead, Borenstein and Rose (1995, 2003) limited their analysis just to changes in prices and in number of markets out of airports. We show that the most important changes concern capacity choices in the markets that airlines continue to serve and the size of the network served by the bankrupt airline after exiting from bankruptcy. Second, we investigate the e¤ects during and after a com-petitor’s bankruptcy …ling. The post-emergence analysis adds to our understanding of what the ‘permanent’ changes are in the set of services o¤ered following a …rm’s bankruptcy …ling. This conforms to the notion that the main purpose of bankruptcy …lings should be to allow …rms time to reorganize themselves and that the evaluation of the economic success of a bankruptcy …ling should be made after the …rm’s exit from bankruptcy. Third, we show that the e¤ects are fundamentally di¤erent for the bankrupt …rms and their rivals. In contrast, Borenstein and Rose (1995, 2003) esti-mate the average e¤ect across both …ling and non-…ling carriers, and therefore they do not identify the e¤ect on the …ling carrier separately from that on its competitors. This is important because bankruptcies do not only a¤ect the bankrupt …rm but also its competitors. It is quite emblematic that all the legacy carriers in the United States have now …led at least once for Chapter 11. Fourth, we include speci…cations that
4In addition to the di¤erences discussed in the body of the article, our analysis di¤ers from theirs
control for such unobserved heterogeneity using route-carrier …xed e¤ects, since it is likely that there are heterogeneous route-carrier unobservables that might confound the results in Borenstein and Rose (1995, 2003). Including route-carrier …xed e¤ects rather than just carrier …xed e¤ects and route …xed e¤ects has been shown to be of fundamental importance in empirical studies of the airline industry.5
This work is also related to a growing theoretical literature that examines whether a …rm’s capital structure impacts competition in the market for the …rm’s products. This literature focuses on how …nancial distress impacts the competitive interaction of distressed and non-distressed …rms in an industry (Brander and Lewis (1986), Bolton and Scharfstein (1990), Hendel (1996), Dasgupta and Titman (1998)). Sev-eral empirical papers followed providing evidence of the interaction between …nancial distress and product market competition (Bolton and Scharfstein (1990), Chevalier and Scharfstein (1995, 1996), Chevalier (1995a, 1995b), Phillips (1995), Campello (2006), Bhagat, Moyen, and Suh (2005), Kovenock and Phillips (1995)), and between bankruptcy …lings and stock market performance (Ferris, Jayaraman, and Makhija (1997)). Within this literature, the closest paper to ours is Chevalier (1995a). Our paper di¤ers from hers along one important dimension: we have data on the individ-ual price of the …rms, while Chevalier only has data on the average price in a market. This additional information is of crucial importance in our empirical analysis since we do not …nd evidence of almost any reaction by the rivals of …rm that …les for Chapter 11 protection.
2
Bankruptcies in the Airline Industry
Several factors that can alter the competitive interaction between …rms in an indus-try come into play when one of the …rms reorganizes under Chapter 11.6 First, the
5Gerardi and Shapiro (2009) analyzed the e¤ects of competition on price dispersion in the airline
industry, using panel data from 1993:Q1 through 2006:Q3 and showed that their results contrasted with those of Borenstein and Rose (1994), who found that price dispersion increased with competition. Gerardi and Shapiro presented evidence that the di¤erent results in Borenstein and Rose (1994) and Gerardi and Shapiro (2009) were reconciled by showing that not including route …xed e¤ects would not be enough to control from omitted-variable bias.
6The United States Bankruptcy Code contemplates two alternative solutions for …rms in …nancial
bankrupt …rm faces cost shocks inherent to operating under court protection, such as the ability to renege and renegotiate contracts. Furthermore, the bankrupt …rm faces demand shocks that can result in reduced demand for its products, as in Opler and Titman (1994). Finally, reorganization might entail changes in the …rm’s product quality (see Maksimovic and Titman (1991)), inventory (Hendel (1996)), and capac-ity. These also have the potential to disrupt the competitive interaction of …rms in the industry. To capture all of these changes we usebankruptcy categorical variables.
2.1 Stylized Facts of Airline Bankruptcies
Table 1summarizes some stylized facts.7 Consistent with Bris et al. (2006) and Chen and Schoar (2007), this table reveals signi…cant heterogeneity among bankruptcies. This is most evident in the range of time that the …rm spends under bankruptcy (from
18 days for Air South to 1;513 days for United Airlines), the way in which the …rm resolves its bankruptcy (emerging or having to convert to Chapter7liquidation); and the speci…c way in which the emerging …rm exits bankruptcy (on its own, or merging with another carrier). Columns 3 and 4 show that almost all airlines …rst …le for Chapter 11 protection. Large airlines soon begin to develop a reorganization plan. Smaller carriers …rst attempt to keep the business alive by seeking an investor that
Chapter 7, entitled Liquidation, allows for an orderly, court-supervised procedure by which a trustee collects the assets of the …rm, reduces them to cash, and makes distributions to creditors subject to the debtor’s right to retain certain exempt property and to the rights of secured creditors. Chapter11, entitled Reorganization, allows the bankrupt …rm to continue operating while the …rm’s management restructures the …rm’s business. Firms that …le for Chapter11are those deemed a viable ongoing concern which can potentially repay creditors through a court-approved reorganization plan. We focus on Chapter11…lings and drop …rms …ling under Chapter7because we are interested in the competitive and strategic e¤ect triggered by a …rm in the market that operates under bankruptcy protection, and …rms …ling for Chapter7stop operations and liquidate their assets.
7Airlines that have …led for bankruptcy in the last two decades are identi…ed using the Air
would buy the carrier’s ‡ying certi…cate and any other assets the carrier might still posses. If the carrier’s management is unsuccessful at …nding such investor(s), the carrier converts its Chapter 11…ling into a Chapter7…ling. For instance, in the case of MarkAir’s second …ling the U.S. Bankruptcy court changed the carrier’s Chapter
11 …ling to Chapter 7, after the carrier spent 8 months under Chapter11. Column
5 shows that in only two cases, Sun Country and Eastwind, the …ling was a Chapter
7 Liquidation initiated by the carrier’s creditors who took the …rm to court.8 Some airlines …le for Chapter 11 protection multiple times (Column 6). The probability that it emerges as an independent entity declines with the number of past …lings and with shorter time spans between …lings (Columns 7 to11). For example, USAir emerged from its second Chapter 11 …ling after merging with America West, and TWA emerged from its third …ling after being acquired by American. We expect the competitive behavior to change di¤erently when carriers …le for the …rst time, or for subsequent times and, indeed, this is what we …nd in our empirical analysis. Column12shows substantial heterogeneity in the time that a …rm can operate under Chapter 11 protection. There is no clear relationship between the duration and the probability of emergence from bankruptcy.
2.2 The Economics of Airline Industry Bankruptcy Filings
The reorganization of the …rm’s operating plan during bankruptcy can result in changes in the markets served, as well as in the way these markets are served. For example, after …ling for bankruptcy protection on September 14, 2005, Delta Air-lines implemented several major changes. One of the most important ones was its decision to abandon the Dallas/Fort Worth airport as one of its hubs. This led to fewer non-stop destinations out of Dallas, and fewer ‡ights on the routes that were still served. During reorganization, the insolvent …rm might downsize operations in markets burdened with excess capacity and in the least pro…table markets. Carriers can also downsize capacity within a market by adjusting the number of seats o¤ered
8Lessors forced an involuntary liquidation of Sun Country Airlines. The FAA grounded Kiwi
and the number of performed departures. The freed capacity can be reallocated to markets that are more pro…table.9
Under bankruptcy, the insolvent carrier can implement cost-cutting strategies that are illegal outside of court protection, thus facilitating the …rms return to pro…tability. Under Section 1110 of Chapter 11, a bankrupt carrier that has defaulted on its aircraft lease payments has a 60 day grace period to make lease payments and keep the aircraft. If after 60 days the carrier has not paid its outstanding lease, the lessor can re-possess the aircraft. Rarely have lessors repossessed aircrafts.10 Most
lessors are willing to renegotiate payments with the bankrupt carrier because a lessor who repossesses a plane would have to redeploy it elsewhere, and if the industry is in distress, that might be more costly than extending payment schedules or renegotiating payment terms. Furthermore, since rescinded leases become a general unsecured claim on the carrier, the ca rrier has a strong bargaining position with their lessor.11 In rare instances, lessors force a Chapter 11…ling over missed lease payments.12 One
of the largest burdens a¤ecting most carriers are obligations to employees and retirees through de…ned bene…t pension programs. Most legacy carriers under bankruptcy protection use their bankruptcy …lings to renegotiate or renege on their de…ned bene…t pension obligations. Doing so transfers the burden of pension obligations to taxpayers via the Federal Pension Bene…t Guarantee Corporation (PBGC).13 Cost reductions resulting from changes in de…ned bene…t pension programs should outlast the …rm’s
9In particular, Sections 1110and 1113of Chapter 11 facilitate these strategic changes as they
allow the bankrupt carrier to adjust capacity without incurring major costs or contract violations, by granting insolvent carriers the freedom to rescind leases on gates, hangars, and aircraft, and to unilaterally modify labor agreements. For instance, Delta rejected and restructured dozens of leases at the Tampa, Dallas and Orlando airports.
1 0Repossessions have occurred for small carriers: MarkAir (second bankruptcy), Western Paci…c,
and Sun Country.
1 1During Continental’s second bankruptcy …ling 12 aircraft leasing companies agreed to defer,
reduce, or forgive lease payments on98planes in Continental’s ‡eet. America West negotiated rent relief on aircarfts leased from Ansett Worldwide Aviation Services. ATA returned18planes to lessor General Electric. Delta Airlines requested court approval to reject leases on its aircrafts.
1 2Lessors of USAir considered …ling a lawsuit against the carrier. But Brad Gupta, the president
of Ameriquest Holdings, a USAir lessor, publicly stated on July25;2002that would leave the lessor facing lower lease rates and lower demand for rejected leases. This discouraged the lessor’s lawsuit.
1 3Under United Airline’s reorganization plan, the PBGC took over all four of the airline’s
stay under bankruptcy protection. Labor union contracts heavily burden the airline industry. Renegotiations with unions and employees is a key cost-saving strategy in which airlines engage while operating under protection. The threat that the carrier can be forced into liquidation, leaving employees jobless, makes labor unions and employees more willing to renegotiate than they would otherwise be. Under Section
1113of Chapter11, an airline can unilaterally modify labor agreements if negotiations turn out to be unsuccessful.14 Just the threat that the bankrupt carrier can turn to Section 1113shifts most of the bargaining power to the airline.
A bankruptcy …ling can a¤ect consumers’ willingness to pay for the services that the insolvent …rm provides. Such a negative demand shock might reverse once the carrier exits bankruptcy. Reputation costs associated with a bankruptcy …ling can reduce the demand for the carrier’s ‡ights. Opler and Titman (1994) show that highly leveraged …rms lose substantial market share to their more conservatively …nanced competitors during industry downturns. Similarly, bankrupt …rms (which represent the extreme case of excessive leverage) might lose signi…cant market share to competitors. Safety consideration aside, passengers might still prefer to ‡y non-bankrupt carriers if they are concerned that the insolvent …rm will not honor its frequent ‡ier obligations. Passengers have voiced concerns that, even if the carrier emerges from bankruptcy, frequent ‡ier miles might not be honored.15 This can drive demand away from the distressed carrier to its non-distressed competitor.
3
Data Description
Our data is an original compilation from several sources. From the Air Transportation Association Web site, Lynn LoPucki’s Bankruptcy Database, and Factiva and
Lexis-1 4When USAir’s mechanics wouldn’t join other unions in making voluntary concessions, the
car-rier’s CEO, David Siegel, …led for Chapter11. The carrier’s ability to void labor contracts with the bankruptcy judge’s approval allowed Siegel to win concessions from the mechanics. During United Airlines reorganization, the carrier …led a motion with the bankruptcy court to void the unions’ labor contracts and impose new terms to signi…cantly cut the carrier’s expenses. Notice that Section1113
is not speci…c to airlines, while Section1110is.
1 5A December11;2002article in the WSJ reveals United’s concern with reputation e¤ects following
Nexis reports, we obtain the identity of carriers …ling for bankruptcy, the dates on which each carrier entered and exited court protection, and the speci…c way in which each carrier emerged from protection. We merge this dataset with data from The “On-Time Performance Schedule” gathered by the Bureau of Transportation Statistics (BTS); the T-100 Domestic Segment of Form 41 reported by the BTS; the Origin and Destination Surveys (DB1B), which is a ten percent sample of airline tickets sold by airlines within a quarter.
3.1 Carriers, Markets, and Routes
We consider nine national carriers between 1997 and 2007: American (identi…ed by its airline code, AA), Continental (CO), Delta (DL), America West (HP; until the third quarter of 2005), Northwest (N W), Trans World Airlines (T W A, until the second quarter of 2001), United (U A), USAir (U S), and Southwest (W N). Low cost carriers are grouped in a category labeled LCC (e.g., Jet Blue and Frontier are in the LCC group).16 This allows us to keep small carriers that are present in
only a few markets or for a few quarters when we include route-carrier …xed e¤ects. Furthermore, it allows us to use a meaningful grouping that captures the impact of small carrier presence in the market. In the LCC category we exclude three low cost carriers which we choose to study independently: Airtran (F L), ATA (T Z), and National (N7). We do this because they either had a strong presence (Airtran) or they …led for Chapter11 during our sample period (ATA and National).17
Next, we identify airlines that have …led for bankruptcy protection between 1997
and 2007. There are six carriers operating under bankruptcy protection during our sample period: United Airlines (December9,2002through February2,2006), USAir (August11,2002through March31,2003and then again September12,2004through
1 6For each route-year-quarter, we take the averages across the low cost carriers for the control
variables.
1 7In the LCC category we include: Trans States Airlines, Aloha Airlines, Alaska Airlines, Jetblue
September 27, 2005), ATA (October 26; 2004 through February 28, 2006), Delta (September 14, 2005 through May 1, 2007), and Northwest (September 14, 2005
through May 31, 2007). Some small carriers operated under court protection for a small time window, and thus we cannot consider these carriers independently (E.g., Independence Air operated under court protection between November 7, 2005 and January5,2006).18
We de…ne a market, denoted bym, as an airport-to-airport trip,irrespective of the number of connections.19 A route, denoted byr, is anon-stop airport-to-airport trip.
We consider all airport-to-airport pairs between the top 50 Metropolitan Statistical Areas (MSAs), ranked by population size.
We have four units of observation, which vary by the dataset used in each regres-sion. First, to study the frequency of services, seats, and load factor, the unit of observation is a carrier, route, year, quarter, combination. Second, we study prices using a carrier, market, year, quarter unit of observation. Third, to study a carrier’s network extent out of an airport, the unit of observation is carrier, airport, year, quarter speci…c. Finally, for the analysis of the number of markets served in a given quarter, by a given carrier, we use a carrier, year, quarter unit of observation
We denote carriers by j; airports by a = 1; :::; A; airport-to-airport routes by
r = 1; :::; R; airport-to-airport markets by m = 1; :::; M; and time period by t = 1; :::T. For example, the combination jrt indicates that airline j (e.g. American) transports its passengers on route r (Chicago O’Hare to Fort Lauderdale Airport) at time t(e.g. the second quarter of 2002). In the rest of the analysis, we let g denote the geographical scope of the analysis: thus, g2 fr; m; a; ng, where nindicates that the information is at the national level and the unit of observation is a carrier-year-quarter. When g=nthere is no cross-section variation across markets, and we only have time-series variation.
1 8We exclude TWA’s third bankruptcy even though it occurred during our sample period because
the …rm stayed under bankruptcy protection for less than one quarter. For an analysis of prepackaged bankruptcies, see Carapeto, 2005. We also exclude Chapter 7 …lings because in that case …rms liquidate, and we do not have information on prices or other strategic variables under liquidation.
1 9For example, one market is Chicago O’Hare (ORD) to Washington Dulles (IAD) and another
3.2 Bankruptcy Categorical Variables
We de…ne the set of K carriers that …led for bankruptcy protection at some point as
= U A; U S(1st); U S(2nd); N W; DL; T Z; N7 . Notice that USAir …led for Chapter
11 twice. We use the subscript k = 1; :::; K to denote a bankrupt …rm (K is equal to 7). We want to distinguish the e¤ect that bankruptcy …lings have on the quality measures we consider, for the bankrupt …rm, and for its competitors, during the time when the bankrupt …rm operates under Chapter 11, as well as after the …rm emerges from bankruptcy protection. To measure these e¤ects, we construct the following categorical variables. First, we de…ne Bktgt equal to1if there is at least one carrier
under bankruptcy protection at time t and that carrier provides service in g (for example, if g = r, then it provides service in route r), otherwise, Bktgt is equal to
zero. For each quality measure, we study the average e¤ect of bankruptcy across markets and across bankrupt and non-bankrupt carriers. Next, we ask whether any observed price changes during bankruptcy persist once the bankrupt …rm emerges from court protection. To do this, we de…ne the categorical variable Af tBktgt equal
to 1 if there is at least one carrier that was under bankruptcy protection at a time beforet; and that carrier currently serves g. Otherwise, Af tBktgt is equal to zero.
3.3 Networks, Capacity, and Prices
We measure the extent to which a carrier’s downsizing a¤ects the number of markets served at the national level. We use the scheduling database to construct the count of origin-destination airport pairs by operating carrier, year, and quarter. We call
N ationalN etworkjt the total number ofairport-airport combinations served by
car-rier j during year-quartert.20 Table 2 shows that on average a carrier serves446:14
markets over the US.
We build a measure of a carrier’s network out of the airport of origin using the scheduling data. The variableAirportN etworkjatequals the number of routes served
out of airport a; by carrier j; in year-quarter t:21 Table 2 shows that on average a
2 0Notice that for simplicity we have omittedg=nin the subscript of this variable.
2 1This is a very important variable in the empirical literature of the airline industry. In particular,
carrier serves 19 markets out of an airport.
We evaluate the ‡ight frequency for each speci…c route. There has been active research on the importance of ‡ight frequency as a determinant of air travel demand.22 An airline that provides a single ‡ight per day between two airports is forcing a large fraction of travelers to ‡y at a time which is going to be less attractive than the one o¤ered by an airline that provides two or more ‡ights per day between the same two airports. To construct a measure of the ‡ight frequency between two airports, we use the scheduling database which provides information on the number of ‡ights that each carrier schedules and performs in each market, during a year-quarter period. We compute the sum of the number of scheduled departures between two airports by operating carrier, route, year, and quarter. F requencyjrt equals the total number of
departures performed in route r, on year-quartert, by carrier j. Table 2 shows that on average …rms o¤er 362:29 ‡ights per quarter in each route.
The T 100 Domestic Segment of Form 41 reported by the BTS provides data on an airline’s capacity, measured by available seats, denoted by Seatsjrt. Table 2
shows that on average a carrier transports 45;846:46 seats per quarter.
We de…ne a carriers load factor on a route during a year-quarter as the ratio of the sum of all passengers transported in a market during a year-quarter to the sum of all available seats for sale on that market, during that year-quarter. We denote the load factor by LoadF actorjrt.
To summarize the airline pricing behavior we use the median prices in a market
m, denoted byF arejmt, to exploit information on the distribution of prices available
from the DB1B dataset while using as few statistics as possible.23 We code a
round-the origin and destination airports (round-the number of ticket counters, customer service desks, etc.). See Berry (1990,1992), Berry, Carnall, and Spiller (2006), Bamberger and Carlton (2003), Brueckner, Dyer, and Spiller (1992), Ciliberto and Tamer (2009), Ciliberto and Williams (2009).
2 2Previous work looking at ‡ight frequency as a means for airlines to di¤erentiate their products
have looked at the relationship between ‡ight frequency and mergers (Richard, 2003), market com-petition (Borenstein and Netz, 1999), the nature of airline networks (Brueckner and Zhang, 2001), and economies of tra¢c density (Brueckner and Spiller, 1994)
2 3We drop: tickets that are neither one-way nor round-trip travel, such as open-jaw trip tickets;
trip ticket as one directional trip ticket, which costs half the full round-trip ticket fare. Fares are measured in 1993 dollars. Table 2 shows that the average fare for a one-way ticket is 126:46 dollars.
4
Identi…cation and Empirical Speci…cation
The objective of our paper is to compare route structure, prices, and capacities before, during, and after bankruptcy. The main concern is the following: As the …rm sinks deeper into …nancial distress, it might change its strategic decisions, like prices, capacity, and network extent to generate the cash it needs to avoid bankruptcy, but this can lead the …rm deeper into …nancial distress, and ultimately to a Chapter 11 …ling. This strategy is likely to be the …rm’s desperate attempt to raise cash to avoid the bankruptcy …ling, and therefore, it is likely to occur in the period immediately preceding bankruptcy. As a result of this pre-bankruptcy behavior, we might estimate a lower pre-bankruptcy average price just because of the rapid drop in prices in the quarters before the bankruptcy …ling.
This problem is conceptually the same as the one in Ashenfelter (1978). In a study of the e¤ect of training programs on earnings Ashenfelter noted that all trainees suf-fered unpredicted earning declines in the year prior to entering a training program (see Ashenfelter (1978, page 51)). This stylized fact has become known as the “Ashen-felter dip.” Simple comparisons of earnings before and after the training program would be misleading evidence of the e¤ect of training on earnings. To deal with this, Ashenfelter dropped the period immediately preceding training (see Ashenfelter (1978, page 53)). The analogy with our problem of prices and bankruptcy …ling is clear: Prices could fall prior to bankruptcy and this would dampen the di¤erences in the prices before, during, and after the bankruptcy …ling.
We follow Ashenfelter (1978) and drop observations corresponding to two quar-ters prior to the to-be-bankrupt …rm’s bankruptcy …ling date and corresponding to
9999dollars; and tickets whose fares were in the bottom and top5percentile percentile in their year; tickets with more than 6coupons. We then merge this dataset with the T-100 Domestic Segment (U.S. Carriers) and drop tickets for ‡ights that have less than 12departures over a quarter inone
markets where this …rm was present.24 To further address this concern, we apply a dynamic program evaluation approach: We look at the average values of the variable of interest (e.g. price) one quarter before, two quarters before, and three quarters before the …rm’s bankruptcy …ling. The key point is to see whether there is ev-idence of signi…cant changes in prices preceding the bankruptcy …ling. Next, we worry about the possibility of persistent correlation of negative unobserved current and expected demand shifts (that extend beyond the pre-bankruptcy period we elim-inate) in markets served by the bankrupt airlines relative to that in markets served by other airlines. We address this second concern by following Friedberg (1998), and include linear market time trends to control for such market-speci…c unobserv-able correlations across time. Further, price changes triggered by demand changes spurring from seasonal or exogenous shocks (e.g. increases in fuel costs or 9/11) can confound the e¤ects of bankruptcy on prices. Serially correlated industry-speci…c shocks to demand can also confound the e¤ects of bankruptcies on prices. To address this, we include year-quarter …xed e¤ects. Furthermore, a carrier ‡ying on a certain time schedule might bene…t business travel in some markets but not in others, a¤ect-ing the price behavior of that carrier in those markets, but not in others.25 Ignoring these sources of unobservable heterogeneity associated with an airline’s pricing be-havior can confound the e¤ects of bankruptcy …lings on prices. To address this, we include route-carrier …xed e¤ects. Finally, a carrier’s presence in a market can have an e¤ect on the behavior of other carriers in that market, regardless of whether the carrier is bankrupt. Thus, we di¤erentiate the e¤ect of a bankruptcy …ling from the e¤ect that just the presence of a …rm in the market has by including the categorical variable INgt. The variable INgt switches on when at least one bankrupt …rm is in g (recall that if g=r, then we would say that at least one bankrupt …rm is in route
r) at time t. This variable is likely a function of the same unobservables that a¤ect the pricing decisions. This leads us to discuss the issue of sample selection.
There are two sources of sample selection. The …rst is related to the self-selection
2 4We repeat the analysis excluding the preceding 4 quarters and …nd qualitatively similar results. 2 5Another example: A carrier in a given market might use more modern planes than other carriers
of the …rms into markets. In the literature, this problem is addressed by following Veerbek and Nijman (1992), who consider the selectivity bias of the …xed and ran-dom e¤ects estimators and show that the …xed e¤ect estimator is more robust to nonresponse biases than the random e¤ects estimator. The second sample selection issue refers to the selection of markets, since we do not have a balanced panel. Thus, following Veerbek and Nijman (1992), we need to use market …xed e¤ects. In this paper, we include route-carrier or market-carrier …xed e¤ects to address this concern, which clearly control for market (or route) and carrier …xed e¤ects. To study the empirical importance of sample selection we present results when we run regressions with random e¤ects and compare them with the results we obtain when we include …xed e¤ects. We show that sample selection is not an issue of empirical signi…cance in our analysis, since the results are not di¤erent.
We estimate the following econometric speci…cation:
lnQjgt = OW NBktOwngt + OT HBktOthersgt (1)
+ OW NAf tBktOwngt + OT HAf tBktOthersgt +"jgt;
where"jgtis the remaining component of the regression to be discussed in detail
be-low. Here,Qjgtis one of the measures discussed in Section (3.3): N ationalN etworkjt; AirportN etworkjat; F requencyjrt,Seatsjrt,F arejmt, andLoadF actorjrt:These
de-pendent variables are run on two sets of bankruptcy categorical variables. The …rst indicates whether a competitor in a market currently operates under bankruptcy protection, and the second indicates whether any of the …rms competing in a market
previously operated under bankruptcy.
The coe¢cient OW N measures the current e¤ect of a bankruptcy …ling on the
bankrupt …rm’s variableQjgt. The current e¤ect on the bankrupt’s …rm competitors
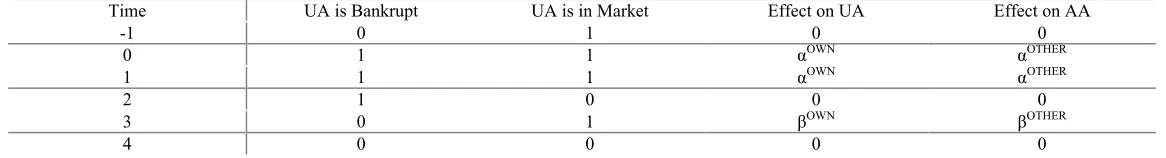
is measured by OT H. The post-bankruptcy e¤ects are measured by OW N and OT HER. Table 3illustrates how we identify the parameters of the regression. Note
until the next bankruptcy …ling. Similarly, thepre-bankruptcy period is de…ned asall quarters between the beginning of the sample period until the …rm’s bankruptcy …ling; and for the second USAir bankruptcy it is over the quarters between …lings.
We let "jgt be de…ned as follows:
"jgt = ut+ujt ifg=n(unit of observation is carrier-year-quarter),
"jgt = Ingt+ujg+ut+ujgt+ o(g)o(g)gt T rendt + d(g)d(g)gt T rendt ifg=r; m; "jgt = Inat+uja+ut+ujat+ a a T rendt ifg=a.
Ingt is the variable that controls for whether one of the …rms that is …ling for
bankruptcy is in g at any point in time; ujg is a g-carrier …xed e¤ect, for example
a route-carrier …xed e¤ect when we look at prices; ut is a year-quarter …xed e¤ect;
and ujgt is an idiosyncractic unobservable. T rendt is a time trend variable, taking
values from 1 to 48. o(g) is the parameter of the origin-speci…c time trend, where o(g) is the origin airport of route r or market m. d(g) is de…ned similarly. a is
the parameter of the origin-speci…c time trend when the unit of observation is the airport-year-quarter. We cluster observations as recommended by Bertrand, Du‡o, and Mullainathan (2004), who show that without the appropriate clustering, …xed e¤ects regressions produce inconsistent standard errors.26 In addition, we report
the marginal e¤ect corresponding to the coe¢cient of the dummy variables in the semilogarithmic regression equations.27
2 6The appropriate clustering depends on how we think that airlines behave. If, as assumed by
the literature (for example, Brueckner, Dyer and Spiller (1992), Berry (1990) Borenstein (1989), Berry and Jia (2010)) airlines treat each route as an independent regional market then the clustering should be by route. This is what Gerardi and Shapiro (2009) do in their recent work. We follow their approach and in all of our regressions we cluster the unobservables by route if the unit of observation is the route-carrier-year-quarter. We cluster by airport if the unit of observation is the airport-carrier-year-quarter. And we cluster by market if the unit of observation is the market-carrier-airport-carrier-year-quarter.
2 7In order to interpret the coe¢cients of the dummy variables in the semilogarithmic regression
equation above we need to transform the estimates. This is because in a semilog regression the coe¢cient of a dummy variable, multiplied by 100, isnotequal to the percentage e¤ect of that variable on the variable being explained. Halvorsen and Palmquist (1980) show that to give the estimated coe¢cient a percentage interpretation, we need to transform the coe¢cient as follows. If the estimated coe¢cient is ^OW N then the percentage e¤ect of
5
The E¤ect of Bankruptcy Filings on Airline Networks
5.1 National Networks
The dependent variable for equation (1) in Table 4, is the natural logarithm of
N ationalN etworkjt and equals the number of origin and destination airport pairs
served by carrierjat timet. In this speci…cation we do not include year-quarter …xed e¤ects because we cannot use variation in the identity and number of participants in a local market to identify the e¤ect of bankruptcy …lings. Here, the level of geographical detail is the whole US.
Column 1presents the main speci…cation, where we include carrier …xed e¤ects and we drop observations corresponding to two quarters prior the …lings. We estimate
OW N equal to 0:233; OT HER equal to 0:256; OW N equal to 0:471; …nally, OT HER equal to0:259. They are all precisely estimated.
The economic signi…cance of each coe¢cient can be gauged by looking at the corresponding square bracket, which reports the transformed coe¢cient as described above. In particular, OW N equal to 0:233means that on average …rms reduce the
number of markets that they serve by 20:8 percentage when they are under Chapter 11.28 After emerging from bankruptcy protection, …rms that …led for bankruptcy protection serve 37:5 percentage fewer of the markets that they were serving before …ling for Chapter 11 To understand why we …nd such a strong e¤ect, recall that our unit of observation is a carrier-year-quarter. So, each carrier is approximately weighted in an equal way when we estimate the average coe¢cients. This means that the changes in the number of markets implemented by small carriers carry as much weight as the ones implemented by the large carriers in the coe¢cient estimates. To see why this observation is important, in Column 2 we exclude ATA from the dataset. Immediately we notice that the estimate of OW N drops to 0:275, which corresponds to a change of 24 percent in the number of markets served.
Now consider the e¤ect of bankruptcy …lings on the number of markets served by the rivals of the bankrupt …rms. We …nd that the rivals increase the number of
the markets they serve by almost 30percent. This change is permanent. Again this e¤ect is very large. In the other columns we will see that such e¤ect is closer to 20
percent. Column 3 presents the results when we do not use Ashenfelter’s solution, that is we do not drop observations corresponding to two quarters prior the …lings. The results are similar to those inColumn 1, which is the …rst piece of evidence that the endogeneity of the bankruptcy dummies is not empirically signi…cant. Column 4 presents the results when we also exclude the carrier …xed e¤ects. Notice that the parameters are estimated almost equal to those ion Column 3, suggesting that …rm speci…c heterogeneity is not a concern in the empirical question that we address in this paper.
We conclude the table with Column 5, where we follow a dynamic program evaluation approach. Instead of dropping observations corresponding to two quarters prior to the …ling, we add lag values of the bankruptcy categorical variables. Formally, we estimate the coe¢cients of BktOwng;t 1, BktOwng;t 2, BktOthersg;t 1 , and BktOthersg;t 2 . If the bankruptcy dummies are exogenous, the results should be the same in Column 1 and Column 5. Moreover, the lag bankruptcy dummies should be neither statistically nor economically signi…cant. This is exactly what we …nd.
Overall, the results suggest that there is very strong impact of bankruptcy …lings on the number of markets served by bankrupt …rm, but and on the number of markets served by its rivals. When looking at these results we need to keep in mind that no time speci…c controls (i.e. year-quarter …xed e¤ects) are included in the estimation because we cannot separately estimate the e¤ect of the time variables and that of the bankruptcy dummies. Next, we will consider the case where we use variation in local markets and then we can see how robust this …rst set of results is to more controls.
5.2 Airport Networks
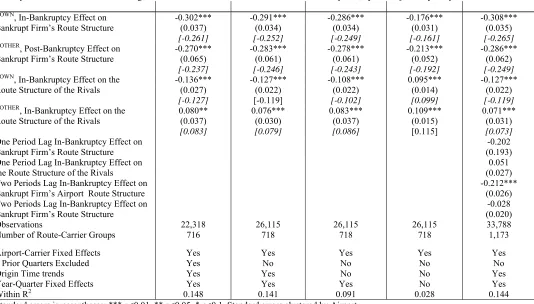
In Table 5the dependent variable is the natural logarithm of AirportN etworkjat:
Column 1 presents the results under the main speci…cation, where we include airport-carrier …xed e¤ects; year-quarter …xed e¤ects; origin speci…c time trends; and we drop observations corresponding to two quarters prior the …lings. With
AirportN etworkjat as the dependent variable we estimate OW N equal to 0:302
and OW N equal to 0:270. Both of these parameters are estimated precisely, and they should be interpreted as corresponding to a 25 percent drop in the bankrupt carrier’s network extent out of airports during and after the …ling. Interestingly the rivals of the bankrupt carrier also lower their network extent during bankruptcy …l-ings, but increase it by 8 percent after the emergence of the bankrupt …rm from Chapter 11. The e¤ects on the rivals is thus much smaller than what we found in
Table 4. This suggests that aggregate time shocks, such as 9/11, are important determinants of the number of markets served by carriers.
Column 2 reports the results when we do not drop observations corresponding to two quarters prior the …lings. The results are analogous to those in Column 1, again con…rming that the potential endogeneity of the bankruptcy dummies, while in theory a serious concern, in practice is not empirically signi…cant. Column 3
reports estimates from a regression that excludes origin-time trends. We notice that the results are the same as those inColumns 1and2, suggesting that, at least for this dependent variable there is no reason to be concerned about persistent correlation of negative unobserved current and expected demand shifts (that extend beyond the pre-bankruptcy period we eliminate) at airports served by the bankrupt airlines relative to other airports. In Column 4 we exclude carrier-origin …xed e¤ects. So this is a random e¤ect regression, where the random component is a carrier-origin unobservable. Notice that the estimated coe¢cient are remarkably smaller in this column than in Columns 1-3, where we include …xed e¤ects. This con…rms the …nding of Table 4 that heterogeneity across carriers is signi…cant. In Column 5
we implement a dynamic program evaluation approach, along the same lines as in
Column 5ofTable 4. First, we observe that the estimates of OW N, OT H, OW N,
Second, we notice that one of the lagged dummies is statistically signi…cant and its magnitude is quite large. We interpret this as evidence that, prior to bankruptcy, the insolvent …rm implements changes in its network extent, but the magnitude of such changes are not precisely estimated.
Overall the results of Table 5con…rm a strong e¤ect of bankruptcy …lings on the route structure of airline …rms. Bankrupt carriers drop markets at all their airports, with an average change of approximately25 percent. This is clearly a strong e¤ect.
6
The E¤ect of Bankruptcy Filings on Capacity Choices
6.1 Flights Frequency
The dependent variable for the regression equation (1) in Table 6 is the natural logarithm of F requencyjrt, where frequency is de…ned as the total number of ‡ights
served by carrier j in the router at timet(a year-quarter).
Column 1 presents the results of the main speci…cation, when we include route-carrier …xed e¤ects, year-quarter …xed e¤ects, origin and destination speci…c time trends, and we drop observations corresponding to two quarters prior the …lings. We estimate OW N equal to 0:242 and OW N equal to 0:397, both statistically
signi…cant. In contrast, OT H and OT H are small and imprecisely estimated. The
estimates of OW N and OW N show that bankrupt carriers drop the number of
‡ights in the routes they serve by 21:5 percent during the bankruptcy …ling and by 32:8 after their emergence from Chapter 11. The results in Column 2, where we do not drop observations corresponding to two quarters prior the …lings, suggest that there is no much evidence of an endogeneity bias of the bankruptcy dummies, since the results are the same as in Column 1. Similarly, the results inColumn 3, where we exclude the origin and destination speci…c time trends are also essentially the same as in Column 1. The results in Column 4 show that year-quarter …xed e¤ects are crucial to identify the e¤ect of bankruptcy …ling on ‡ight frequency. If we do not include year-quarter …xed e¤ects, we …nd that frequency drops by 13:7
percent instead of 21:5 percent during the …ling. We …nd that frequency drops by
there are temporal shocks that play an important role in determining the frequency decisions, which can confound the e¤ect of bankruptcy …lings on frequency. Instead,
Column 5shows that route-carrier …xed e¤ects are not crucial for the results. Thus, unobserved heterogeneity across route-carriers is not as important as in Tables 4
and 5. InColumn 6we implement a dynamic program evaluation approach. There is some small evidence that the bankrupt …rm might have started to change its ‡ight frequency before the …ling, but those changes were minimal, compared to those during and after the bankruptcy …ling. Notice that the estimates of the main parameters, , are the same as inColumn 1. Together with the results inColumns 1and 2, this suggests that the bankruptcy dummies are not endogenous in this regression.
6.2 Capacity
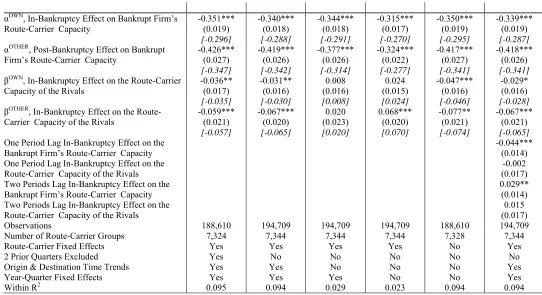
The dependent variable for the regression equation (1) in Table 7 is the natural logarithm of Seatsjrt, which is the total number of seats served by carrier j in the
route r at time t.
Column 1 presents the results of the main speci…cation, when we include route-carrier …xed e¤ects, year-quarter …xed e¤ects, origin and destination speci…c time trends, and we drop observations corresponding to two quarters prior the …lings. We estimate OW N equal to 0:351and OW N equal to 0:426, both statistically
signif-icant. OT H is estimated equal to 0:036and OT H equal to 0:059, and both are
precisely estimated. In economic terms this means that bankrupt …rms drop their capacity (seats) by29:6 percent during the bankruptcy …ling and by34:7percent af-ter the emergence from Chapaf-ter 11. Their rivals drop some of their capacity, but the e¤ect is much smaller, around5percent both during and after the bankruptcy …ling.
7
The E¤ect of Bankruptcy Filings on Prices
In this Section we reconcile the evidence on the e¤ects of Chapter 11 on capacity and network structure with the evidence on prices. We ask the following questions: How do prices change? What happens to the demand faced by the bankrupt …rm? Finally, what are the e¤ects of the bankruptcy …lings on the marginal costs of transporting a passenger?
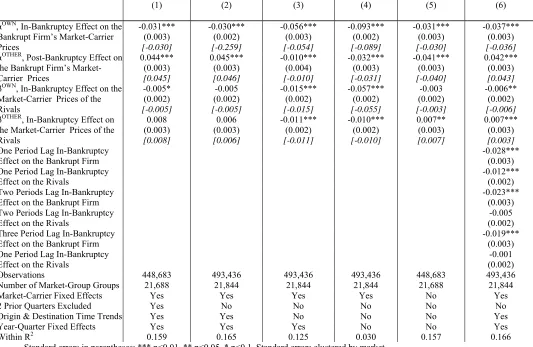
The dependent variable for the regression equation (1) inTable 8 is the natural logarithm of F arejmt, which is the median price charged by carrierj in marketmat
time t.
Column 1 reports results when we include market-carrier …xed e¤ects, year-quarter …xed e¤ects, origin and destination speci…c time trends, and we drop ob-servations corresponding to two quarters prior the …lings. Our estimate of OW N
equals 0:031and OW N equals0:044. This means that …rms lower their prices by3
percent while under bankruptcy protection, and raise them by4:4percent after their emergence from Chapter 11. We …nd that the rivals do not change their price in any statistically or economically signi…cant way, and this result is robust across the six speci…cations in Table 8.
The most surprising result here is that prices actuallyincrease after the emergence from bankruptcy protection. That is the …rst indication that bankruptcy …lings might not be e¤ectively reduce the (marginal) costs of operation.
Column 2reports results when we do not drop observations corresponding to two quarters prior the …lings. The results are indistinguishable from those inColumn 1.
The results in Column 3 show that persistent correlation of negative unobserved, current and expected, demand shifts is an important concern. The estimated e¤ect on prices are very di¤erent in Columns 1 and 3. In Column 1 we estimated OW N equal
to 0:031, while now it is equal to 0:056, almost twice as large. The di¤erence in the estimated OW N is even larger. In Column 1, we estimated OW N equal to0:044, while in Column 3 we estimate OW N equal to 0:010. We will return to this
that the linear trends adequately control for it. Column 4 excludes year-quarter …xed e¤ects, and this signi…cantly alters our results. The coe¢cient OW N equals
0:093, which would mean that under in-bankruptcy airline …rms charge prices that are almost10percent lower than in the pre-bankruptcy period. OW N equals 0:032,
suggesting that some part of the price drop is permanent. Clearly, the conclusions of our analysis would be di¤erent if we did not control for unobserved temporal shocks, such as 9/11: We would conclude that bankruptcy …lings lead to lower prices both during and after the time when a …rm is under Chapter 11 protection. In Column 5 we report results for a speci…cation with route-carrier random e¤ects. The results are essentially identical to those in Column 1. This means that the changes in prices are estimated to be the same whether we use variation in prices in markets where bankrupt airlines are present before,during, andafter a bankruptcy …ling or whether we use variation in prices in all markets. This is important for two reasons. First, it suggests that there are no selection problems since the results are the same whether or not we include route-carrier …xed e¤ects. Second, this eliminates the unlikely but potentially troubling possibility that identi…cation is just o¤ routes that airlines keep while in bankruptcy but drop them upon emerging. Column 6presents the results when we follow a dynamic program evaluation approach. Recall that this approach is useful to see the extent to which prices set by bankrupt …rms are di¤erent on time-varying unobservables that are not adequately captured by either the year-quarter …xed e¤ects or origin/destination linear trends. Given the magnitude of the results for prices, we include three lags, instead of two as in the previous tables. First, we …nd that OW N and OW N take the same values as inColumn 1. Second, we notice
that the lagged variables are small in magnitude and decline as we move further back in time from the bankruptcy …ling date. Thus, we conclude that there might still be some di¤erence on time-varying unobservables which is not picked up by the year-quarter …xed e¤ects or by the origin/destination linear trends, but such di¤erence does not signi…cantly a¤ect the estimates of the parameters OW N and OW N.
in route r, in year-quarter t; and captures airline j’s capacity utilization. This is interesting because the load factor is an indicator that tells us about the demand faced by the airlines for the following reason. We know that the bankruptcy carrier dropped its capacity and prices did not change much. If the load factor remain unchanged or is smaller, then this means that the bankrupt carrier must be facing a lower demand. If the load factor increased, then this means that the bankrupt carrier might have actually experienced an increase in its demand.
Table 9considers the case where the dependent variable is the natural logarithm of the load factor of carrier j, in route r, at year-quarter t, LoadF actorjrt. We
only run one speci…cation, where we include market-carrier …xed e¤ects, year-quarter …xed e¤ects, origin and destination speci…c time trends, and we drop observations corresponding to two quarters prior the …lings.
Columns 1and2 of Table 9 show that the bankrupt …rm’s load factordeclines
during and after its bankruptcy …ling. We know from Table 7 that the bankrupt …rm decreases the number of seats available. Together, these results suggest that the bankrupt carrier’s demand fell, and though the …rm decreased capacity and price during bankruptcy, the price fall was not enough to generate a high capacity uti-lization rate (load factor). The load factor of the competitors increases, suggesting an unambiguous shift in demand towards non-bankrupt carriers. The e¤ect on the bankrupt carrier’s demand is somewhat reversed after the …rm emerges from bank-ruptcy, since the emerging carrier is able to increase prices by more than 5 percent even though its planes are not as fully utilized as before the …ling.
7.1 Prices and Marginal Costs
explanatory power of cost driven price changes, we study changes in the marginal cost of a seat before, during, and after each bankruptcy …ling. Before we discuss this alternative explanation, it is useful to discuss in more detail the nature of marginal costs in the airline industry, and the distinction between accounting and economic opportunity cost.
The accounting marginal cost of a seat is just the passenger cost associated with issuing tickets, processing passengers through the gate, in-‡ight food and beverages, and insurance and other liability expenses. This cost is very small relative to the …xed costs faced by an airline to ‡y a plane on a route. However, as Elzinga and Mills [forthcoming] convincingly argue, the economic opportunity cost is the price of the ticket that could have been charged to another passenger to ‡y on that same plane but through a connection between two di¤erent airports. This measure of the economic marginal cost is not observable because we do not have the information to know what passengers the airline could have ‡own on that same seat. Yet, we know the lowest price that the airline charged in a quarter. The idea here is that a reasonable approximation of the economic marginal cost is the lowest ticket fare that a carrier charged across all of its routes.29 Notice that our de…nition of economic marginal cost of a seat is very helpful to clarify an apparent paradox of the role of bankruptcy …lings in the airline industry. On one hand, while under bankruptcy protection an airline might be able to decrease the usual business overhead costs, such as costs associated with sta¤ functions, general administration, brand marketing, and common-use property. On the other hand, the same airline might still be unable to lower its operating costs, which are associated with route speci…c marginal costs, such as aircraft maintenance costs or fuel costs. Thus, a bankruptcy …ling can be very successful at lowering the …xed overhead costs, but not the marginal cost of a seat. The failure of the airlines to lower their operating marginal cost is exactly what we show next.
First, we consider the traditional cost measure used in the airline industry, average
2 9This notion of economic marginal cost seems to be already in Borenstein and Rose [“Competition
cost per seat mile (CSM). The average cost to carry one passenger for one mile is known in the airline industry as the average cost per seat mile. It is constructed using the ratio of the quarterly operating expenses over the quarterly total of the product of the number of seats transported and of the number of miles ‡own by the airline. We gather data on operating expenses from the Air Carrier Financial Reports (Form41 Financial Data) and on the total number of seats and miles ‡own from the Air Carrier Statistics (Form 41 Tra¢c). The mean of the average cost per seat mile is approximately 9 cents per seat mile, and can be as low as 4 cents and as high as 13 cents. This variable is not market speci…c. Panel Iof Table 10
presents the mean CSM for each bankrupt carrier, across markets and year-quarter observations, for the periods before, during and after its bankruptcy (measured in US dollars). There is no evidence of persistent cost declines during or after a carrier’s …ling. In the case of United Airlines, the average CSM prior to the bankruptcy …ling is 9:4 cents, marginally rising during bankruptcy to9:8cents, and continuing to rise after United’s exit from bankruptcy, to10:6 cents.30 Similar results hold for USAir’s …rst …ling, where average CSM pre- and during bankruptcy was 12:1 cents, rising marginally to12:5cents post bankruptcy. For ATA, Delta, and Northwest we observe that the average CSM increases while the …rm operates under bankruptcy. ATA and Northwest marginally lowered average CSM after exiting bankruptcy relative to the in-bankruptcy CSM, yet Delta continues to increase its CSM. It is only in the case of USAir’s second …ling that we observe a decline in average CSM: pre-bankruptcy this was 12:5 cents, dropping to 11:4 during bankruptcy, and continued to fall after USAir exited court protection. The unusual cost pattern observed to USAir’s second …ling can be explained by the carrier’s exit strategy: USAir emerged after merging with low cost carrier America West.31
3 0Another way to look at this issue is to consider the numerator and denominator of the CSM
separately. The numerator is given by the total operating costs. In the case of United, for example, the total operating costs were, on average, equal to $1,259,990,000 before the bankruptcy …lings, and equal to $1,660,385,000 after the exit from bankruptcy. So the total operating costs increased by 30%. As for the denominator, the number of seat-miles before …ling for bankruptcy protection was equal to 1.39e+10 seat-miles and equal to 1.58e+10 after the exit from bankruptcy. So the denominator increased by 13%. Overall the CSM for United increased.
3 1In Figures that are available from the authors, we report a time series of CSM for United Airlines
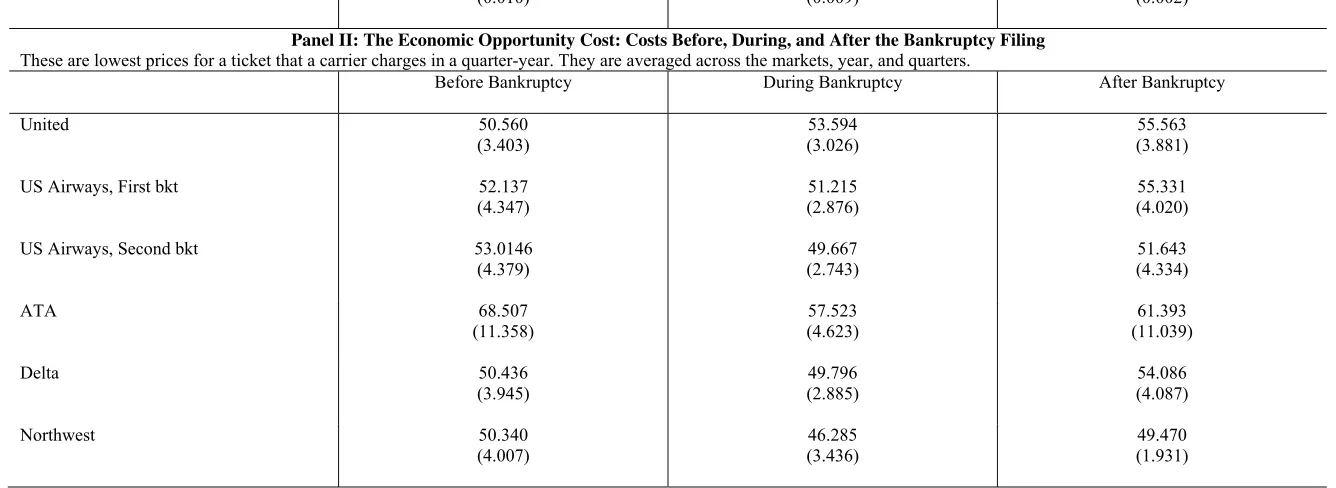
Following our discussion above, for each of the bankrupt carriers, we compute the lowest ticket fare across markets and year-quarters and summarize it in Panel IIof
Table 10. As with the evidence for average CSM, we do not …nd signi…cant changes in the economic opportunity costs during or after the bankruptcy …ling. Except for United Airlines’ bankruptcy, all other bankrupt carriers temporarily lower economic costs during bankruptcy, only to increase it again once it emerges from bankruptcy. The pre-bankruptcy economic cost for USAir’s …rst …ling was54:14dollars, falling to
51:22 dollars during bankruptcy, and rising to 55:33 dollars after the carrier exited bankruptcy protection. For Delta, pre-bankruptcy economic cost was 50:44 dollars, barely falling to49:80dollars during bankruptcy, only to rise above its pre-bankruptcy cost to54:09dollars after exiting bankruptcy. In the cases of ATA and USAir second …ling, the post-bankruptcy economic cost is above the in-bankruptcy cost, but still slightly below the pre-bankruptcy one; for instance, ATA’s pre-bankruptcy cost was
68:51 dollars, falling to 49:67 dollars during bankruptcy, and rising to 51:64 post-bankruptcy (relative to the in-post-bankruptcy cost). These results on economic costs, pre-, duringpre-, and post- bankruptcypre-, do not support the hypothesis that …rms operating under Chapter11 signi…cantly and permanently lower operating cost.
8
Conclusions
Our paper empirically examines whether a …rm’s bankruptcy …ling a¤ects product market competition, using evidence from the US airline industry. We …nd that bank-ruptcy …lings lead to a reduction of capacity and prices in the industry. Together with the fact that we do not …nd any evidence of changes in the marginal cost of transporting a passenger, our results suggest that bankruptcy …lings are e¤ective at reducing …xed costs but not marginal costs.
To our knowledge, there is no simple theoretical connection between bankruptcy …lings and market competition. Nonetheless, our results are consistent with the
idea, often repeated in the mass media, that bankruptcy …lings are the result of wars of attrition over capacity and network cutbacks. Since capacity cutbacks are a public good that must be provided privately, each …rm waits for its competitors to cut capacity …rst.32 Unless the industry outlook improves, the …rm generating the
lowest cash ‡ows and with the weakest …nancial position becomes unable to meet its debt obligations, ultimately having to seek bankruptcy protection. Firms engage in such a war of attrition when Chapter 11 of the U.S. Bankruptcy Code is an option, since this law protects the insolvent …rm from liquidation by creditors, and allows the …rm to void contracts and reorganize its business strategy, e¤ectively granting the …rm a second chance at life. Operating under Chapter11, the insolvent …rm reduces capacity and downsizes its network, which can lead to higher product-market prices. This is the channel through which we link bankruptcy …lings to product market price, capacity, and network e¤ects.
Our analysis is restrictive in a number of aspects and suggests numerous exten-sions, which constitute themes for future research. First, our paper focuses on the e¤ect of bankruptcy …lings on product market competition, but it would be equally interesting to investigate the determinants of bankruptcy …lings. That new research might look in more detail into the role of the entry and expansion of low cost carriers. On the one hand, it is doubtful that it was the advent of low cost carriersper se that led to bankruptcy …lings since bankruptcies were pervasive at the beginning of the 1990s, before the surge in the number of LCCs. On the other hand, the expansion of low cost carriers in the contemporary US airline industry might have accelerated the number and frequency of bankruptcy …lings as well as their duration.
Second, another important feature of a bankruptcy …ling is the shift of control from equity to debt holders. We do not incorporate such a change in our paper, as we assume that the objective of the …rm is to maximize pro…ts, regardless of the ownership structure. Future research might look into the bargaining between di¤erent agents. Eraslan (2007) and Eraslan and Yilmaz (2007) have made important contributions on this while looking at personal bankruptcies.
Finally, our paper uncovers stylized empirical patterns and suggests a unifying explanation. An interesting and challenging line of research would be to estimate a structural dynamic model of competition that incorporates the possibility of wars of attritions among airline …rms along with the possibility to …le for bankruptcy protection. An important contribution in this direction has been made by Takahashi [2010], who estimates the impact of competition and exogenous demand decline on the exit process of movie theaters in the US from 1950-1965. Takahashi shows that theaters that are making negative pro…ts may choose to remain in the market if they expect to outlast their competitors, because at that point their pro…ts would increase. Takahashi shows that this creates a signi…cant delay in the exit process.
9
References
Viral V. Acharya and Krishnamurthy V. Subramanian, "Bankruptcy Codes and In-novation," Review of Financial Studies, 22(12), 4949-4988, 2009.
Ashenfelter O., “Estimating the E¤ect of Training Programs on Earnings,” The Review of Economics and Statistics, Vol. 60, No. 1 (Feb., 1978), pp. 47-57.
Bamberger Gustavo E., Carlton, Dennis W., ”Airline Networks and Fares,” Hand-book of Airline Economics, 2nd ed., Darryl Jenkins, ed., McGraw Hill (2003).
Berry, Steven., “Airport Presence as Product Di¤erentiation,” American Economic Review, May, 1990, 80, 394-399.
Berry, Steven, “Estimation of a Model of Entry in the Airline Industry,” Econo-metrica 1992, 60, 889-917.
S. Berry and P. Jia , “Tracing the woes: An empirical analysis of the airline industry. MIT, Working Paper, 2010
Marianne Bertrand & Esther Du‡o & Sendhil Mullainathan, 2004. "How Much Should We Trust Di¤erences-in-Di¤erences Estimates?," The Quarterly Journal of Economics, MIT Press, vol. 119(1), pages 249-275, February.
Sanjai Bhagat, Nathalie Moyen, Inchul Suh, "Investment and internal funds of distressed …rms," Journal of Corporate Finance, 11, pp. 449-472.
U.S. Airline Industry,” Rand Journal of Economics, Autumn 1989, 20: 344-365 Borenstein Severin, and Rose, Nancy, “Bankruptcy and pricing behavior in the US airline markets,” American Economic Review Papers and Proceedings, May 1995, 85, 397-402
Borenstein Severin and Rose Nancy, “The Impact of Bankruptcy on Airline Service Levels,” American Economic Review Papers and Proceedings, 93 (May 2003).
Bris, Arturo, Welch, Ivo, and Zhu, Ning, “The Costs of Bankruptcy”, The Journal of Finance, 2006, 61, 1253-1303.
Brueckner Jan K., and Spiller, Pablo, “Economies of Tra¢c Density in the Dereg-ulated Airline Industry,” Journal of Law and Economics, October 1994, 37, 379-415. Jan K. Brueckner & Nichola J. Dyer & Pablo T. Spiller, 1992. ”Fare Determina-tion in Airline Hub-and-Spoke Networks,” RAND Journal of Economics, The RAND Corporation, vol. 23(3), pages 309-333, Autumn.
Brueckner and Zhang, 2001 J.K. Brueckner and Y. Zhang, A model of scheduling in airline networks: how a hub-and-spoke system a¤ects ‡ight frequency, fares and welfare, Journal of Transport Economics and Policy 35 (2001), pp. 195–222. View Record in Scopus jCited By in Scopus (23)
Campello, Murillo, “Debt Financing: Does it Boost or Hurt Performance in Prod-uct Markets?” Journal of Financial Economics, 2006, 83, 135-172.
Carapeto, M, 2005, "Bankruptcy bargaining with outside options and strategic delay," Journal of Corporate Finance, 11, pp. 736-746.
Chevalier, Judith, “Do LBO Supermarkets charge more? An empirical analysis of the e¤ects of LBO on supermarket pricing„” Journal of Finance, 1995a, 50, 1095-1112. Chevalier, Judith, “Capital Structure and Product-Market Competition: Empir-ical Evidence from the Supermarket Industry,” American Economic Review, 1995b, 85, 415-435.
Chevalier, Judith, and Scharfstein, David, “Capital-Market Imperfections and Countercyclical Markups: Theory and Evidence,” The American Economic Review, September 1996, 86, 703-725.