Munich Personal RePEc Archive
RD and productivity in the Indian
pharmaceutical firms
Sharma, Chandan
Department of Economics, National Institute of Financial
Management, Faridabad
12 February 2011
Online at
https://mpra.ub.uni-muenchen.de/31681/
Abstract
Recent researches for developing countries suggest knowledge generating activates is no silver
bullet for productivity growth. In this context, this paper examines the impact of R&D activities
on firms’ performance for the Indian pharmaceutical industry by utilizing the data of the post
reform period (1994-2006). The empirical analysis is performed in two stages. In first stage, we
examine the relative productivity performance of R&D vis-à-vis non- R&D. Subsequently, we
construct two empirical frameworks, namely, growth accounting and production function.
Results of analysis indicate that R&D firms have productivity edge over non- R&D firms.
Regression results based on the growth accounting framework suggest that R&D intensity has a
positive and significant effect (15%) on TFP. The results also confirm that the performance of
foreign firms operating in the industry is more sensitive towards R&D than the local firms.
Furthermore, the estimation results of the production function approach indicate that the output
elasticity to R&D capital varies from 10% to 13%. Therefore, we support the argument that
‘manna from heaven’ impact is large and significant.
JEL classification: O30, D24
Keywords: Productivity; R&D; Indian Pharmaceutical
*
Assistant Professor, Department of Economics, National Institute of Financial Management, Faridabad-121 001, Haryana, India.
Address for communication:
2
The pharmaceutical industry in India has completely transformed itself since around the
mid-1990s when Trade-Related Aspects of Intellectual Property Rights (TRIPS) came into effect. It is
not only that the amount of research and development (R&D) expenditure has increased
substantially, but also a sharp change in the structure of R&D activities has been witnessed in the
industry. While in the past, the firms were mainly focused on development of new processes for
manufacturing drugs, now they are also engaging aggressively in R&D for new chemical entities
(NCEs) and modification of existing chemical entities to develop new formulations and
compositions. Furthermore, the fiscal incentives for doing R&D have also grown significantly in
the recent years. In this context, this study attempts to answer a question that how firms’
in-house R&D affects their performance indirectly through total factor productivity (TFP) and
directly on output in the Indian pharmaceutical manufacturing? The question that we deal in this
paper is relevant and one would like to have an answer for.
In a pioneer study Solow (1957) recognized that technological change is one of the key driving
factors of productivity growth. Proponents of recently developed endogenous growth theories
3
deliberate investment of resources by profit-seeking firms (Grossman and Helpman, 1990;
Smolny, 2000). The theory also accepts the fact that a firm’s innovation activity is crucial to its
technological progress and productivity growth. Klette and Grilliches (1996) extended the
edogenous growth theory for R&D and productivity linkage in the context of firm and
presented the quality ladder model in a partial equilibrium framework. The model explains that
R&D investment and innovations are the engine of growth. Thus, the theortical linkage between
R&D activities and productivity of firms is well established in the literature.
In the empirical literature too, there is no dearth of study on R&D and firm’s or plant’s
performance. Most of these studies are invariably found to have a significant and positive effect
of R&D on the performance of firm. However, the estimated elasticity of productivity or output
with respect to R&D varies widely in these studies (e.g. see Griliches, 1979, 1986, Griliches and
Mairesse, 1990, Jaffe, 1986, and Griffith et al., 2006).1 Some recent studies for the developed
countries, for example, O’Mahony and Vecchi, (2009) suggested that knowledge generating
activates is no silver bullet for productivity growth and ‘manna from heaven’ impact is very
small. A closer look on the related empirical literature reveals several reasons for a wide
variation in the elasticity estimation. First, these results are observed to vary to the type of
industry in consideration as in R&D intensive industries, by and large, elasticity is found to be
larger. Second, the choice of the estimation technique is another source of the divergence. In
several studies, application of different econometric techniques has yielded wide variation in the
results on the same data (e.g. see O’Mahony and Vecchi, 2009). Third, it is also observed that a
vast variation exists in results between firm-level and industry-level data.2 Finally, the size of
elasticity also depends heavily on the choice of the indicator of firm’s performance (on the
dependent variable) i.e. output, labor productivity, TFP and profit.
1
Considering the example from firm-level studies, Griliches (1979, 1986) found that the elasticity to R&D in the US manufacturing was around 0.07. In France, it was found that the elasticity was larger than in the US and it ranged between 0.09 and 0.33 (Cuneo and Mairesse, 1984; Mairesse and Cuneo, 1985). For USA, Jaffe (1986) estimated the elasticity around 0.20. For the same country, Griliches and Mairesse (1990) found it is ranging between 0.25 to 0.45, while in the same study, for Japanese manufacturing it was found to be ranging between 0.20 to 0.50. However, for Taiwanese manufacturing firms, Wang and Tsai’s (2003) estimation suggested it as 0.19. In a recent paper, Griffith et al. (2006) for the UK manufacturing firms found the size of the elasticity too low (ranging from 0.012 to 0.029). In the case of India, the elasticity with respect to value added was calculated to be 0.064 in the heavy industries, 0.357 in the light industries and 0.101 in the overall industries (Raut, 1995).
2
4
Against this backdrop, we are set to investigate the role of R&D on performance of firms in the
Indian pharmaceutical industry. We take up the issue in an innovative way, and attempt to
investigate the relationship for a very recent period (1994-2006). We take into consideration two
important indicators of firms’ performance, namely output and TFP, for the empirical analysis.
This investigation is very relevant from a policy perspective, mainly, because contrary to the
general perception that pharmaceutical industry in general is very sensitive to R&D activities, the
Indian pharmaceutical industry is known for its low research intensity. Nevertheless, in recent
years as regulatory environment has changed, firms are exposed to intense both in national and
international market. This has encouraged firms (in some cases forced) to adopt the innovative
activities as the key of the growth strategy. The recent data also validate that at least some large
firms in this industry have started taking R&D activities a bit more seriously than earlier.
The remainder of this paper is structured methodically in sections, which are as follows: Section
2 discusses R&D issue in the Indian pharmaceutical industry. Sections 3 explain data related
issues and estimates TFP of the sample firms. Section 4 compares productivity of R&D and non-
R&D firms. Section 5 constructs empirical models and estimates the effects of R&D on Firms’
Performance. The final section lays out concluding remarks and policy suggestions.
During the postwar years and subsequently for a long period, the developing countries in general
and India in particular had remained net users, rather than developers of R&D intensive
pharmaceutical products. This was due to evident and obvious reasons of inadequate investment
resources, lack of sufficient skill in medicinal chemistry and high risky uncertain nature of such
investment and embryonic R&D infrastructure in most of these countries. Another question of
developing countries adopting R&D and patent protection policy has been a debatable issue
among the academia and the industry. For example, following the writings of Penrose (1951),
Vaitsos (1972) and Greer (1973), it has been argued that developing countries lose by granting
patent protection since the costs of patent protection outweighs its benefits and consumers suffer
from higher drug prices resulting from patent monopolies. In India, for instance, many of the
pharmaceutical multinational corporations (MNCs) operated through their subsidiaries and
enjoyed product patent regime and high price. As a case of non-affordability of drugs by a large
section of the population, the government abolished product patent protection in 1972 and drugs
5
this situation by developing generics for our highly regulated market under the process patent
protection of drugs.
Even when the 1994 Agreement on Trade-Related Aspects of Intellectual Property Rights
(TRIPs) which made mandatory product/process patent protection for World Trade Organization
(WTO) member countries, it had again been initiated a debate that whether developing countries
gain technologically from strong IPRs (patent regime). Empirical investigations show rather
mixed results. For example, Sakakibara and Branstetter (2001) show that patent regime is not
positively correlated with R&D activities in Japan. On the contrary, Mascus and Dougherty,
(2005) in a recent study on China proclaim a positive relation between patents and R&D.
India signed the 1994 TRIPs Agreement and Indian companies established themselves as
suppliers of active pharmaceutical ingredients (APIs) and intermediates to MNCs. Ever since the
product patent regime was launched on 1 January 2005, domestic pharmaceutical companies
have increased their allocation for R&D and their structure of R&D activities. At present, the
Indian drug and pharmaceutical industry is ranked as the fourth largest in terms of volume and
thirteenth in terms of value in the world. The industry accounts for about 8% of the total world’s
drug production (OPPI, 2008). By far, the Indian industry’s forte remained in generic product
market; and this has been propelled by reverse engineering skills and also low cost advantage.
The pharmaceutical products price is ruled at relatively low level, both in the domestic as well as
in export markets. Currently, Indian companies, on an average, spend about 5% turnover (OPPI,
2008) on R&D, which is much lower as compared to companies of most of the developed
countries where this percentage varies between 15 to 20%. Traditionally, Western MNCs have
dominated the pharmaceutical industry and their competitive edge has been in basic R&D, new
drug discovery, new chemical entities (NCEs) and bio-technology supported by patent regime till
end-2004. It is then no longer a surprise that these MNCs could invest massively in R&D, bear
with high risk and long gestation period for new drug discovery and thereby reap monopoly
profits.
Why Indian companies have hitherto invested very little in R&D for new drug discovery and
NCEs? The industry circle possibly explains this phenomenon by two important factors. First,
the industry lacks product patent protection regime, massive investment requirement and highly
risky nature of such investment. Second, Indian price control regime also tended to squeeze the
6
Nevertheless, in the recent years, the outlook of the industry has changed considerably and firms
in India have started taking R&D activities more seriously and more money is being invested
now in these activities (see Figure 1). There can be many reasons behind this change in the
attitude of Indian firms relating to the R&D activities. First, fiscal incentives and government
support has encouraged firms for R&D. Recently the government has started many new tax
exemptions schemes and most of the old such schemes are extended.3 At second place, new
patent regime has also encouraged and forced Indian firms to take up the R&D activities more
seriously, if they have to survive in the market. As a result investment in R&D for developing
new drugs has surged since TRIPS came into effect (since 2005). According to the current
estimates there are at least 10 to 15 domestic Indian pharmaceutical companies that are active in
drug research and have research centers across the country. Table 1 presents the share of pay-out
on R&D by 10 large firms of the pharmaceutical industry, which demonstrates clearly that in
recent years these firms have increased their pay-out on the innovation activity sufficiently.
Major domestic companies such as Dr Reddy’s Lab, Ranbaxy, Wockhardt, Lupin and Cipla have
realized that R&D is the key to success for their growth and expansion plans in this industry.
Consequently, they have started demonstrating change in the structure of their R&D activities.
These companies have comparative advantage in undertaking R&D activities locally as i) R&D
expenditure in India is far lower than in developed countries and cost differentials are reflected
in lower costs of machinery, equipment and intellectual capital; ii) India’s large population base
facilitates clinical trials (CTs) for diseases prevalent in tropical countries; iii) Many of the Indian
pharmaceutical firms have been accredited by regulatory agencies such as World Health
Organization (WHO) and United State Food and Drug Administrator (US-FDA) and they have
turned to contract research and manufacturing.
More recently, growth through overseas acquisitions has been one of the stated strategies of large
pharmaceutical companies to undertake risky R&D investments and, enhance the skill levels of
3
Some of important fiscal benefits are as follows:
7
their employees by networking and leveraging their assets. The R&D focus of these companies
has been on biopharmaceuticals, new chemical entities (NCEs), and novel drug delivery systems
(NDDSs).
In this changing scenario and backdrop of findings of recent empirical literature, it becomes
relevant to test the role of in-house knowledge activities on firms’ performance in the Indian
pharmaceutical industry.
(Source: Prowess Database, CMIE, 2008)
! " #$% " & ! "
2000 2001 2002 2003 2004 2005 2006 2007 2008
Aurobindo Pharma Ltd. 1.92 0.86 1.25 1.85 3.65 4.67 4.39 4.86 4.88
Cadila Healthcare Ltd. 4.74 8.32 7.50 3.88 7.76 8.96 8.86 10.14 9.20
Cipla Ltd. 3.89 3.85 3.34 0.00 2.75 4.10 5.01 4.80 5.41
Dr. Reddy'S Lab Ltd. 2.68 4.17 6.32 10.17 12.88 18.18 11.79 6.98 9.22
Glaxosmithkline P. Ltd. 0.43 0.35 0.33 0.29 0.30 0.28 0.36 0.33 0.70
Glenmark Pharma Ltd. 3.58 11.98 4.66 9.17 9.75 9.05 5.32 6.12 4.68
Lupin Ltd. 0.74 5.45 6.10 3.57 3.84 6.86 6.29 6.93 7.27
Orchid C & P Ltd. 1.26 3.79 4.12 5.13 5.56 7.57 6.95 6.74 5.67
Figure: 1
Growth of Sales and R&D Expenditure in the Indian Pharmaceutical Industry
8
Piramal Healthcare Ltd. 1.89 1.78 2.12 1.60 3.87 8.28 6.04 6.29 1.76
Sun Pharma Inds. Ltd. 3.94 4.47 4.84 8.33 12.06 11.11 11.94 10.93 5.95
(Source: Prowess Database, CMIE, 2008)
' # (
Firms’ data of the Indian Drug and Pharmaceutical industry are mainly obtained from the
Prowess4 database provided by Center for Monitoring Indian Economy (CMIE). The analysis
includes only firms (358 firms) which have consistent data in the study period (1994 to 2006).
Details of variables, their definitions and sources are discussed in Table 1. A descriptive
statistics of data series is reported in Table 1A of Appendix.
) " * ++,- ../
Variable Definition Data source
Gross value added of the firms Prowess
Number of workers Prowess
Computed as follows: =(1−
δ
) −1+where K is the capital stock, I is deflated gross
investment, and δ is the rate of depreciation
taken at 7%.
Prowess
R&DInt)
R&D expenditure of firms divided by their
sales
Prowess
R&DCap)
Annual expenditure on R&D of firms Prowess
Export)
Export of firms divided by their sales Prowess
4
9 Import)
Total import (raw material and finished goods)
of firms divided by their sales.
Prowess
! Expenditure on raw materials of firms Prowess
! " Expenditure on power and fuel of firms. Prowess
# $ Value of sales of firms Prowess
Note: all series are deflated with appropriate deflator before any econometrics treatment.
In order to examine the role of R&D on firms’ performance, firstly we need to estimate TFP of
our sample firms. In this process, the OLS approach of measuring TFP of firms as the difference
between actual and predicted output may lead to omitted variable bias since the firm’s choice of
inputs is potentially correlated with unobserved productivity shocks. To overcome this problem
we use the Levinsohn-Petrin (2003) technique. This procedure utilizes firms’ intermediate inputs
as proxies to correct for the part of the unobserved productivity shock correlated with firms’
inputs. Following this approach, we estimate a Cobb Douglas production function in following
form:
η
ω
α
α
α
+ + + += ( ) ( )
)
( 0 1 2 ……….1
where Y, N and K denote value added, labor and capital, respectively of firm i in year t. Ln
indicate that series are transformed in logarithm before any econometric treatment. In this model
(equation 1) the error has two parts: first is ω, which represents the transmitted productivity
component, while η is an error term that is not correlated with inputs. ω is affected by firms’
policy, and it is unobserved (for details of this methodology, see Levinsohn-Petrin, 2003, and
Sharma, 2010). Results of the estimated production function are reported in Table 3, which
suggests that both inputs have significant impact on output of firms. On the basis of this
estimation, TFP of our sample firms is predicted for further analysis.
'
Cobb- Douglas Production Function Estimation using Levinsohn-Petrin Productivity Estimator
10
Variables Coefficient Z-value
Ln(K) 0.26801* 2.50
Ln(N) 0.60809* 13.33
Wald test (P-Value) 0.1667
Notes:
1. Wald test of constant returns to scale.
2. Proxy variables: Power and fuel expenses; and Raw material expenses.
3. * indicate statistical significance at the 5%.
, 0 % 1 - 2
In order to examine the role of R&D, we ask an important question ‘Are R&D Firms more
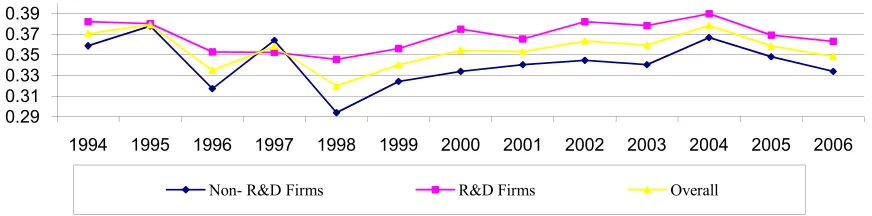
productive than Non- R&D Firms?’ To answer this question, we begin the investigation
comparing R&D firms and non- R&D firms, by plotting their average annual estimated TFP,
which is presented in Figure 2. The comparison of the groups of firms reveals that firms those
firms which have in-house R&D facilities are more productive than non-R&D firms on an
average. Further, a closer look also reflects that before the year 2000, the difference between the
groups was fluctuating, however, after this period the gap is consistently maintained. This is the
first indication we receive about the R&D’s role, which is quite positive and encouraging.
(Source: Author’s calculation)
Taking forward our investigation at the next level, we compare the distribution of TFP of both
types of firms. We conduct a two-sided non-parametric Kolmogorov-Smirnov test (KS-test) to
[image:11.612.63.542.93.178.2] [image:11.612.80.516.515.623.2]determine whether the TFP distributions between the two groups differ significantly. The KS-test
Figure 2
Average Estimated TFP, R&D vis-à-vis Non- R&D Firms
11
calculates the largest difference between the observed and expected cumulative frequencies,
which is called D-statistics. These statistics are compared against the critical D-statistic for the
sample size. For this purpose, we consider three important years of the sample period: 1994,
2003 and 2006.5 The results of the two-sided KS-test are shown in Table 4, which reveal the TFP
distribution of R&D firms stochastically dominates those of non- R&D firms at least in the late
reform years, i.e. 2003 and 2006. However, in the initial year (1994), the difference is not found
to be statistically significant at any reasonable level. At this stage, we can also conclude that the
evidence supports the hypothesis that in the whole sample of firms R&D firms stochastically
dominate non- R&D firms at least in the recent years.
, 3 ! - " -4- 1 - * ++,- ../
Serial
No.
Group Largest Difference (D)
1994 2003 2006
1 %0: & − & ≤0 0.2049
(0.256)
0.3314**
(0.032)
0.3282*
(0.097)
2 %0 : & − & ≤0 -0.1954
(0.290)
-0.0714
(0.852)
-0.0051
(0.999)
3 Combined K-S 0.2049
(0.205) 0.3314* (0.064) 0.3282 (0.194) &
'( -values based on the bootstrap approximation are in parentheses.
2. ** and * denote for statistically significant at 5% and 10%, respectively.
5 # ! #"" " 6 "
Now we investigate the impact of R&D on TFP and output of the sample firms. Our study
constructs two frameworks. The first is a growth accounting framework, which allows an
indirect impact of R&D on productivity through TFP, within the endogenous growth framework.
5
12
This framework is followed by a production function approach, in which R&D capital directly
enters in the aggregate production function as an input.
We start our empirical modeling with the growth accounting framework. Under this approach we
broadly follow Coe and Helpman (1995) and Atella and Quintieri (2001) and test R&D intensity
( ) on the estimated TFP of firms. Therefore, our baseline empirical model to be
estimated is as follows:
)
*+ =
α
+γ
(R&Dint )+β
+ ……….2where *+ and are the level of TFP and R&D intensity, respectively of firm in period
( R&D intensity is measured by the ratio of R&D expenditure to sale of firms. In the equation, X
is a vector of firm characteristics, u is error term and
α γ
, and β are parameters to be estimated.Ln indicates for logarithm transformation of the variables.
We estimate equation 2 in four alternative ways and their results are reported in Table 5. Column
1 of the table presents results of the model in which only R&D intensity is the explanatory
variable. Columns 2, 3 and 4 include firm-specific characteristics (control variables), i.e. size,
export intensity (export) and import intensity (import).6 Column 3 also includes a dummy for
foreign firms (FD) (if foreign firm, FD=1, otherwise 0), while column 4 includes an interaction
variable of foreign firm dummy and R&D intensity. One previous year’s lag of dependent
variable is included in columns 2, 3 and 4, to tackle the potential endogeneity. The results show
that the R&D intensity elasticity to the productivity is positive and varies from 0.15 to 0.19. This
implies that 1% increase in R&D intensity leads to 0.15% to 0.19% increase in TFP. This
estimate is relatively lower than the findings for France (Cuneo and Mairesse, 1984 and Hall and
6
13
Mairesse, 1995) and for Taiwan (Wang and Tsai, 2003). However, it is larger than that of US
(Mairesse and Hall, 1996), UK (Kafouros, 2005) and Japan (Sassenou, 1988). The impact of
foreign firm dummy is also found to be significant and positive on TFP (see column 3), which
suggests that foreign firms are more productive than the local firms in the industry. Surprisingly,
the estimated coefficient of the interaction variable of R&D to foreign firm dummy is found to
be sizably large (0.36) (see column 3 of Table 5). This can be interpreted as 1% increase in R&D
intensity of foreign firms’ leads to 0.36% increase in their TFP, which is one of the largest
findings in a comparison with that of related literature. Further, the results regarding the trade
variables i.e. export and import intensities are not found to have any significant effect on the
productivity. However, size of firm (which measures economies of scale) seems to be crucial as
coefficient of this variable found to be sizable, positive and statistically significant on the
productivity.
5 #"" " * ++,- ../
1 2 3 4
Ln(R&Dint) 0.1925*
(1.943)
0.1516*
(1.983)
0.1542*
(1.994)
Ln(Export) -0.0093
(-0.999)
-0.3742
(-0.374)
-0.0034
(-0.384)
Ln(Import) -0.0070
(-0.483)
-0.004
(-0.291)
-0.0096
(-0.673)
Ln(size) 0.1289*
(13.391) 0.0096* (13.324) 0.1292* (13.401) Foreign Firm Dummy (FD) 0.0157* (3.347)
TFP(-1) -0.1857*
(-9.719) 0.0196* (-10.228) -0.1814* (-9.691) Ln(R&Dint) * FD 0.3632* (1.955)
Constant 0.3512
(41.33) 0.0601* (9.1159) 0.0617* (9.329) 0.0592* (9.018)
14 Notes:
1. t-values in parentheses.
2. * indicates statistical significance at 5% level.
3. Estimation technique is Random GLS.
Next we shift our attention to estimate the impact of R&D capital on output of our sample firms.
In so doing, a production function approach is utilized, Griliches (1980), Schankerman
(1981) Bartelsman et al., (1996) and Branstetter and Chen (2006). Here our base-line
specification is:
ε
α
α
α
α
+ + + += ( ) ( ) ( & )
)
( 0 1 2 3
………..3
where Y, N, K and R&Dcap represent value added, labor, physical capital and R&D capital,
respectively. R&D capital is a measurement of the stock of knowledge possessed by a firm at a
given point of time.7 , and denote logarithms of the variables, firm and year, respectively.
α
1,
α
2andα
3are parameters to be estimated. We are especially interest inα
3, because this is themeasure of output elasticity to R&D capital.
We estimate equation 3, by three estimators: fixed effect, random effect and system GMM.
Estimating the model using Ordinary Least Squares (OLS) with fixed or random effect usually
provides estimates that are generally consistent with knowledge of factor shares and
constant returns to scale (Griliches and Mairesse, 1995). However, the procedure may produce
biased and inconsistent estimates in the presence of endogeneity (Griliches, 1979). Therefore,
following O’Mahony and Vecchi (2009), we also apply system GMM. The technique
significantly reduces the weak correlation problem, and has proved to give more reasonable and
reliable results in the context of production function estimation (Blundell and Bond, 2000).
The estimated result of equation 3 is presented in Table 6. The system GMM estimator
significantly reduces the size of parameters of labor and capital in comparison with estimate of
fixed and random. However, the coefficient of our prime interest, R&D capital is almost
7
15
invariant to the use of the estimators. Results of the estimations suggest that the output elasticity
to R&D capital varies from 10% to 13%, implies 1% increase in R&D capital leads to 0.10 to
0.13% growth in firms’ output. This estimate is broadly in accordance with the estimates of
Griliches (1979, 1984) for the U.S., larger however than that of Branstetter and Chen, (2006) for
Taiwan, and O’Mahony and Vecchi, (2009) for three European countries. Also, our estimated
elasticity is substantially larger than that of Raut (1995) for India, who finds it significant,
however, a lower of the magnitude (0.016%).
/ #"" " 7 % " * ++,- ../
Variables (1)FE (2)RE (3)System GMM
Ln(K) 0.243*
(5.74)
0.257*
(7.71)
0.147*
(2.58)
Ln(N) 0.489*
(11.75)
0.553*
(16.44)
0.381*
(8.14)
Ln(R&DCap) 0.117*
(5.34)
0.132*
(6.57)
0.101*
(3.53)
Sargan 0.171
R2 0.9141 0.9147
Notes:
1. t-values in parentheses.
2. * indicates statistical significance at 5% level.
3. Sargan is the p-value from the Sargan (1958) test of over-identifying restrictions, which test
the overall validity of instruments for the GMM estimators.
4. FE and RE denote fixed effect and random GLS estimator, respectively.
/ !!
Findings of this study suggest that in-house R&D activities of firms are crucial determinates of
productivity and output of the Indian pharmaceutical firms. The evidence clearly that suggests
R&D firms are more efficient than non- R&D firms at least in the recent years. Furthermore,
results of the regression analysis suggest that R&D intensity has a strong, positive and significant
16
studies. The results also confirm that foreign firms operating in the industry are more sensitive
towards R&D activates than the local firms, as interaction of their dummy with the R&D
variable yield elasticity to 0.36, which is meant that 1% increase in R&D intensity of foreign
firms leads to 0.36% growth in their TFP. Finally, we investigate the effects of R&D capital on
firms’ output under the production function framework. The results indicate that the output
elasticity to R&D capital varies from 0.10 to 0.13, implies 1% increase in R&D capital leads to
0.10 to 0.13% growth in firms’ output. This finding is moderate in a comparison with the
estimated elasticity for other countries. The estimated size of the elasticity in the Indian
pharmaceutical in this study is equivalent to that of Griliches (1979, 1984) for the U.S.,
substantially larger however than that of Branstetter and Chen, (2006) for Taiwan, and
O’Mahony and Vecchi, (2009) for three European countries. Therefore, we support the argument
that ‘manna from heaven’ impact is large and significant.
Considering the findings of this study on the crucial role of R&D in stimulating output and
productivity, it is a worrying factor that the Indian pharmaceutical is characterized by low R&D
intensity. Thus, the policy suggestion is straightforward that the government should encourage
firms for R&D activities through different ways which may include fiscal incentives, training
and institutional collaboration. Moreover, foreign firms are found to be proactive in R&D
activities, which will perhaps have a positive spillover effect for the others firms in the long run
therefore flows of foreign direct investment in industry should also be encouraged. Finally,
considering the findings in this study regarding the important role of in-house innovation
activities of firms, we propose for further research in this area especially in developing countries
using micro-level data.
0 % % * ++,- ../
Variable Mean Standard
Deviation. Minimum Maximum
LY 0.946 0.844 -1.824 2.902
LK 1.1135 0.770 -1.076 2.986
LN 2.788 0.853 0.229 4.648
17
LExport 0.166 0.217 0 1
LImport 0.114 0.142 0 0.988
LR&DIntensity 0.014 0.032 0 0.588
LR&DCap -.050 0.948 -2.117 2.554
"
Atella, V., and Quintieri, B. (2001). Do R&D Expenditures Really Matter for TFP? - .
, 33(11), 1385-89.
Aw, B. Y., Chung, S. and Roberts, M. J. (2000). Productivity and turnover in the export market:
micro evidence from Taiwan and South Korea. / . 0 1 2 !, 14 (1), 65-90.
Ben-David, D. (1993). Equalizing Exchange: Trade Liberalization and Income Convergence.
3 4 " , 108 (3), 653-79.
Bernard A. B. and Jensen, J. B. (1999). Exceptional Exporter Performance: Cause, Effect, or
Both?4 " , 47 (1), 1-25.
Bernard A. B. and Bradford, J. J. (2004). Exporting and Productivity in the US. " . 2 !
" , 20(3), 343-357.
Blomström M. (1990). + 5 2 . # 2 . London: Routledge.
Blundell, R. and Bond, S. (2000). GMM Estimation with Persistent Panel Data: An Application
to Production Functions, 2 ! , 19, 321-340.
Branstetter, L. G., and Chen, J.R. (2006). The Impact of Technology Transfer and R&D on
Productivity Growth in Taiwanese Industry: Microeconometric Analysis Using Plant and
18
Coe, D. T., and Helpman, E. (1995) International R&D spillovers, 2 !,
39(5), 859-887.
Cuneo, P. and Mairesse, J. (1984) Productivity and R&D at the firm level in French
manufacturing. In: Griliches, Z. (Ed.), R&D, Patents and Productivity. University of Chicago
Press, Chicago.
Greer, D. F. (197. The Case Against Patent Systems in Less-Developed Countries. * 4
" ! . , 8, 223-266.
Griffith, R., Huergo, E., Mairesse, J. and Peters, B. (2006). Innovation and Productivity Across
Four European Countries, " . 2 ! " 22(4), 483-498.
Griliches, Z. (1986). Productivity, R&D, and Basic Research at the Firm Level in the 1970s,
- 2 !, 76 (1), 141–54.
Griliches, Z. (1979). Issues in Assessing the Contribution of R&D to Productivity. 0 4
" , 10, 92–116.
Griliches, Z., (1980). Returns to Research and Development Expenditures in the Private Sector,”
pp. 419-454 in Kendrick, J.W. and Vaccara, B. (Eds.), New Developments in Productivity
Measurement, National Bureau of Economic Research, University of Chicago Press, Chicago,
1980.
Griliches, Z., and Mairesse, J. (1990) R&D and productivity growth: comparing Japanese and
American manufacturing firms. In: Hulten, C. (ED.), Productivity Growth in Japan and the
United States, NBER studies in income and wealth, Vol. 53, University of Chicago Press, pp.
317-348.
Grossman, G.M. and Helpman, E. (1991). 2 . 6 ! 6 , MIT
19
Grossman, G. M. and Helpman. E. (1990). Product Development and International Trade, NBER
Working Paper No. W2540.
Hall, B.H., and Mairesse. J. (1995). Exploring the Relationship between R&D and Productivity
in French Manufacturing Firms. 4 " , 65, 263–293.
Hill, H. (1988). + 5 2 . . $ . . Singapore: Oxford
University Press.
Jaffe, A. B. (1986). Technological Opportunity and Spillovers of R&D: Evidence from Firms'
Patents, Profits, and Market Value. - 2 ! 76(5), 984-1001.
Kafouros, M. I. (2005). The impact of the Internet on R&D efficiency: Theory and Evidence,
* 2 , 26 (7), 827-835.
Klette, T. J. and Griliches, Z. (1996). The Inconsistency of Common Scale Estimators When
Output Prices Are Unobserved and Engogenous, NBER Working Papers 4026.
Levinsohn, J., and Petrin, A. (2003). Estimating Production Functions Using Inputs to Control
for Unobservable. 2 ! " # . 70(2), 317–342.
Mairesse, J., and Hall, B. (1996). Estimating the Productivity of Research and Development in
French and US Manufacturing Firms: An Exploration of Simultaneity Issues with GMM
Methods. In Wagner, K. and Van Ark, B. (Eds) . 2 "" .
. Elsevier Science, pp. 285–315.
Maskus, K. E. and Dougherty, S. M. (2005). Intellectual property rights and economic
development in China, in: Intellectual property and development: lessons from recent economic
research/ed. by C. Fink and K.E. Maskus 295–331
O'Mahony, M., and Vecchi, M. (2009). R&D, Knowledge Spillovers and Company Productivity
20
OPPI, (2008). The Organisation of Pharmaceutical Producers of India (OPPI), 43rd Annual
Report – 2008-09, Mumbai, India.
Penrose, E. (1951). * " # (Baltimore: Johns Hopkins
University Press.
Raut, L. K., (1995). R & D spillover and Productivity Growth: Evidence from Indian Private
Firms. 4 " 2 , 48(1), 1-23.
Sachs, J. D., and Warner, A. (1995). Economic Reform and the Process of Global Integration.
0 1 5 - 2 , 1, 1-95.
Sakakibara, M. and Branstetter, L. (2001). Do Stronger Patents Induce more Innovation?
Evidence for the 1988 Japanese Patent Law Reforms. - 4 " , 32(1), 77–
100.
Sassenou, M. (1988). Recherche-développement et productivité dans les enterprises japonaises:
une étude econométrique sur données de panel, Doctoral dissertation, Ecole des Hautes Etudes
en Sciences Sociales, Paris.
Schankerman, M. (1981). The Effect of Double-Counting and Expensing on the Measured
Returns to R&D, 2 ! " . # , 63(3), 454-58.
Sharma, C. (2010). Does Productivity Differ in Domestic and Foreign Firms? Evidence from the
Indian Machinery Industry, . 2 !, 45(1), 87-110.
Solow, R.M. (1957). Technical progress and the aggregate production function. 2 ! "
21
Sjöholm, F. (1998). Joint Ventures, Technology Transfer and Spillovers: Evidence from
Indonesian Estblishment Data”. in Economic Planning Agency, ed., + 5 2
- , papers and proceedings of an international symposium, 22-23 October, Tokyo:
Economic Planning Agency, 587-616.
Smolny, W. (2000). Endogenous Innovations and Knowledge Spillovers, Heidelberg and New
York.
Vaitsos, C. (1972). Patents revisited: Their Function in Developing Countries, 4 "
2 # . (9)1: 71-97.
Wagner, J. (2002) The Causal Effects of Exports on Firm Size and Labor Productivity: First
Evidence from a Matching Approach, , 77 (2), 287–292.
Wang, J., and Tsai, K. (2003). Productivity Growth and R&D Expenditure in Taiwan’s