Munich Personal RePEc Archive
Does bullying reduce educational
achievement? An evaluation using
matching estimators
Ponzo, Michela
University of Calabria, Department of Economics and Statistics
2 January 2012
Online at
https://mpra.ub.uni-muenchen.de/36064/
1
Does Bullying Reduce Educational Achievement?
An Evaluation Using Matching Estimators
Michela Ponzo*
In this paper, using data from the Progress in International Reading Literacy Study (2006-PIRLS) and the Trends in International Mathematics and Science Study (2007-TIMSS), we investigate the impact of being a victim of school bullying on educational achievement for Italian students enrolled at the fourth and eighth grade levels. Firstly, we apply an OLS estimator controlling for a number of individual characteristics and school fixed effects. Secondly, in order to attenuate the impact of confounding factors, we use propensity score matching techniques. Our empirical findings based on average treatment effects suggest that being a victim of school bullying has a considerable negative effect on student performance at both the fourth and the eighth grade level. Importantly, the adverse effect of bullying on educational achievement is larger at age 13 than at age 9. Hence, school violence seems to constitute a relevant factor in explaining student performance.
Keywords: educational production function; bullying; students achievement; propensity score matching; Italy; PIRLS; TIMSS.
JEL classifications: I21, I28, J13, J24.
1. Introduction
Over the past two decades, educators and policy makers have increasingly acknowledged that a safe school environment is an important aspect for promoting students’ academic performance. Despite the attention devoted by the economics of education to the determinants of student performance, little is known about the consequences of common forms of everyday violence at school – such as being excluded from social groups, being verbally and physically harassed, and being stolen from by classmates – for the achievement of students.
There has been an increase of bullying behaviors among peers in schools in recent years. Violence between peers in schools is a widespread phenomenon that worries
*
2
psychologists, teachers and families in many countries around the world.1 In Italy, for example, there have been a number of reports published recently suggesting that a high proportion of children experience bullying. The Third Italian Report on the Condition of
Childhood and Adolescence (2000) indicates that over 40% of all children and adolescents have threatened or hit a peer; over 30% say they have witnessed threats or acts of force at their school; 15.5% of the younger children and 10.8% of adolescents say there are continuing acts of physical violence; about 40% of elementary school students and 28% of middle school students say they have been the victims of bullying “sometimes or quite frequently”; 20% say that they have inflicted physical violence on their schoolmates sometimes or quite frequently.
In this scenario the Italian Ministry of Public Education has recently pointed out that it is necessary to face bullying with clear-cut punitive measures that express the refusal of such behavior, preventing and countering bullying are “systemic” actions to be carried out as part of the comprehensive program of interventions and general school activities.
In contrast to the lack of economic research on the effects of bullying at school, most studies on this topic are from the psychological literature and typically aim at evaluating the causes of violent behavior of peers and the consequences on psychological traits of victims rather than the degree to which the different forms of small-scale violence at school actually affects students’ performance. Most of these studies point out that students who are victimized by peers are likely to demonstrate low self-esteem, self-harm, suicidal intention, depression, loneliness and physical ill-health (Barker et al., 2008; Brown and Gutman, 2008; Fekkes et al., 2006; Gutman and Feinstein, 2008; Smith et. al., 2004). A notable exception is the study by Woods and Wolke (2004) who explore the relationship between bullying behavior at primary school and pupils performance in the UK. Surprisingly, the results suggest little evidence of a direct link between being a victim of school bullying and scholastic achievement.
The detrimental effects of bullying at school have been recently analyzed by educational economists which mainly focus their attention on the determinants of school
violence (Mühlenweg, 2010; Persson and Svensson, 2010; Vignoles and Meschi 2010) and on
1
3
the impact of school bullying on educational achievement and labor market earnings (Ammermüller, 2007; Brown and Taylor, 2005; Le et al., 2005; Waddell, 2006). 2
Persson and Svensson, (2010) investigate the effect of class‐size on physical and
verbal bullying in Swedish schools showing that there are no beneficial effects from reducing
class‐size on victimization. Mühlenweg (2010) examines the impact of age within grade on
victimization in elementary school in 17 countries, finding that children are harmed by being the youngest: the size of age effects on school victimization tends to be higher for boys than for girls as well as for children with an immigrant background compared to natives. Vignoles
and Meschi (2010) point out that pupils who experience bullying have lower levels of academic achievement and lower levels of enjoyment of school.
It has also been shown that school violence affects educational attainments and longer term outcomes as earnings. Brown and Taylor (2008) investigate the effect of bullying at school on educational attainment and wages in Britain. Using the British National Child Development Study data, they find that bullying in primary and secondary schools has a sizable and negative long lasting effect on human capital accumulation and on wages received during adulthood. A related study by Le et al. (2005) based on Australian twins born between 1961 and 1974 point out that childhood disorder such as bullying activity and the propensity for starting physical fights negatively affect higher educational attainment and labour market outcomes. In a similar vein, Ammermüller (2007), using data from the Trends in International Mathematics and Science Study (TIMSS) for eleven European countries and the British National Child Development Study (NCDS) assess the degree of school violence by investigating the determinants of being a victim and its effect on student performance. Findings show that being bullied as a child has a negative impact on the level of educational attainment and labour market earnings. Waddell (2006) points out that US youths having low self-esteem and poor attitude achieve low educational performance, are more likely to be unemployed and, if employed, receive lower wages.
In this paper, we add to the existing literature on school bullying by conducting an econometric analysis of the effects of bullying at school on students’ achievement in Italy
using both parametric (Ordinary Least Squares) and non-parametric estimators (Propensity Score Matching Approaches). Therefore, our estimation strategy proceeds in two steps. Firstly, to evaluate the effect of bullying on student achievement we apply the standard OLS
2
4
procedure controlling for a wide range of individual characteristics and school fixed effects. Secondly, we estimate average treatment effects applying several matching methods based on the propensity score estimator (PSM) which does not require an exclusion restriction, or a particular specification of the model for bullying at school. Moreover, this approach aim at
ensuring that for each treated unit, there are control units with the same observable characteristics. More precisely, to know the “true” effect of being bullied (“treatment”) on school performance of a particular student, we should compare the observed outcome of a bullied student with the outcome that would have resulted had that student not bullied at school (“counterfactual”), which cannot be observed. Matching estimators use the information on control individuals with the same observable characteristics of treated to derive the counterfactual outcomes of treated.
We focus on the impact that being a victim of school bullying has on the achievement of students who are actually treated - the average effect of treatment on the treated (ATT). Moreover, we are also interested in the effect of being a victim of school bullying on the performance of a random student - the average treatment effect (ATE).
We conduct our analyses using two datasets providing the achievement of students in different subjects and at different stages of their scholastic career. Firstly, we study pupils’ performance in Reading Literacy at the fourth grade using the 2006 PIRLS-Progress in International Reading Literacy Study. Secondly, we focus on Mathematics and Science knowledge for children at the fourth grade (approximately 9-year-olds) and eighth grade (13-year-olds) using the 2007 TIMSS-Trends in International Mathematics and Science Study. The use of these datasets allows us to verify if there is an effect of being a victim of school bullying on school performance for 9-year-old students and if the effect of bullying is different as students progress along their career until they are 13 years old.
We firstly show that children being victim of bullying obtain significantly lower
performance in reading comprehension, mathematics and science than non-bullied students at the fourth grade. Subsequently, we show that the negative effect of bullying on educational
attainment increases in magnitude as regards Math for students enrolled at the eighth grade, when they are 13 years old. The results of the OLS and the Propensity Matching Estimates point to similar effects. Hence, school violence seems to constitute a relevant factor in explaining student performance providing policymakers with useful information on anti-bullying programs.
5
emerges that students achievement is monotonically decreasing in the frequency at which children are exposed to bullying.
The paper is organized as follows. Section 2 presents the data and provides some descriptive statics. Section 3 reports and discusses results from OLS on the effect of bullying
at school for fourth and eighth graders and presents some robustness checks. Section 4 reports the empirical results obtained with matching estimators. Section 5 concludes.
2. Data and Descriptive Statistics
This section provides a brief description of the datasets we use in the analysis, giving some descriptive statistics.
For our empirical analyses we combine two different datasets: 2006-PIRLS and 2007-TIMSS, all of which include student test scores and information on students’, families’ and
schools’ characteristics.
The Progress in International Reading Literacy Study (PIRLS) is an international assessment of the reading comprehension of children in their fourth year of schooling, conducted by the International Association for the Evaluation of Educational Achievement (IEA). PIRLS consists of a main survey focusing on a reading comprehension test and a background questionnaire. The test is designed to address the process of comprehension and the purposes for reading (that is, reading for literary experience and reading to acquire and use information). For the purpose of our analysis we use the second cycle of the study conducted in 2006. The Italian sample includes 3,581 students at the fourth grade coming from 150 schools.
The PIRLS data base provides a set of variables indicating whether pupils suffer from school victimization. All these information are reported by the children in the student background questionnaire. Specifically, at each child was asked to indicate - through a binary response (yes or not) - whether within the last month any of these things happened at school: “something was stolen from me”, “I was harassed by another student”, or “I was injured by another student”. We construct our variable of interest by using a binary variable for school bullying (Bullied) indicating whether at least one of these three events occurred to the child.
eighth-6
graders. TIMSS also contains contextual information about teaching and learning collected from students, teachers, and heads of school questionnaires. We use the fourth wave of TIMSS which refers to data collected in 2007. The Italian sample includes 4,470 students in the fourth grade (approximately 9 years old) and 4,400 students in the eighth grade
(approximately 13 years old) coming from a total of 340 schools randomly selected and weighted to be representative of the nation.
The variables indicating whether pupils suffer from school bullying are built on the basis of the student background questionnaire. To define the degree of bullying at schools, we use the following question: “In school, did any of these things happen during the last month?”. For each of the possible five answers, students could respond by yes or no: “Something of mine was stolen”; “I was hit or hurt by other student (s) (for example, shoving, hitting, kicking)”; “I was made to do things I did not want to do by other students”; “I was made fun of or called names”; “I was left out of activities by other students”. We build our variable of interest “Bullied” as a binary variable taking the value of one if at least one of these five events happened to the child and zero otherwise.
7
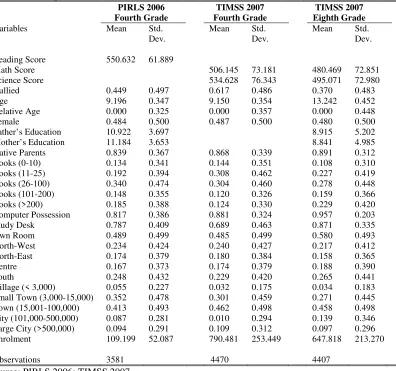
Table 1. Descriptive statistics for the main variables used
PIRLS 2006 Fourth Grade TIMSS 2007 Fourth Grade TIMSS 2007 Eighth Grade
Variables Mean Std.
Dev.
Mean Std. Dev.
Mean Std. Dev.
Reading Score 550.632 61.889
Math Score 506.145 73.181 480.469 72.851
Science Score 534.628 76.343 495.071 72.980
Bullied 0.449 0.497 0.617 0.486 0.370 0.483
Age 9.196 0.347 9.150 0.354 13.242 0.452
Relative Age 0.000 0.325 0.000 0.357 0.000 0.448
Female 0.484 0.500 0.487 0.500 0.480 0.500
Father’s Education 10.922 3.697 8.915 5.202
Mother’s Education 11.184 3.653 8.841 4.985
Native Parents 0.839 0.367 0.868 0.339 0.891 0.312
Books (0-10) 0.134 0.341 0.144 0.351 0.108 0.310
Books (11-25) 0.192 0.394 0.308 0.462 0.227 0.419
Books (26-100) 0.340 0.474 0.304 0.460 0.278 0.448
Books (101-200) 0.148 0.355 0.120 0.326 0.159 0.366
Books (>200) 0.185 0.388 0.124 0.330 0.229 0.420
Computer Possession 0.817 0.386 0.881 0.324 0.957 0.203
Study Desk 0.787 0.409 0.689 0.463 0.871 0.335
Own Room 0.489 0.499 0.485 0.499 0.580 0.493
North-West 0.234 0.424 0.240 0.427 0.217 0.412
North-East 0.174 0.379 0.180 0.384 0.158 0.365
Centre 0.167 0.373 0.174 0.379 0.188 0.390
South 0.248 0.432 0.229 0.420 0.265 0.441
Village (< 3,000) 0.055 0.227 0.032 0.175 0.034 0.183
Small Town (3,000-15,000) 0.352 0.478 0.301 0.459 0.271 0.445
Town (15,001-100,000) 0.413 0.493 0.462 0.498 0.458 0.498
City (101,000-500,000) 0.087 0.281 0.010 0.294 0.139 0.346
Large City (>500,000) 0.094 0.291 0.109 0.312 0.097 0.296
Enrolment 109.199 52.087 790.481 253.449 647.818 213.270
Observations 3581 4470 4407
Source: PIRLS 2006; TIMSS 2007.
Average PIRLS Reading score for fourth graders is 550, Math and Science scores are respectively 506 and 534 at the fourth grade, while are 480 and 495 at the eighth grade (TIMSS). The statistics show that whereas the performance of Italian students is well above the international average at the early grades, it becomes progressively worse in secondary schools.
A large share of students - between 45 and 62 percent (at grade four) and 37 percent at grade eight - has been victim of school bullying at least once in the last month. Overall, the
level of school bullying is lower at grade eight than at grade four, which is likely to depend on the different perception of students to be victimized at different age: younger children may
feel victims of bullying at school more frequently than older one.
8
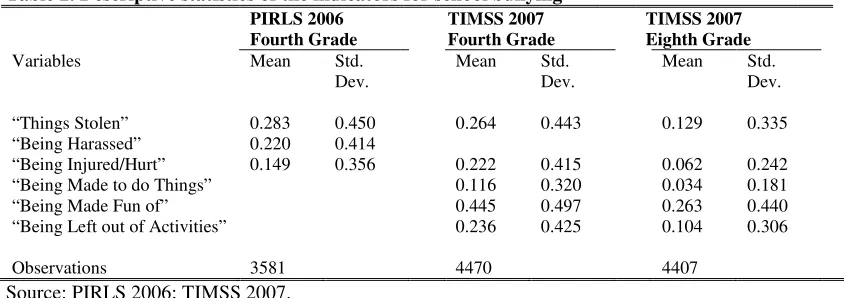
Table 2. Descriptive statistics of the indicators for school bullying
PIRLS 2006 Fourth Grade
TIMSS 2007 Fourth Grade
TIMSS 2007 Eighth Grade
Variables Mean Std.
Dev.
Mean Std. Dev.
Mean Std. Dev.
“Things Stolen” 0.283 0.450 0.264 0.443 0.129 0.335
“Being Harassed” 0.220 0.414
“Being Injured/Hurt” 0.149 0.356 0.222 0.415 0.062 0.242
“Being Made to do Things” 0.116 0.320 0.034 0.181
“Being Made Fun of” 0.445 0.497 0.263 0.440
“Being Left out of Activities” 0.236 0.425 0.104 0.306
Observations 3581 4470 4407
Source: PIRLS 2006; TIMSS 2007.
For grade four, between 15 and 22 percent of students have been injured/hurt by other students in the last month. Being a victim of theft is even higher ranging from 26 and 28 percent. At grade eight, although the percentage of being hurt or theft is lower (6 and 13 percent, respectively), it still involves a quite large share of students. The most prevalent activity of bullying is “being made fun of” (44% of fourth graders and 26% of eight graders).
3. The Effects of Bullying at School on Fourth and Eighth Grade
Students’ Performance: OLS Estimates
In this Section, to evaluate the effects of bullying at school we use PIRLS data on students’ reading literacy at the fourth grade and TIMSS data for performance in mathematics and science for pupils at the fourth and the eighth grade levels.
We estimate the following model for student achievement: [1] Yi =β0+β1Bulliedi+β2Xi+εi
where Yi denotes the test score of student i (respectively, in reading literacy, mathematics
and science), Bulliedi is a dummy variable indicating whether or not the i-th student has been
victim of school bullying within the prior month, Xi is a vector of student and school
characteristics (gender, language spoken at home, family socio-economic background,
geographical area, city size, enrolment, etc.), εi is an error term capturing idiosyncratic
shocks or unobserved student characteristics.
The assumption of this estimation approach is that, having controlled for Xi, the
treatment effect is independent of the process determining outcomes (in other words, the assumption is that Bulliedi and εi are uncorrelated). In the next section we complement our
9
basic assumption is selection on observables (unconfoundedness), consisting of matching treatment with comparison units (pupils being victims of school bullying versus non victims) that are similar in terms of their observable characteristics. In comparison with OLS, the Propensity Score Matching affords better scope in both dealing with common support issues
and using a non-parametric specification in the outcome equation.
3.1. Bullying and Reading Comprehension at the Fourth Grade (PIRLS)
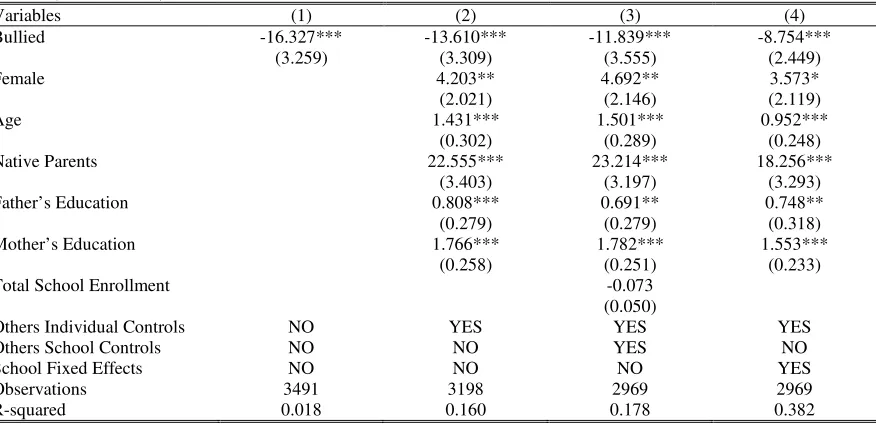
Firstly, we analyze the impact of pupil’s bullying on the achievement in reading comprehension at the fourth grade, measured using PIRLS data. Results from OLS estimations are shown in Table 3. In all the specifications, standard errors are robust to heteroskedasticity and adjusted for potential clustering at the school level.
In column (1) we report the results from a model in which we do not include any control. Being a victim of bullying at school exerts a statistically significant negative impact on student achievement: pupils experiencing bullying achieve a much lower performance in
Reading Comprehension (-16.33 points), significantly different from zero at the 1 percent level (t-stat: -5.01).
In column (2) we include a set of variables to control for individual characteristics and family background: gender, age, number of books at home (5 categories), computer possession, study desk, own room, father’s and mother’s years of education, an indicator for parents born in Italy, a variable measuring the economic situation of the family, 5 dummies for geographical residence. The effect of being a victim of school bullying on pupils’ performance is negative (-13.61) and similar to column (1).
In column (3) we control for some school characteristics: 5 dummies for city size, 4 indicators for the percentage of students coming from disadvantaged families and 4 for the percentage coming from affluent families. In column (4) we control for school fixed effects instead of school characteristics.
10
correlated to the determinants of school bullying. In sum, children experiencing bullying at school achieve a lower performance of about 9 points than those who have never been bullied. As a comparison, one should consider that being victim of bullying produces a negative effect on student’s performance corresponding to a reduction of mother’s years of education
of about 5.6 (or 11 years of father’s education).
The effects of controls variable can be summarized as follows: females perform better than males (as regards Reading Literacy); family background such as parents’ education and home possessions related to both family wealth and book possession are positively correlated with pupils performance. Children living in cities and metropolitan areas achieve higher test scores than those attending schools located in small towns. In accordance with the existing literature, we find that younger children score substantially lower than older peers (Bedard and Dhuey, 2006; Ponzo and Scoppa, 2011; Puhani and Weber, 2007). Results also show a strong negative effect of the relative age (in months) of a child with respect to the classmates’ age on Reading Comprehension. Native pupils perform much better than immigrant ones.
Table 3. OLS Estimates. The Impact of Being Bullied at School on Reading Literacy at the Fourth Grade (PIRLS data)
Variables (1) (2) (3) (4)
Bullied -16.327*** -13.610*** -11.839*** -8.754***
(3.259) (3.309) (3.555) (2.449)
Female 4.203** 4.692** 3.573*
(2.021) (2.146) (2.119)
Age 1.431*** 1.501*** 0.952***
(0.302) (0.289) (0.248)
Native Parents 22.555*** 23.214*** 18.256***
(3.403) (3.197) (3.293)
Father’s Education 0.808*** 0.691** 0.748**
(0.279) (0.279) (0.318)
Mother’s Education 1.766*** 1.782*** 1.553***
(0.258) (0.251) (0.233)
Total School Enrollment -0.073
(0.050)
Others Individual Controls NO YES YES YES
Others School Controls NO NO YES NO
School Fixed Effects NO NO NO YES
Observations 3491 3198 2969 2969
R-squared 0.018 0.160 0.178 0.382
[image:11.595.75.513.415.627.2]11
3.2. Bullying and Test Scores in Math and Science (TIMSS)
We now perform the same analysis using TIMSS dataset for the fourth and the eighth grades. The use of TIMSS data allow us to analyze the impact of bullying on the achievement in two different subjects (Math and Science). More importantly, the use of the data at the eighth grade allow us to evaluate if bulling has a negative effect also when children grow older (until they are 13/14 years old).
We consider as dependent variables, respectively, Mathematics and Science test
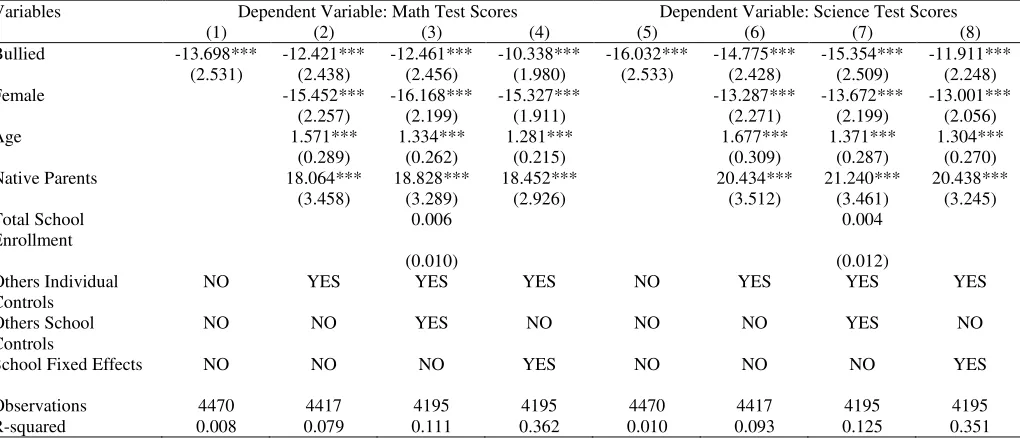
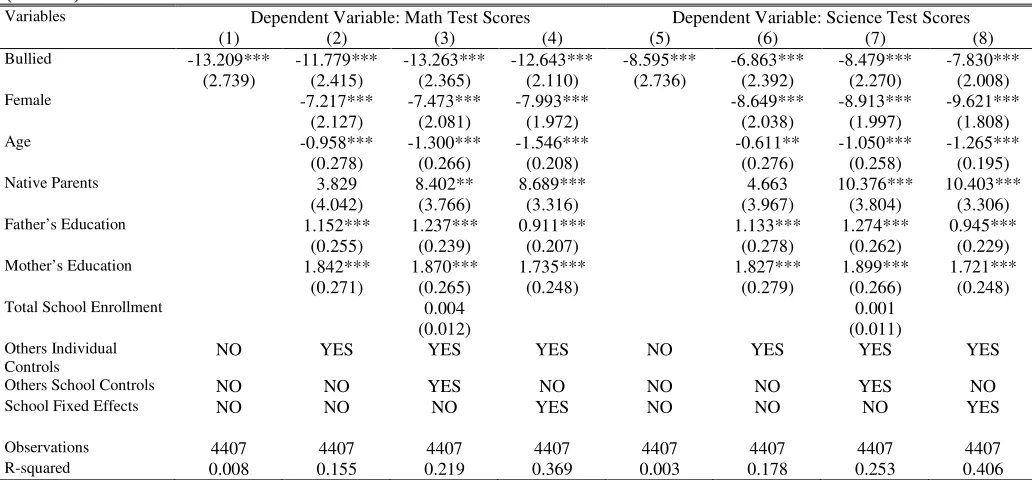
scores. The results obtained using OLS estimator are shown in Tables 4 (fourth grade) and Table 5 (eighth grade). The first four columns show the impact on Math Test Scores while columns (5-8) analyze the effect on Science Test Scores.
The specifications estimated are analogous to Table 3. However, in some cases, control variables are slightly different: we do not have available a single measure of income in TIMSS and we control for the following variables to take into account family income: “child has a computer”, “child has a own study desk”, “child has a own room”. Moreover, we have information on parents’ education only for the eighth grade and not for the fourth grade.
The effects of being a victim of bullying using TIMSS data exhibits a pattern similar to the findings obtained with PIRLS data. Being a victim of school bullying has a negative and highly statistically significant effect (t-stat around -5) on the achievement in mathematics (columns 1-4) and science (columns 5-8) for children at both the fourth and the eighth grade levels.
The results based on the most complete specifications (columns 4 and 8 of Tables 4 and 5) - in which we control for a wide range of individual characteristics, family background and school-fixed effects - show the adverse effects of being bullied on educational achievement amongst pupils. Comparing the estimated effect of bullying for 4th graders students with the effect for 8th graders, it seems that the magnitude of the effect does not change as students grow older.
For the fourth grade, victims of school bullying achieve lower test scores both in Mathematics and in Science (10.3 and 11.9 respectively), meaning that being Bullied leads to
a decrease of 0.14-0.16 standard deviations (according to specifications) in Math and Science test scores. In the eighth grade, a child experiencing bullying at school obtain about 12.6
12
[image:13.595.75.585.187.406.2]The decrease in performance caused by being a victim of school bullying at the grade eighth corresponds in magnitude to the advantage enjoyed by Italian native students with respect to immigrants (82%) or to the effect determined by about 5 additional years of education of parents.
Table 4. OLS Estimates. The Impact of Being Bullied at School on Student Performance at the Fourth Grade (TIMSS)
Variables Dependent Variable: Math Test Scores Dependent Variable: Science Test Scores
(1) (2) (3) (4) (5) (6) (7) (8)
Bullied -13.698*** -12.421*** -12.461*** -10.338*** -16.032*** -14.775*** -15.354*** -11.911***
(2.531) (2.438) (2.456) (1.980) (2.533) (2.428) (2.509) (2.248)
Female -15.452*** -16.168*** -15.327*** -13.287*** -13.672*** -13.001***
(2.257) (2.199) (1.911) (2.271) (2.199) (2.056)
Age 1.571*** 1.334*** 1.281*** 1.677*** 1.371*** 1.304***
(0.289) (0.262) (0.215) (0.309) (0.287) (0.270)
Native Parents 18.064*** 18.828*** 18.452*** 20.434*** 21.240*** 20.438***
(3.458) (3.289) (2.926) (3.512) (3.461) (3.245)
Total School Enrollment
0.006 0.004
(0.010) (0.012)
Others Individual Controls
NO YES YES YES NO YES YES YES
Others School Controls
NO NO YES NO NO NO YES NO
School Fixed Effects NO NO NO YES NO NO NO YES
Observations 4470 4417 4195 4195 4470 4417 4195 4195
R-squared 0.008 0.079 0.111 0.362 0.010 0.093 0.125 0.351
13
Table 5. OLS Estimates. The Impact of Being Bullied at School on Student Performance at the Eighth Grade Levels (TIMSS)
Variables Dependent Variable: Math Test Scores Dependent Variable: Science Test Scores
(1) (2) (3) (4) (5) (6) (7) (8)
Bullied -13.209*** -11.779*** -13.263*** -12.643*** -8.595*** -6.863*** -8.479*** -7.830***
(2.739) (2.415) (2.365) (2.110) (2.736) (2.392) (2.270) (2.008)
Female -7.217*** -7.473*** -7.993*** -8.649*** -8.913*** -9.621***
(2.127) (2.081) (1.972) (2.038) (1.997) (1.808)
Age -0.958*** -1.300*** -1.546*** -0.611** -1.050*** -1.265***
(0.278) (0.266) (0.208) (0.276) (0.258) (0.195)
Native Parents 3.829 8.402** 8.689*** 4.663 10.376*** 10.403***
(4.042) (3.766) (3.316) (3.967) (3.804) (3.306)
Father’s Education 1.152*** 1.237*** 0.911*** 1.133*** 1.274*** 0.945***
(0.255) (0.239) (0.207) (0.278) (0.262) (0.229)
Mother’s Education 1.842*** 1.870*** 1.735*** 1.827*** 1.899*** 1.721***
(0.271) (0.265) (0.248) (0.279) (0.266) (0.248)
Total School Enrollment 0.004 0.001
(0.012) (0.011)
Others Individual Controls
NO YES YES YES NO YES YES YES
Others School Controls NO NO YES NO NO NO YES NO
School Fixed Effects NO NO NO YES NO NO NO YES
Observations 4407 4407 4407 4407 4407 4407 4407 4407
R-squared 0.008 0.155 0.219 0.369 0.003 0.178 0.253 0.406 Notes: “Others Individual Controls” include: computer possession, study desk, own room, 5 dummies for books at home, 5 dummies for geographical residence. “Others School Controls” include 5 dummies for city size, indicators for the percentage of students coming from disadvantaged families and from affluent families. Standard errors, corrected for heteroskedasticity and adjusted for potential clustering at school level, are reported in parentheses. The symbols *** and ** indicate that coefficients are statistically significant, respectively, at the 1 and 5 percent level. Data source: TIMSS 2007.
Results using TIMSS data are similar to the findings obtained with PIRLS data with the exception of the coefficients on Age. For the fourth grade (Tables 3 and 4), the coefficients on Age are positive while at the eighth grade (Table 5), estimates are generally negative. This result probably shows that the decisions of grade retention of teachers (which are rare in early primary grades and more frequent in the secondary school) play a relevant role in creating a correlation between age and the error term of equation [1]. Therefore, retained children (with lower ability) - that are the oldest in the class - obtain significantly lower performance than their peers at the eighth grade.
3.3. Robustness checks
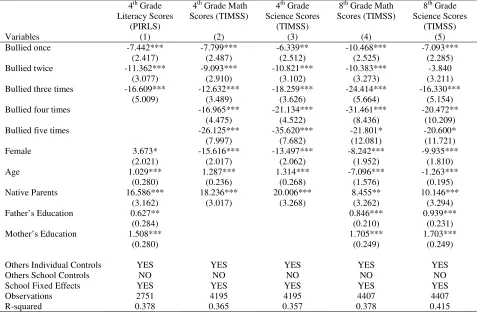
To check the robustness of our findings, in this section we use as an alternative measure of bullying the frequency at which children are exposed to repeated negative actions over time on the part of their peers.
In order to analyze whether repeated bullying actions may be costly in terms of pupil’s
[image:14.595.40.556.92.332.2]14
bullying range from one to three when we use PIRLS data (“Things Stolen”; “Being Harassed”; “Being Injured/Hurt”) and from one to five using TIMSS data (“Things Stolen”; “Being Injured/Hurt”; “Being Made to do Things”; “Being Made Fun of”; “Being Left out of Activities”).
[image:15.595.66.545.302.614.2]We consider as dependent variables, respectively, Reading Comprehension achievement at the fourth grade with PIRLS data, Mathematics and Science test scores at the fourth and eighth grade levels with TIMSS data, controlling for a full set of individual characteristics, family background and school-fixed effects. Results from OLS estimations are shown in Table 6.
Table 6. OLS Estimates. Robustness check for the effect of repeated negative actions on Student Performance at the Fourth and Eighth Grade Levels.
4th Grade Literacy Scores
(PIRLS)
4th Grade Math Scores (TIMSS)
4th Grade Science Scores
(TIMSS)
8th Grade Math Scores (TIMSS)
8th Grade Science Scores
(TIMSS)
Variables (1) (2) (3) (4) (5)
Bullied once -7.442*** -7.799*** -6.339** -10.468*** -7.093***
(2.417) (2.487) (2.512) (2.525) (2.285)
Bullied twice -11.362*** -9.093*** -10.821*** -10.383*** -3.840
(3.077) (2.910) (3.102) (3.273) (3.211)
Bullied three times -16.609*** -12.632*** -18.259*** -24.414*** -16.330***
(5.009) (3.489) (3.626) (5.664) (5.154)
Bullied four times -16.965*** -21.134*** -31.461*** -20.472**
(4.475) (4.522) (8.436) (10.209)
Bullied five times -26.125*** -35.620*** -21.801* -20.600*
(7.997) (7.682) (12.081) (11.721)
Female 3.673* -15.616*** -13.497*** -8.242*** -9.935***
(2.021) (2.017) (2.062) (1.952) (1.810)
Age 1.029*** 1.287*** 1.314*** -7.096*** -1.263***
(0.280) (0.236) (0.268) (1.576) (0.195)
Native Parents 16.586*** 18.236*** 20.006*** 8.455** 10.146***
(3.162) (3.017) (3.268) (3.262) (3.294)
Father’s Education 0.627** 0.846*** 0.939***
(0.284) (0.210) (0.231)
Mother’s Education 1.508*** 1.705*** 1.703***
(0.280) (0.249) (0.249)
Others Individual Controls YES YES YES YES YES
Others School Controls NO NO NO NO NO
School Fixed Effects YES YES YES YES YES
Observations 2751 4195 4195 4407 4407
R-squared 0.378 0.365 0.357 0.378 0.415
Notes: “Others Individual Controls” include: computer possession, study desk, own room, 5 dummies for books at home, a variable measuring the economic situation of the family (only in column (1)), 5 dummies for geographical residence. Standard errors, corrected for heteroskedasticity and adjusted for potential clustering at school level, are reported in parentheses. The symbols *** and ** indicate that coefficients are statistically significant, respectively, at the 1 and 5 percent level. Data source: TIMSS 2007. Data source: PIRLS 2006 in column 1, TIMSS 2007 in columns 2-5.
Our variables of interest in Table (6) are the dummies for the repeated negative events that have occurred to pupils at school in the last month. The reference category is composed
15
indicating children who have been bullied are negative and highly significant (at the 1% level) and they reflect lower educational performance associated with higher number of negative actions. In all the specifications we find that pupil’s performance is monotonically decreasing with the frequency at which children are exposed to bullying. For example, in column (1)
having suffered from one form of bullying reduces pupils’ performance of about 7.5 points, having experienced two negative actions reduce the achievement of 11 points and of 16.6 points if a child has been bullied three times.
16
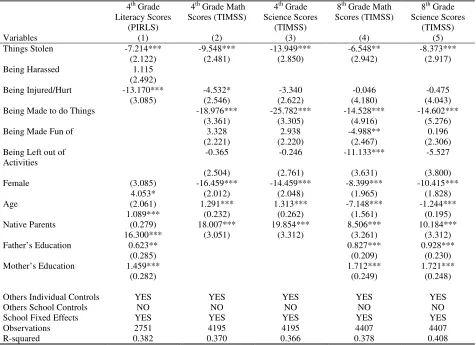
Table 7. OLS Estimates. Robustness check for the effect of different forms of violence at school on Student Performance at the Fourth and Eighth Grade Levels.
4th Grade Literacy Scores
(PIRLS)
4th Grade Math Scores (TIMSS)
4th Grade Science Scores
(TIMSS)
8th Grade Math Scores (TIMSS)
8th Grade Science Scores
(TIMSS)
Variables (1) (2) (3) (4) (5)
Things Stolen -7.214*** -9.548*** -13.949*** -6.548** -8.373***
(2.122) (2.481) (2.850) (2.942) (2.917)
Being Harassed 1.115
(2.492)
Being Injured/Hurt -13.170*** -4.532* -3.340 -0.046 -0.475
(3.085) (2.546) (2.622) (4.180) (4.043)
Being Made to do Things -18.976*** -25.782*** -14.528*** -14.602***
(3.361) (3.305) (4.916) (5.276)
Being Made Fun of 3.328 2.938 -4.988** 0.196
(2.221) (2.220) (2.467) (2.306)
Being Left out of Activities
-0.365 -0.246 -11.133*** -5.527
(2.504) (2.761) (3.631) (3.800)
Female (3.085) -16.459*** -14.459*** -8.399*** -10.415***
4.053* (2.012) (2.048) (1.965) (1.828)
Age (2.061) 1.291*** 1.313*** -7.148*** -1.244***
1.089*** (0.232) (0.262) (1.561) (0.195)
Native Parents (0.279) 18.007*** 19.854*** 8.506*** 10.184***
16.300*** (3.051) (3.312) (3.261) (3.312)
Father’s Education 0.623** 0.827*** 0.928***
(0.285) (0.209) (0.230)
Mother’s Education 1.459*** 1.712*** 1.721***
(0.282) (0.249) (0.248)
Others Individual Controls YES YES YES YES YES
Others School Controls NO NO NO NO NO
School Fixed Effects YES YES YES YES YES
Observations 2751 4195 4195 4407 4407
R-squared 0.382 0.370 0.366 0.378 0.408
Notes: “Others Individual Controls” include: computer possession, study desk, own room, 5 dummies for books at home, a variable measuring the economic situation of the family (only in column (1)), 5 dummies for geographical residence. Standard errors, corrected for heteroskedasticity and adjusted for potential clustering at school level, are reported in parentheses. The symbols *** and ** indicate that coefficients are statistically significant, respectively, at the 1 and 5 percent level. Data source: TIMSS 2007. Data source: PIRLS 2006 in column 1, TIMSS 2007 in columns 2-5.
From our estimates, it emerges that differences in educational performance are most pronounced between students that have been stolen from and among those being made to do things they did not want to do by other students.
[image:17.595.68.544.94.439.2]17
4. The Effects of School Bullying on Students’ Achievement Using
Propensity Score Matching
In this section, in order to attenuate the selection bias generated by confounding factors and identify an appropriate counterfactual for the treated group of students, we adopt the non-parametric propensity score matching which has become popular in the context of program evaluation (Rosenbaum and Rubin, 1983; Dehejia and Wahba, 1999; Becker and Ichino, 2002, among others).
In our context, the main purpose of matching is to find a group of non-treated students who are similar to the treated subjects in all relevant pre-treatment characteristics, Xi: the
only remaining difference being that the latter experienced bullying at school while the former did not. Therefore, any existing difference in performance can be attributed to the “treatment” (being exposed to bullying).
This approach allows to take into account two kinds of problems related to the choice of control group (how pupils would have performed had they were not victims of school bullying) and the potential bias arising from a correlation between the treatment group and observed covariates. The underlying principle of the matching approach consists of comparing treatment with control units (victims and non-victims of bullying at school) that are similar in terms of their observable characteristics. The estimated Average Treatment Effect (ATE) is obtained as the mean difference in outcomes between treated and control students, weighted by the propensity score distribution of treated units across specific intervals.
A key assumption in the matching method is the Conditional Independence Assumption (CIA), which implies that selection into treatment is solely based on observable characteristics. Under the CIA, estimators relying on matching techniques can yield unbiased
estimates of the ATE. Under this assumption, the counterfactual outcome for the treatment group can be inferred and therefore any difference between the treated and non-treated to be
attributed to the treatment (Blundell and Costa Dias 2002; Caliendo and Kopeinig 2008). A fundamental characteristic of the matching technique is the common support or overlap condition, which ensures that for each treated unit there are control units with the same observables:3 Pr
(
Bulliedi =1|Xi)
<1. This condition ensures that any combination ofcharacteristics observed in the treatment group can also be observed among the control group
3
18
(students with the same Xi values have a positive probability of being bullied at school),
therefore no match can be found for non-treatment units outside common support.
Finally, the propensity score technique checks the balancing property because it reduces the influence of confounding variables: students with the same propensity score must have the same distribution of observed covariates. In other words, the function used to compute the propensity score should be such that students with a similar propensity to being
victims of school bullying display, on average, similar values of Xi.
The first step of this approach is to compute the propensity score, i.e. the probability of participating in treatment conditional to pre-treatment control variables. Then, by comparing treated and untreated with the same propensity score in the common support region, it is possible to estimate the ATT.
Compared to the OLS estimators, the non-parametric matching approach has the additional advantage of not requiring a particular specification for the relationship between student performance and being a victim of bullying at school.
The propensity score is defined by Rosenbaum and Rubin (1983) as the conditional
probability of receiving a treatment given pretreatment characteristics: Pr
(
Bulliedi=1|Xi)
.However, the probability of observing two students with exactly the same value of
(
Bulliedi=1|Xi)
Pr is in principle zero, since the score is a continuous variable. Given that, it
is often unfeasible to have individuals with exactly the same propensity score, various methods have been proposed to overcome this problem, three of which will be implemented in this paper (Nearest Neighbour Matching, Radius or Caliper Methods and Kernel Matching).4
The first one is the Nearest Neighbour Matching: it consists of an algorithm that matches each treated student (being victim of bullying at school) with the non-treated peer displaying the closest propensity score. In our analysis the method is applied with replacement, in the sense that a control unit can be a best match for more than one treated unit. A limitation of the Nearest Neighbour Matching is that fewer observations are used to construct the counterfactual for each treated pupil. Therefore, as robustness checks we also use the Radius Matching and Kernel Matching Methods. With Radius Matching, each treated
4
19
unit is matched only with the control units whose propensity score falls into a predefined neighborhood of the propensity score of the treated unit. With Kernel Matching, every treated student is matched with a weighted average of all controls students with weights that are inversely proportional to the distance between the propensity scores of treated and controls.
Kernel matching requires choosing the Kernel function and the bandwidth parameter. While the choice of the Kernel function is not of major importance in practice (DiNardo and Tobias, 2001), the choice of the bandwidth parameter involves a trade-off between a small variance and an unbiased estimate of the true density function. Large bandwidth values tend to decrease the variance between the estimated and the true density function but lead to a biased estimate (Caliendo and Kopeinig, 2008). We use the Epanechnikov Kernel function where the bandwidth parameter is 0.06.
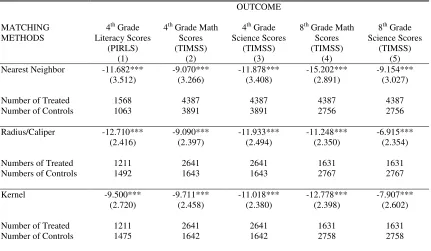
Table 8 contains the results from the propensity score analysis based on the three approaches described above in order to test the robustness of our findings. We estimate the average effect of treatment on the treated (ATT) using the procedure implemented by Becker and Ichino (2002) which is based on the predicted values obtained by estimating a logit model (results not reported for reasons of brevity). Controlling for a full set of individual characteristics, family background and school fixed effects, it emerges that female, native students as well as students coming from affluent families are less likely to experience bullying at school at the fourth grade. For grade eighth, the probability of being bullied at school is negatively related to the age of students, the years of parents’ education, the economic situation of the family and the geographical area of residence (students living in the South are less likely to be bullied at school). We include in our model only the units that satisfy both the common support condition and the balancing property. The basic criterion of this approach is to delete all observations whose propensity score is smaller than the minimum score of treatment group and larger than the maximum score in the control group.
Using PIRLS data, the region of common support is [0.048, 0.927], observations which lie outside this region are discarded from analysis, and the final number of blocks - ensuring that
the mean propensity score is not different for treated and controls in each block - is 8. Using TIMSS data, the region of common support is [0.044, 0.804] with a final number of blocks of 10.
20
(2)
∑
(
)
= − = T T n i C i T i Y Y n 1 1 τ
where T i
Y describes the outcome of the i-th treated student; nT represents the number of
students in the treatment group; C i
Y describes the average outcome for the group of control
students matched according to the different procedures, to the i-th student.
Specifically, in Table 8 we report propensity score estimates of ATT for performance in Reading Literacy (PIRLS) (column 1), Mathematics and Science in the fourth grade (TIMSS) (columns 2-3) and in the eighth grade (TIMSS) (columns 4-5), controlling for a full set of individual characteristics, family background and school-fixed effects.
Table 8. Propensity Score Estimates of the Effects of School Bullying on Fourth and Eighth Grade Test Scores.
OUTCOME
MATCHING METHODS
4th Grade Literacy Scores
(PIRLS) (1)
4th Grade Math Scores (TIMSS)
(2)
4th Grade Science Scores
(TIMSS) (3)
8th Grade Math Scores (TIMSS)
(4)
8th Grade Science Scores
(TIMSS) (5)
Nearest Neighbor -11.682*** -9.070*** -11.878*** -15.202*** -9.154***
(3.512) (3.266) (3.408) (2.891) (3.027)
Number of Treated 1568 4387 4387 4387 4387
Number of Controls 1063 3891 3891 2756 2756
Radius/Caliper -12.710*** -9.090*** -11.933*** -11.248*** -6.915***
(2.416) (2.397) (2.494) (2.350) (2.354)
Numbers of Treated 1211 2641 2641 1631 1631
Numbers of Controls 1492 1643 1643 2767 2767
Kernel -9.500*** -9.711*** -11.018*** -12.778*** -7.907***
(2.720) (2.458) (2.380) (2.398) (2.602)
Number of Treated 1211 2641 2641 1631 1631
Number of Controls 1475 1642 1642 2758 2758
Note: Balancing Property and Common Support satisfied. Nearest Neighbor is applied with replacement. The numbers of treated and controls refer to actual matches within radius. Bootstrap (100) for Kernel. See Table 2 for the list of individual and school controls in column (1). See Tables 3-4 for the list of individual and school controls in columns (2)-(5). Standard errors, corrected for heteroskedasticity, are reported in parentheses. The symbols ***, **, * indicate that coefficients are statistically significant, respectively, at the 1, 5, and 10 percent level. Data source: PIRLS 2006 in column 1, TIMSS 2007 in columns 2-5.
[image:21.595.70.501.325.576.2]21
effect of bullying persists as pupils grow older. It is worth nothing that all three matching methods lead to estimates of ATT that are very similar to the OLS results.
It is worthwhile to emphasize the similarity of ATT estimates obtained with Caliper and Kernel matching methods, especially in terms of standard errors. From our estimates, it
emerges that Caliper matching improves standard errors relative to both Nearest Neighbor and Kernel matching methods, although the cost could be a greater bias. The ATT estimates from the three alternative algorithms show that many comparison units overlap with the treatment group: therefore, it seems that propensity score-matching methods are able to yield reasonably accurate estimates of the impact of being victim of school bullying on student performance.
5. Concluding Remarks
We have investigated whether being a victim of bullying at school affects educational achievement of Italian students enrolled at the fourth and eighth grade levels. Using two different datasets to evaluate students’ performance in diverse subjects and at different age (2006-PIRLS and 2007-TIMSS), we have used both parametric (OLS) and non-parametric matching estimators.
In order to reduce the potential selection bias, we have controlled for a wide number of individual characteristics and school fixed effects in OLS estimates and we have applied propensity score matching (with three alternative matching algorithms).
To our knowledge, there has been no previous attempt to use matching estimators in evaluating the impact of bullying at school on student achievement. By applying this
non-parametric approach, we are able to take into account the twins problems of the choice of a suitable control group and the potential bias arising from a correlation between the treatment group and observable covariates. All three matching algorithms used in the analysis lead to estimates of ATT that are very similar to the OLS results.
Our findings show that children experiencing bullying at school score substantially lower than their non-victim peers at both the fourth and eighth grade levels. At grade four, results from ATT suggest that children being bullied achieve between 9.5 and 12.7 points less in reading comprehension, about 9 points less in Mathematics score and even 11 points less in Science score (with respect to students that do not experience any event of bullying). The adverse effect of bullying on educational performance persists as pupils grow older.
22
datasets, such as the PIRLS and TIMSS, with many matching variables, does not guarantee that all the heterogeneity between victims of school bullying and non-victims can be captured sufficiently.
To check the robustness of our empirical findings, we have evaluated whether
repeated bullying actions may be costly in terms of pupil’s educational attainment. From our results it emerges that students achievement is monotonically decreasing in the frequency at which children are exposed to bullying: having suffered from one form of bullying reduces pupils’ performance of about 7.5 points, having experienced two negative actions reduce the achievement of 11 points and of 16.6 points if a child has been bullied three times. As a further robustness check, we have evaluated the effect of each form of victimization (“Things Stolen”; “Being Harassed”; “Being Injured/Hurt”; Being Made to do Things; “Being Made Fun of”; “Being Left out of Activities”) on students’ performance. From our estimates, it emerges that differences in educational performance are most pronounced between students that have been stolen from and among those being made to do things they did not want to do by other students.
23
References
Ammermüller, A. (2007). Violence in European Schools: Victimization and Consequences. ZWE Discussion Paper No. 07‐004: ZEW ‐ Zentrum für Europäische Wirtschaftsforschung / Center for European Economic Research.
Barker ED, Boivin M, Brendgren M, Fontaine N, Arseneault L, Vitaro F, Bissonnette C, Trembley RE (2008). Predictive Validity and Early Predictors of Peer-Victimization Trajectories in Preschool. Archieves of General Psychiatry;65; 1185-1192.
Becker S., Ichino A. (2002), «Estimation of Average Treatment Effects Based on Propensity Scores», The Stata Journal, 2, 4, pp. 358-377.
Bedard, K. and Dhuey, E. (2006) The Persistence of Early Childhood Maturity: International Evidence of Long-Run Age Effects. Quarterly Journal of Economics 121(4), 1437-1472.
Blundell, R., Costa Dias, M. (2002): Alternative approaches to evaluation in empirical microeconomics.
Portuguese Economic Journal 1, 91-115.
Blundell, R., Dearden, L. and Sianesi, B. (2005) Evaluating the impact of education on earnings in the UK: models, methods and results from the NCDS. Journal of the RoyalStatistical Society, Series A 168(3): 473–512.
Brown, J. and Gutman, L. (2008): “The importance of social worlds: an investigation of peer relationships”, Centre for Research on the Wider Benefits of Learning (WBL) Research Report, No. 29.
Brown, S., & Taylor, K. (2008). Bullying, education and earnings: Evidence from the National Child Development Study. Economics of Education Review, 27, 387‐401.
Caliendo, M. and Hujer, R. (2006) The microeconometric estimation of treatment effects-an overview.
Allgemeines Statistisches Archiv 90(1): 197–212.
Caliendo, M., Kopeinig, S. (2008): Some practical guidance for the implementation of propensity score matching. Journal of Economic Surveys, 22(1), 31-72.
Cameron, A.C., Trivedi, P.K. (2005): Microeconometrics: methods and applications. Cambridge et al.: Cambridge University Press.
Dehejia, R. H. and S. Wahba. 1999. Causal effects in nonexperimental studies: Reevaluation of the evaluation of training programs. Journal of the American Statistical Association 94: 1043–1062.
DiNardo, J. and Tobias, J. (2001) Nonparametric density and regression estimation. Journal of Economic Perspectives 15(4): 11–28.
Fekkes M, Pijpers FIM, Fredriks AM, Vogels T, Verloove-Vanhorick SP (2006). Bullied Children Get Ill, or Do Ill Children Get Bullied? A Prospective Cohort Study on the Relationship Between Bullying and Health-Related Symptoms. Pediatrics;117; 1568-1574.
Gutman, L. and Feinstein, L. (2008): “Children’s Well-Being in Primary School: Pupil and School Effects”, Centre for Research on the Wider Benefits of Learning (WBL) Research Report, No. 25.
Le, A., Miller, P., Heath, A., & Martin, N. (2005). Early childhood behaviours, schooling and labour market outcomes: Estimates from a sample of twins. Economics of Education Review, 24, 1–17.
Mühlenweg, A. (2010). Young and innocent: International evidence on age effects within grades on victimization in elementary school, Economics Letters, 109(3), 157-160.
24
Olweus, D. (1997). Bully/victim problems in school: facts and interventions. European Journal of Psychology of Education 12, 495-510.
Persson, M. and Svensson, M. (2010). Willingness to Pay to Reduce School Bullying, Working Paper, 16. Ponzo, M. and Scoppa, V. (2011). The Long-Lasting Effects Of School Entry Age: Evidence From Italian
Students, Working paper, 1, Department of Economics and Statistics, University of Calabria.
Ponzo, M. (2011), “On-the-job search in Italian labour markets: an empirical analysis”, International Journal of the Economics of Business, forthcoming.
Puhani, P. and Weber, A. (2007) Does the Early Bird Catch the Worm? Instrumental Variable Estimates of Educational Effects of Age of School Entry in Germany, Empirical Economics, 32(2-3), 359-386. Rigby, K. (1996) Bullying in schools: and what to do about it, Melbourne: Acer.
Rosenbaum P.R., Rubin D.B. (1983), «The Central Role of the Propensity Score in Observational Studies for Causal Effects», Biometrika, 70, pp. 41-45.
Smith, P. and Sharp, S. (1994) School bullying: insights and perspectives. London: Routledge.
Smith, P., Talameli, L., Cowie, H., Naylor, P., & Chauhan, P. (2004). Profiles of non-victims, escaped victims and new victims of school bullying. British Journal of Psychological Society, 74, 565–581.
Vignoles, A. and Meschi, E. (2010).The Determinants of Non-Cognitive and Cognitive Schooling Outcomes, Report to the Department of Children, Schools and Families, Centre for the Economics of Education Special Report 004, London School of Economics.
Waddell, G. (2006). Labor-market consequences of poor attitude and low self-esteem in youth. Economic Inquiry, 44(1), 69–97.