Munich Personal RePEc Archive
Measuring dynamic market selection by
persistent scale inefficiencies - new
methodology applied to EU business
services
Kox, Henk L.M. and Leeuwen, George van
CPB Netherlands Bureau for Economic Policy Analysis
November 2011
Online at
https://mpra.ub.uni-muenchen.de/34986/
1
Measuring dynamic market selection by persistent scale
inefficiencies - new methodology applied to EU business
services
Henk Kox
#)and George van Leeuwen
&)November 2011
Abstract:
The paper proposes a new way of analysing the efficiency of dynamic market selection, based on the persistence of scale economies. The new methodology is used to investigate the causes of stagnating productivity growth in EU business services. An efficient market ensures that more productive firms grow faster than others. Conversely, firms with weaker performance would be outcompeted and shrink, and eventually go broke. This paper uses scale diseconomies and their persistence as indicator for the effectiveness of market selection.
We use a DEA method to construct the productivity frontier by sub-sector and size class, for business services in 13 EU countries. From this we derive scale economies and their development over time. Our results indicate malfunctioning competitive selection. Between 1999 and 2005 we observe a persistence of scale diseconomies, with scale efficiency falling rather than growing over time. In panel regressions we find the distance to the productivity frontier (within and between size classes) to be significantly explained by regulatory policies that hamper entry and exit dynamics and labour adjustment, and by a lack of import penetration and domestic start-ups.
The results suggest that policy reform and more market openness may have positive productivity effects. This holds for business services itself, but also wider, because of business services’ large role in intermediary production inputs.
Key words: market selection; scale economies; entry and exit costs; regulation; import competition; EU internal market; productivity frontier
JEL codes: L1, L5, D2, L8
Acknowledgements
We thank Isabel Grilo, Casper van Ewijk, Coen Teulings and Paul Veenendaal for useful comments on earlier versions of this paper. We have also benefited from comments by participants at seminars at the European Commission (DG/IM, Brussels), CEPS (Brussels) and CPB (The Hague). Remaining flaws are ours.
__________
#) CPB Netherlands Bureau for Economic Policy Analysis, P.O. Box 80510, 2508 GM The Hague, Netherlands, email:
[email protected] (corresponding author)
&
2
1. Introduction
This paper explores a new methodology for comparing markets based on the effectiveness of competitive selection. The persistence of scale-related efficiency disadvantages is used as a key indicator for the
effectiveness of competitive selection. We apply the method to European business services, an industry that by now has a record due to its virtual productivity stagnation for more than a decade. We find a strong
persistence of scale-related efficiency disadvantages and ineffective competitive selection in large parts of European business services. The paper also shows that this can be explained by a regulatory environment that protects incumbent firms and that hampers market dynamics, and by a lack of import penetration that
otherwise would have contributed to more contestability of markets.
An efficient market ensures that more productive and innovative firms grow faster than others.
Conversely, firms with weaker performance will be outcompeted and shrink or exit (e.g. Jovanovic 1982),
with an intensivation during the down-swing phase of the business cycle (Aghion et al., 1993; Ewijk, 1997; Caballero et al. 1994).1 If markets are contestable market by being open to potential hit-and-run
entry, the incumbents have to keep a sharp eye on actual and potential competition (Baumol et al. 1982; Schwartz, 1986).2 Entry by domestic start-ups and by foreign competitors with new and/or cheaper
products feeds the competitive interaction. It forces the incumbents to present similarly priced products and innovations. Hence, new start-ups and import penetration may both promote the selection process by the market, as is also implied in the recent literature on international trade with heterogeneous firms.
Dynamic market selection necessarily goes along with shrinking or even exit of the least efficient firms. If
regulatory policies create cost obstacles to employment adaptation and firm exit, this necessarily slows down the process of market selection.3
The efficient market selection principle as formulated above may sound easy, but it is far from
trivial to design an empirical indicator that measures the efficiency of market selection. It cannot be directly derived from productivity patterns of firms operating in the same market. The productivity pattern
in an industry is affected by many factors: within the firm, in the market structure, and in wider setting in which the market functions. Bartelsman et al. (2000) mention the role of scale efficiency, management
and ownership, the quality of the workforce and technology as possible explanations for productivity patterns in industries. We may add the regulatory environment to this list. Productivity may depend on
factors that are external to the firm but do not affect all competing firms in similar ways. The
1
Jovanovic (1982) developed a framework of 'noisy selection' in which firms have different initial efficiency endowments, and their survival depends on market conditions. Efficient firms grow and survive, while inefficient firms decline and fail.
2
Baumol et al. (1982: 5) define a perfectly contestable market as one that is accessible to potential entrants and has the following two properties. First, the potential entrants can, without restriction, serve the same market demands and use the same productive techniques as those available to the incumbent firms. Second, the potential entrants evaluate the profitability of entry at the incumbent firms‟ pre-entry prices.
3
3 causality means that we cannot take the productivity distribution itself as an indicator of market efficiency. In this paper we have looked for firm characteristics that can be „objectified‟ and still tell us something
about how the market functions. The incidence and persistence of scale-related efficiency gaps could serve as such an objectifiable characteristic. The advantage is that scale can be measured without knowing
anything about management performance of firms or about the firm‟s environment.
We apply our new methodology for evaluating the effectiveness of competitive selection to the European business services industry, a large industry that is responsible for 14-25% of total domestic
value added in most of the older EU member states.4 This industry has a productivity stagnation problem. Between 1980 and 2007, the business services industry booked a productivity growth that was in most
countries zero or even below zero.5 This industry had a zero or negative contribution to aggregate productivity growth in most of Europe.6 Business services is also the industry with the single largest
contribution to Europe‟s productivity gap with the USA.7 There may be further knock-on effects. Business
services typically provides 15-20 per cent of all intermediary inputs.8 The poor productivity performance of business services is therefore likely to contribute to future cost and competitiveness problems for its
client industries.
What is behind this productivity stagnation? The jury is still out, but some evidence is available.
Bartelsman et al. (2000) note that while entry and exit rates are fairly similar across industrial countries, post-entry performance differs noticeably between Europe and the United States. Post-entry growth in the
EU is on average much slower in the EU and regulatory differences might partly explain this difference. Klapper et al. (2006) show that European countries with more costly entry regulations experience a slower
growth of firms numbers in industries with high entry than the US. A number of studies argue that anti-competitive regulation can be the source of badly performing markets (Biatour et al. 2011; Bourlès et al.,
2010; Buti and Deroose, 2010; Grilo et al., 2009; Arnold et al. 2008 and 2011; Nicoletti et al., 2003; Paterson et al., 2003). Regulatory entry barriers, a lack of import penetration and imported product varieties according to Ilkovitz et al. (2008) have a negative impact on market functioning in European business
services. Especially knowledge-intensive business services are subject to several types of national regulatory measures. Regulatory burdens that do not discriminate between firm size often result in a disproportionately
large compliance costs impact for small and medium-sized firms, hindering their post-entry growth (Baker
et al. 2008). Costly regulations hamper the creation of new firms, create fixed costs and cause incumbent
4
Average for 2008 of all EU-15 countries except Greece and Portugal (OECD, 2011).
5
Rubalcaba et al. (2007) show that between 1979 and 2003 the average annual productivity growth in European business services amounted to ─0.3 per cent, which compared badly with the 1.6 per cent average productivity growth in the total European economy.
6
Antipa et al. (2010) calculated that between 1992 and 2007 the annual contribution of business services to aggregate productivity growth was -0.24 percentage point in Germany, −0.03 in France, 0.1 in the Netherlands, 0.4 in the USA and 0.6 in the UK.
7
Antipa et al. (2010); O‟Mahony et al. (2010); van Ark et al. (2008).
8
This refers to the share of domestically produced and imported business services in total use of intermediary inputs
4 firms in otherwise high-entry industries to grow more slowly. Not only product-market regulation, but also regulatory measures for employment with regard to labour turnover and employment may affect the
resource allocation and productivity performance of firms. Gust et al. (2002) evaluate the effect of more
stringent labour market regulations on a firm‟s decision to adopt new technologies. They analyse that a tax
on firing workers delays the adoption of information technology (IT) when technological change is skill-biased and when firms can only upgrade the quality of their workforce through labour turnover. If IT technology adoption is delayed, this lowers productivity. There is also evidence on the productivity
stagnation in business services from another perspective. Growth-accounting studies found for business services a negative growth contribution of total factor productivityor TFP (O‟Mahony et al., 2009;
Jorgenson et al., 2005; Triplett et al., 2006). TFP is a residual factor that is, inter alia, associated with institutional settings like regulations, business culture and with the way in which market functioning
(Hulten, 2001). Antipa et al. (2010) decompose the European business services productivity gap vis-à-vis the USA. They conclude that ICT use and input differences between the USA and the EU just play a minor
role, but most of the gap is explained by total factor productivity, a result that is in line with the findings of
O‟Mahony et al. (2009).
This paper explores the operation of competitive market selection, using a new indicator that summarises
the persistence of scale-related inefficiencies. The situation of European business services markets is a perfect case study. It is a large industry, with employment that is about as large as manufacturing. And moreover it is an industry that has a serious productivity problem.
The paper makes five novel contributions to the literature. Firstly, we develop this new indicator for the
efficiency of market selection. It follows the idea that, in an efficient market, firms with scale
diseconomies and consequent cost disadvantages cannot survive. If we find a pattern of persistent scale
diseconomies, this must signal a weak competitive selection and therefore inefficient markets. Secondly, we estimate a productivity frontier for European business services (across countries) by industry, size
class and year. The third contribution is that we assess the incidence of scale (dis)economies over time. We distinguish between efficiency gaps between and within size classes. A fourth contribution is that we
explain both scale efficiency and X-efficiency from structural factors like market contestability and regulatory characteristics. Finally, driven by constraints in internationally comparative data, we have developed a method of performing scale analysis on the basis of representative firms per data cell
(industry by size class by country by year).
For the research we used a data panel for thirteen EU countries, covering the period 1999-2005, eight sectors of business services and five firm-size classes. Our main findings are as follows. We find an overall
5 persistent, and even increased in several countries during the observation period. Both findings points to weak competitive selection. The smallest size class9 has a huge scale disadvantage relative to the most
efficient size class, but its X-efficiency is much higher than within other size classes. It indicates that these smallest firms have very strong mutual competition, but apparently they are not in effective competition
with firms of the larger size classes. The patterns of scale-related diseconomies within and between size classes are explained by market contestability (import penetration, start-up ratio of new firms) and by national regulatory policies. Focussing on the type of regulation, we find that X-efficiency and to a lesser
extent also scale efficiency are hampered by regulation that creates disincentives to market entry, business closure and employment flexibility. Such regulation has in common that it disturbs the dynamics of
competitive market selection.
The structure of the paper is as follows. Section 2 develops the framework for the analysis of competitive selection and market efficiency. Section 3 describes our methodology for identifying scale-related efficiency
differences through primarily non-parametric data envelopment analysis, and as a robustness check also through a parametric stochastic frontier model. The section also presents the empirical data and the main
patterns found in efficiency differences across countries, industries and size classes. Section 4 presents the econometric methods by which we investigate the determinants of EU patterns of static allocative efficiency
(scale efficiency, X-efficiency) and subsequently gives the empirical results of the explanatory models. Section 5 concludes and draws some policy lessons. The annex describes and underpins our data strategy; it also provides some descriptive information on the country and industry structure of the data.
2. Detecting weak market selection
In an efficient market we would expect that all firms try to operate on the scale size, because this is the size at which total profits are at their maximum. So, firms that are too small will try to grow because they are in a
disadvantaged position relative to competitors at the optimal scale size. And the same holds for those firms that are too large; the latter will try to reduce their scale size. If not, they will be punished by the market,
because standard market prices converge towards the level set by firms at optimal scale. Scale-inefficient firms experience lower profits and have to work harder to compensate their scale disadvantage or,
otherwise, go broke eventually. Dixit and Stiglitz (1977) have shown that the competitive selection mechanism also operates in markets where monopolistic competition and market differentiation prevail. If
the consumers have a sufficient taste for variety, not all scale effects will be fully exhausted in this Dixit-Stiglitz world, but a disciplinary market force remains in the form (actual or potential) entry of new
competitors whose product variety competes for the same consumer budget. Given sufficient entry, the market share of each product variety will be spread so thinly that the most inefficient producers can no
9
6 longer recover their marginal cost and drop out.10 If free entry is restricted, relatively inefficient producers may survive in the market. Both in static and dynamic terms, this lowers productivity performance in that
industry or market.
The implication of entry-exit selection in an efficient market is that firms with a productivity
disadvantage compared to the industry‟s productivity frontier will not be represented in the long-term
„steady-state‟ firm distribution (De Wit 2005). We take this steady-state firm distribution as a starting point for our framework of analysis. It is about a fictive industry in which scale economies are important. The
productivity of firms in industries with variable returns to scale, differ by size class because size classes have different technological, organisational or market-related options that affect productivity independently
of management quality. For instance, small firms may be very flexible, but they have fewer possibilities for internal division of labour. Their employees are typically involved in multi-tasking, which has some
productivity disadvantages (e.g. Coviello et al., 2010). Conversely, large firms may be good in splitting tasks and applying internal division of labour, but they become less flexible and have an imminent tendency
towards bureaucracy. If a particular size class in an industry combines the best of both characteristics and gets the highest output from a given combination of inputs, we call it the optimal firm size. If its markets
function well, all firms eventually grow (or shrink) to the size at which scale advantages are best exploited. This optimal scale can be used as a benchmark.
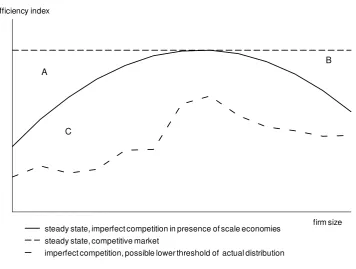
An intuitive version of our framework of analysis is presented in Figure 1. The vertical axis depicts the productivity distribution of firms and the horizontal axis shows the firm population ranked by size at a given
moment in time. The dashed line represents the “steady-state optimal scale” firm distribution. The smallest firms are found on the left side of the horizontal axis. The solid line depicts the productivity of the
best-performing firms in an industry where scale economies are important and where competition is imperfect. Even the most-productive large and small firm are less efficient than the frontier firm with the optimal scale
size. For the smallest firms this is caused by entry and or growth barriers in the market.11 Such barriers are operative in area A. The most-productive large firms on the right-hand side of the figure can hold their
position despite the fact that they are less efficient than the firms with optimal scale size. Exit barriers and/or market power (area B) relieve the pressure on them to shrink in size. However, many firms may operate less
efficiently than the best-practice firms in their size class. The dot-dashed line in the graph depicts the position of the least-efficient firms in each size class. Area C between the solid and dot-dashed line represents the efficiency variation within each size class, also labelled X-inefficiency. Figure 1 provides a
tool to distinguish between two kinds of weakness in market selection in an industry where scale economies
are important. The first weakness is the persistence over time of scale inefficiency, i.e. competition fails to eradicate scale-related efficiency differences between size classes. This could be due to entry and growth
10
Several authors found empirical evidence for dynamic productivity-related selection effects (Foster et al. 1998; Brown et al. 2006) or endogenous exit behaviour and input decisions (Olley et al. 1996).
11
7 barriers, market power and exit barriers (areas A+B). The second competitive weakness is the persistence of X-inefficiency, i.e. market selection fails within size classes (area C). The latter is not necessarily linked to
scale economies.12 The crux of our methodology for detecting weak market selection is to assess the
persistence over time of scale inefficiency and X-inefficiency. Figure 1 depicts the efficiency distribution by
[image:8.595.128.485.217.486.2]size class at moment t in time. To assess the persistence of scale- and X-inefficiencies we have to compare this situation with the situation at another point in time.
Figure 1 Framework for analysing firm size, productivity and market selection
efficiency index
firm size steady state, imperfect competition in presence of scale economies
steady state, competitive market
imperfect competition, possible lower threshold of actual distribution
A
C
B
Our approach to measuring selection efficiency of markets is related to Boone‟s profits elasticity measure
(Boone, 2004, 2008), but it may perform better if scale economies are important in an industry. The profits elasticity indicator is defined as “the percentage fall in profits due to a percentage increase in marginal
costs” (Boone et al. 2007: 2). The underlying intuition of the profits elasticity indicator is that in a more
competitive market, inefficient firms get punished more harshly in terms of profits. Boone‟s profits elasticity indicator measures how elastic a firm‟s profits are with respect to its marginal costs. However,
this measure may give biased results in industries operating under variable scale economies. The Boone‟s competitiveness indicator might correctly indicate competition intensity based on X-efficiency gaps, but it
cannot account for size-related efficiency differences as the profits elasticity indicator focuses on marginal costs. It will overrate competition intensity in size classes with weak scale efficiency where profits are
relatively low. Conversely, it will underrate the competition intensity in size classes with high scale
12
8 efficiency, where profits are relatively high. The eventual sign of the overall bias depends on the size relations between both parts of the industry. How important is this deficiency? Klette (1999) found that
there may be more variation in market power and scale economies within an industry than between
industries. Our indicator may be important for industries with high average capital intensity like
manufacturing and network industries. But it may also be important for analysing the role of competitive market selection in many services industries like distribution, and many producer and business services.13
3. Productivity frontiers and the persistence of scale inefficiencies
A first step in operationalising our indicator for competitive selection is to estimate the productivity frontiers by business-services branch, size class and year. The non-parametric data-envelopment analysis
(DEA) is a flexible approach that allows an in-depth look into the nature of scale economies. Data
envelopment analysis use „best-practice‟ observation in the data set to construct an efficiency frontier in the
relation between inputs and outputs. This can be applied to each meaningful sub-sample of firms, or
„decision-making units‟ (dmu) in DEA speech. Firms or dmu are directly compared against a combination of peers. Since the method is non-parametric it does not impose an a priori functional form or weights structure on the relation between inputs and outputs. The method calculates technical efficiencies without
requiring product and factor price data as weights. This property is particularly useful for the analysis of productivity issues in services, since product price data in services are often weak. DEA can be used if inputs and outputs have different dimensions (e.g. number of employees, dollars of output).
The DEA method applies linear programming to construct a non-parametric piece-wise surface over the
observed data for each meaningful grouping of firms.14 The frontier is „model free‟; it is identified as the
sample‟s „best-practice‟ technology. It means that one needs a representative sample to get meaningful outcomes. The efficiency frontier either defines the maximum combinations of outputs that can be
produced with a given set of inputs, or the minimum input combination that produces a given set of outputs. We use a DEA model that identifies the efficiency frontier associated with the minimum amount of inputs
that can produce a given level of output (cf. Zhu, 2009).
Formal model15
Each dmu observation i (i=1,...n) uses m inputs xzi (z=1,..,m) to produce q outputs yri (r=1,...,q). The
efficiency frontier is derived from these n observations. Two properties of the dataset are required to ensure
the feasibility and consistency of a piecewise linear approximation of the efficiency frontier and the area
dominated by the frontier. The first property is convexity. Let
ni1
ixzi (z1,..., )m be the possible13
Markusen (1989), Francois (1990) and Marrewijk et al. (1997) point out that most producer services are characterized by important scale economies. See further Shy (2001) on scale economies in IT industries.
14
See Cantner et al. (2007), Coelli et al. (2005) and Banker et al. (2004).
15
9 inputs for each dmu i and
in1
iyri (r1,..., )q the achievable outputs, where
i(
i
1,..., )
n
arenon-negative scalars such that
ni1
i 0. Each λk (ki) weight parameter informs about the importance ofobservation/dmu k as reference dmu for dmu v. The second property is that inefficiency is allowed to
exist.16 The input-oriented efficiency parameter zvgives the factor by which inputs z of dmu v have to be multiplied to arrive at the same efficiency as the frontier firms. Hence, for the frontier firms it must hold
that zv 1, and for the non-frontier zv 1. We start with a counterfactual analysis that will be used a framework of reference. The counterfactual analysis assumes that all firms and all size classes have access to the same technology as the best performing firm. It implies that if firms are less efficient, this can only
be due to sub-optimal management decisions, i.e. by a „wrong‟ combination of inputs. Because all firms have access to the same technology in this counter factual, it is a constant-returns-to-scale technology. The
DEA model finds both λi and frontier efficiency
*crts zv
by solving the linear programming system:
*
1
1
1
target function : min( ) :
1,..., ; 1,..., ; 1,..., ; 1,..., ; 0
0
crts crts
zv zv
n crts
i zi zv zv i
n
i ri rv i n i i i subject to
x x z m i n v i
y y r q i n v i
(3.1)with xzv and yrv representing, respectively, the zth input and the rth output for dmu v. Because of the DEA
duality conditions, each input-oriented efficiency measure can also be expressed as an (output-oriented)
measure of relative productivity, say rel zv
h , the output per composite unit of inputs and relative to the
frontier. For the set of frontier dmu Effi and the set of non-frontier dmu Ineffi the following equivalence relations hold:
|
1,
1,...,
|
1,
1,...,
|
1,
1,...,
|
1,
1,...,
crts rel
i i i
crts rel
i i i
Eff
i
i
n
i h
i
n
Ineff
i
i
n
i h
i
n
(3.2)These results allow to derive the distance to the efficiency frontier, a continuous inefficiency measure:
1 crts 1 rel ; 0 ( ) 1
i i i i
DTF h frontier DTF
(3.3)
The constant-returns-to-scale (CRTS) analysis does not consider scale economies, i.e. the possibility that there is a systematic relation between firm size and the amount of output yielded by a unit of inputs.
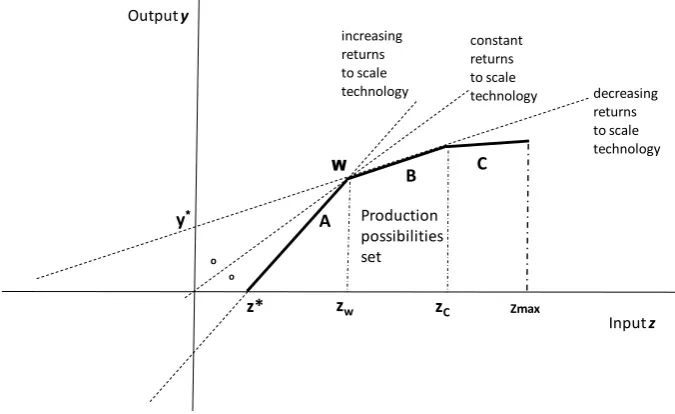
However, some efficiency variation might be systematically related to scale size. Figure 2 illustrates in a stylised way how scale effects may affect the relation between inputs and outputs around evaluation
16
10 point W. The dashed 45o-technology vector represents the case of constant returns to scale. The most horizontal, dashed technology vector represents the case of decreasing returns to scale that occur beyond
output level y*. The other dashed technology vector depicts the case of increasing returns to scale technology, but this technology only yields positive outputs for input level z>z*. For (input-measured)
[image:11.595.126.464.215.422.2]firm sizes z<z* the increasing-returns-to-scale technology does not belong to the production possibilities
Figure 2 Production possibilities and input-measured firm size
Input z
Output y
C B
A
o
constant returns to scale technology increasing
returns to scale
technology decreasing
returns to scale technology
W
y*
z* zw zC
Production possibilities set
o
Zmax
set. For the input size range zw - zmax the dmu cannot avoid the decreasing-returns-to-scale technology.
The production technology may have discontinuities like at input sizes z*, zw and zC. The result is a
kinked shape (ABC) of the production possibilities frontier and the production possibilities area
dominated by the frontier. It has implications for the efficiency analysis. Firms below frontier part A
should be compared with a dmu on frontier part A, and not with dmu on frontier part B, otherwise we mix up scale efficiency with „technical‟ X-efficiency. While technical or X-efficiency may depend on short-term management decisions and demand conditions, scale efficiency is the result of longer-short-term firm
growth and competitive selection in markets in which we are interested. DEA analysis allows to
disentangle both types of efficiency. The sum condition
ni1
i 0 in equation system (3.1) affects theweights with which other, different-sized dmu enter the efficiency comparison for reference dmu v under a
constant-returns-to-scale (CRTS) assumption. The more stringent sum condition
in1
i 1 will forcedmu v to be only compared with similar-sized other dmu. That allows to calculate variable returns to scale
(VRTS) efficiency parameters (e.g. Cantner et al. 2007).We thus set up a VRTS version of the linear
11
*
1
1
1
target function : min( ) :
1,..., ; 1,..., ; 1,..., ; 1,..., ; 1
0
vrts vrts
zv zv
n vrts
i zi zv zv i
n
i ri rv i n i i i subject to
x x z m i n v i
y y r q i n v i
(3.4)Like for the CRTS parameters there is an equivalence with output-oriented efficiency parameters. The sets of, respectively, frontier and non-frontier dmu from an X-efficiency perspective are now:
,
,
| 1, 1,..., | 1, 1,..., | 1, 1,..., | 1, 1,...,
vrts vrts rel vrts
i i i
vrts vrts rel vrts
i i i
Eff i i n i h i n
Ineff i i n i h i n
(3.5)
in which hirel vrts, are the (output-oriented) measures of relative productivity. After having identified the part
of efficiency that stems strictly from X-efficiency, also scale efficiency can be derived for each dmu:17
. ; 0 1 ( )
crts
crts vrts i
vrts
i i i i i
i
frontier
SCE SCE SCE
(3.6)
For the most productive firms in the most efficient size class it must hold that *crts *vrts 1
i i
, so firms
in the global maximum have SCEi =1, while it is less than 1 in other size classes. Size classes are intervals
and therefore contain more firms than the „best practice‟ firms for which SCEi =1 holds. Empirically, the most-efficient scale size is the one for which average SCEsis closest to one:
18
1
1
max( ns )
frontier
s i is
s
SCE SCE
n
(3.7)A few words are necessary to discuss possible limitations of DEA mentioned in the literature. Since DEA
is an extreme-point technique that generates an envelope production function from real observations, problems could be caused by outliers, measurement errors and other noise. DEA indeed regards all
deviations from the frontier as inefficiencies. In our case this problem should not be a big issue because our data points are representative firms per size class, which reduces the potential error from outliers and
measurement error considerably.19 DEA efficiency outcomes are also mentioned to converge slowly to the theoretical maximum efficiency. Again, this is not a problem for our analysis because we are not
interested in theoretical performance, but in relative firm performance and in the way the market selects
firms with a superior performance and „punishes‟ those with an inferior performance. A final issue is that
statistical hypothesis tests are difficult, since DEA is a nonparametric technique. We did use a parametric stochastic frontier (SF) model as a robustness check, reported in Kox, Van Leeuwen, Van der Wiel (2010).
17
Note that the CRTS and VRTS efficiency parameters are multiplicatively related, because in the input-output space both are measured on the same radius from the origin.
18
Size classes may be ranked by their scale efficiency relative to that of SCEfrontier. It is possible that several local maxima exist.
19
12 This robustness check confirms that non-constant returns to scale dominate in the European business-services industry. Because of its very structure (uniform technology imposed on all size classes), the SF
model is less flexible and less informative than the DEA method.
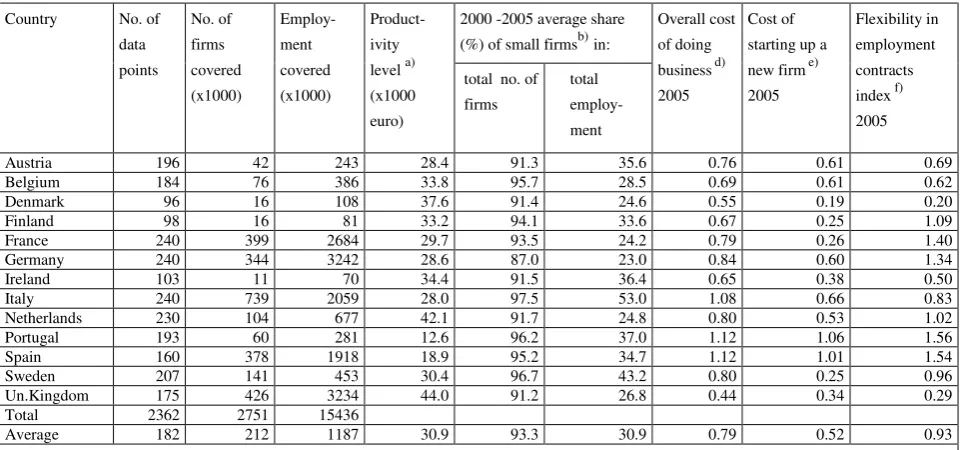
Data
Commercial databases with data on business services firms often have a systematic under-representation of small firms. Census data are still only available on a national basis from local statistical authorities, often
under strict confidentiality conditions, which forms a severe handicap for internationally comparative studies. We solved the data problem by using Eurostat‟s NewCronos firm demography database as the basis
for a new approach. Eurostat produces data on business services (sourced from national statistical offices) that cover many EU countries and the period 1995-2005. Each data cell provides information about a
country industry size class combination: the number of firms, total sales, total value added, number of
employed persons, and depreciation (proxy for fixed capital inputs). With these data we construct a
representative firm (dmu) for every combination of country industry size class.20 Recent empirical insights on the structure of firm size distributions suggest that the firm-size distribution across and within
size classes is similar (Axtell 2001). From this we infer that the use of constructed representative firms per data cell still allows marginal analysis as is necessary for the study of scale economies. The Annex deals
with this data issue in more detail. The construction of the data base requires a few further decisions, because the national statistical offices until recently used to deliver statistical data on business services
industry with different degrees of sector and firm-size detail. To allow full comparison across European countries we homogenise classifications at the lowest common denominator, thus sacrificing some available sub-sector and size-class detail and data years for some countries.21 Homogenisation across
countries yields a fully comparable set of data on business services industry in 13 EU countries, for eight sub-sectors, five size classes and for seven years (1999-2005). Theoretically this would yield 3640
observations on representative firms, but not all data cells are filled, and for most of the regressions we can use about 2700 observations. A further description of the data is found in the Annex.
As central productivity index for the analysis of scale performance we use labour productivity, defined as value added per employed full-time person. The data would have allowed using total factor
productivity (TFP) instead, but we have deliberately chosen not to use this measure. TFP is a non-explained residual from growth accounting, and as such a "measure of our ignorance" (Abramovitz). For TFP to be a
correct measure of multi-factor productivity a number of crucial conditions have to be met. One of such conditions is that factor input markets and output markets have perfect competition, so that production
factors are rewarded according to their marginal product and output prices are equal to marginal costs. Since these market conditions are precisely what we intend to investigate in business services, the use of
20
Between 2000 and 2005, the data cover 2.5 million EU business services firms and 14.1 million employees.
21The firm size classification is derived from the number of employed persons per firm, including employer. We use one
13 TFP levels as productivity measure is out of the question. We therefore opt for a relatively simple labour productivity indicator.
Descriptive results regarding scale inefficiencies
Table 1 provides the main efficiency scores for European business services, pooled over the period
1999-2005: general DEA efficiency ( *crts is
, CRTS), X-efficiency ( *vrts is
)
, and scale efficiency (SCEis)
. Thepresented efficiency scores pertain to median observations per size class, but the underlying efficiency
scores differ by industry and country. The efficiency scores display an interesting difference in the efficiency patterns for X-efficiency and scale efficiency.. Size class 1 has a higher X-efficiency than any
other size class. It means that firms within this size class apply nearly the same technology, with hardly any distance between the frontier firms and the average firm. It signals that within this size class there must be strong competition that eradicates or punishes efficiency slack. On the contrary, the efficiency
slack in the size classes 2, 3 and 4 amounts to 29-39%. This can indicate that the competitive pressure to converge towards the best-practice way of running a business is quite weak within these size classes.
Table 1 Efficiency scores by size class, across sectors, countries and years (1999-2005), medians by size classa)
Size classes CRTS efficiency b) Scale efficiency X-efficiency (VRTS)
1 (1–9 employed persons) 0.42 0.49 0.93
2 (10–19 employed persons) 0.57 0.93 0.61
3 (20–49 employed persons) 0.60 0.97 0.62
4 (50–249 employed persons) 0.65 0.99 0.66
5 ( ≥250 employed persons) 0.70 0.98 0.81
a) The average number of scale indices per size class is 591, of which the median value is presented. b) Calculated as
median DEA CRTS efficiency (=scale efficiency times X-efficiency). Source: own calculations.
When we compare the scale efficiency differences between the size classes a completely different picture arises. The scale-efficiency scores show that −from a productivity perspective− the technology of the smallest size class is grossly sub-optimal compared to the other size classes. The scale efficiency of size class 1 is less than half that of the most efficient size class (4). Hence, size class 1 has significant diseconomies of scale. The median scale efficiency jumps up to above 90% once a firm passes the 10-employees threshold , and after that, increases only marginally, reaching a top in size class 4 (50-249 workers). Scale efficiency falls slightly in the largest size class, hinting at some diseconomies of large scale. However, the difference is small and could fall within a measurement-error range; we return to this issue later on.
Firms operating on a sub-optimal scale may be found on the increasing-returns-to-scale part of the production function. This can be explored by calculating for each data cell whether it is subject to
14 production function. A considerable number of cases operates in the decreasing-returns-to-scale region, especially in the larger size classes. The distribution of the marginal DEA-scale efficiencies thus permits
the conclusion that many small firms have the potential to increase their productivity by a better use of scale economies. Firms in the smallest size class have a large potential for scale-related productivity gains
if they would succeed in growing to a size of 50-249 employees. The latter size class (4) can be considered as the optimal size class on the basis of Table 1. Once a firm has reached a size of 10-19 employees the potential for further size-related productivity gains diminishes sharply. Size class 2 (10-19 employees) may
therefore be labelled as the minimum-efficient size class. The absolute firm growth required to get from size class 1 (1-9 employees) to size class 2 is quite small, but the scale-efficiency results nonetheless
suggest that such firm growth would be highly effective for average productivity in European business services. The smallest size class represents 95 of all firms and one-third of total employment.
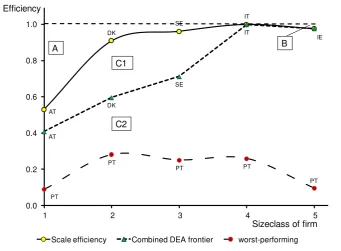
The results so far were presented at an aggregated level. To get a better flavour of the results at the level of
the individual business-services branches, Figure 3 shows the distribution of size-related efficiencies for the Architectural, engineering, technical services branch in 2005. The only variation left in this graph is the
[image:15.595.131.473.424.675.2]variation between countries. The presentation is similar to the „theoretical‟ Figure 1, but now with real data.
Figure 3 Scale performance in Architectural, Engineering & Technical Services (K742-3), per size class, 2005
AT
DK
SE
IT
IE
AT
DK
SE
IT
PT
PT
PT PT
PT
0.0 0.2 0.4 0.6 0.8 1.0
1 2 3 4 5
Efficiency
Sizeclass of firm
Scale efficiency Combined DEA frontier worst-performing
C2 C1
A B
Note: AT =Austria; DK=Denmark; SE=Sweden; IT=Italy; IE=Ireland; PT=Portugal.
It shows that the countries on the SCE-frontier differ by size class (Austria, Denmark, Sweden Italy and Ireland), and that Portugal is consistently the worst performer. The X-inefficiency area C of Figure 1 is now
15 (by size class), while area C2 shows the X-inefficiency area for all other countries. Especially the C2 X-inefficiency area shows the wide dispersion of productivity performance within this European
business-services branch. We have suppressed the data points for other countries, to avoid that figure becomes too cluttered. Size class 4 (50-249 employees) is the optimal size class for the EU countries as a whole, but this
is not necessarily the case in individual countries. For instance in Portugal‟s architecture and engineering industry, size class 2 appears to be the most productive one.
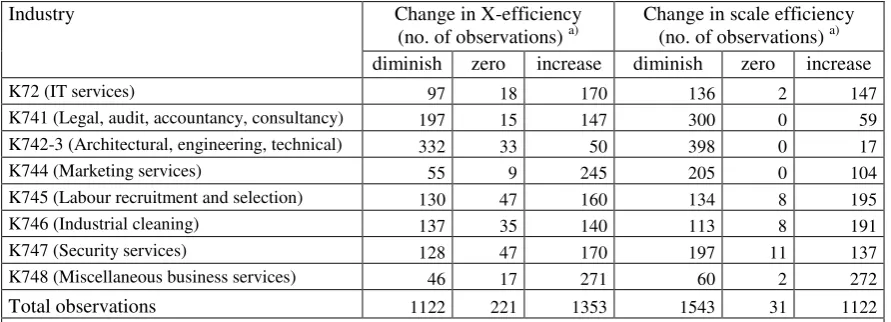
We propose to measure competitive selection over time by the persistence of scale- and X-efficiencies. Data is available for the time interval 1999-2005. This was a period of strong growth for EU
business-services industry in which dynamic reallocation of market shares could have generated a convergence towards an optimal scale of operations or towards reduction of X-inefficiencies. Table 2 shows for eight
industries whether scale efficiency and X-efficiency between 1999 and 2005 went up or down, or stayed the same. Scale efficiency improved in four industries and deteriorated elsewhere. X-efficiency has improved
in four industries and deteriorated in four other industries. Three industries (IT services, labour recruitment and miscellaneous business services) appear to have improved both their X-efficiency and their scale
[image:16.595.61.507.428.589.2]efficiency. Conversely, two industries (K741 and K742-3) experienced a deterioration of both types of efficiency. Overall, industries where scale performance improves, form a minority.
Table 2 Change in scale-related efficiency, by EU business-services industry, 1999-2005
Industry Change in X-efficiency
(no. of observations) a)
Change in scale efficiency (no. of observations) a) diminish zero increase diminish zero increase
K72 (IT services) 97 18 170 136 2 147
K741 (Legal, audit, accountancy, consultancy) 197 15 147 300 0 59
K742-3 (Architectural, engineering, technical) 332 33 50 398 0 17
K744 (Marketing services) 55 9 245 205 0 104
K745 (Labour recruitment and selection) 130 47 160 134 8 195
K746 (Industrial cleaning) 137 35 140 113 8 191
K747 (Security services) 128 47 170 197 11 137
K748 (Miscellaneous business services) 46 17 271 60 2 272
Total observations 1122 221 1353 1543 31 1122
a) Change between 1999 (or closest available starting year) and 2005 (or closest available final year). The variation in
the data is by country and size class. Source: own calculations. Source: own calculations.
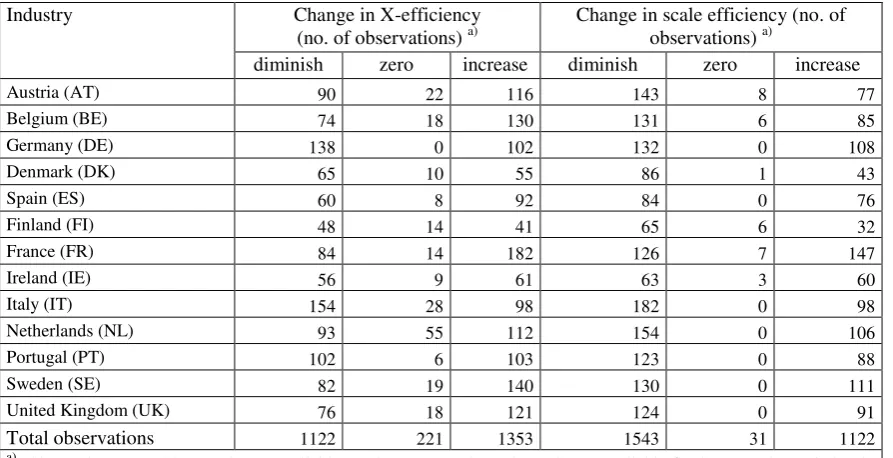
Table 3 repeats this analysis at the country level. X-efficiency has improved in seven countries (Austria, Belgium, Spain, France, Netherlands, Sweden and the UK), whereas a positive change in scale efficiency
16
Table 3 Change in scale-related efficiency, by country, 1999-2005
Industry Change in X-efficiency
(no. of observations) a)
Change in scale efficiency (no. of observations) a)
diminish zero increase diminish zero increase
Austria (AT) 90 22 116 143 8 77
Belgium (BE) 74 18 130 131 6 85
Germany (DE) 138 0 102 132 0 108
Denmark (DK) 65 10 55 86 1 43
Spain (ES) 60 8 92 84 0 76
Finland (FI) 48 14 41 65 6 32
France (FR) 84 14 182 126 7 147
Ireland (IE) 56 9 61 63 3 60
Italy (IT) 154 28 98 182 0 98
Netherlands (NL) 93 55 112 154 0 106
Portugal (PT) 102 6 103 123 0 88
Sweden (SE) 82 19 140 130 0 111
United Kingdom (UK) 76 18 121 124 0 91
Total observations 1122 221 1353 1543 31 1122
a) Change between 1999 (or closest available starting year) and 2005 (or closest available final year). The variation in
the data is by industry and size class. Source: own calculations.
In a further breakdown of the results, Table 4 displays that improvements of X-efficiency were
concentrated in the three smallest size classes, with the relatively strongest improvement in size class 1. The X-efficiency performance of the largest size classes generally has worsened over time. Scale
efficiency on average has worsened in all size classes except in the size class with 50-249 employees. Not only the number of cases with increasing or decreasing efficiency matters, but it also matters what
happened with the width of the efficiency gap between the most- and least-efficient size classes. In a competitive industry we would expect that this gap diminishes over time due to dynamic selection.
Table 4 Persistence of scale performance in EU business services by size class, 1999-2005
Size class Change in X-efficiency
(no. of observations) a)
Change in scale efficiency (no. of observations) a) diminish zero increase diminish zero increase
1 (1–9 employed persons) 159 94 303 338 9 209
2 (10–19 employed persons) 262 7 281 345 0 205
3 (20–49 employed persons) 235 1 314 326 1 223
4 (50–249 employed persons) 266 12 259 257 5 275
5 ( ≥250 employed persons) 200 107 196 277 16 210
All size classes 1122 221 1353 1543 31 1122
a) Change between 1999 (or closest available starting year) and 2005 (or closest available final year). The variation in
the data is by country and industry. Source: own calculations.
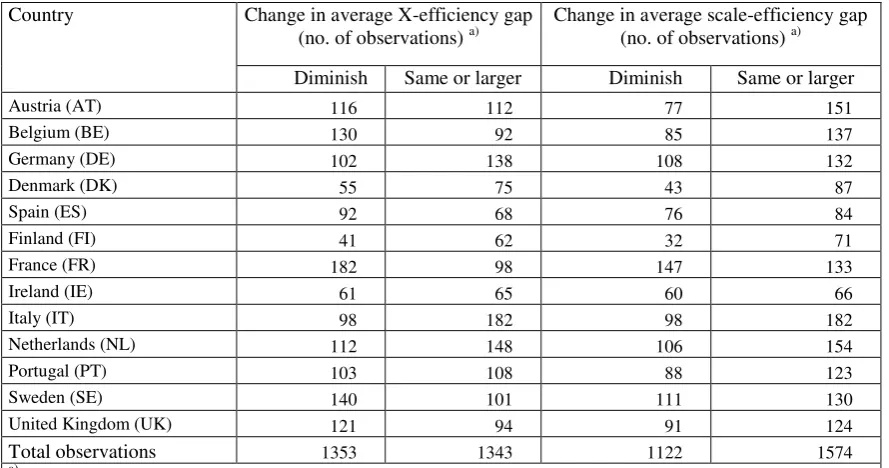
[image:17.595.61.506.507.637.2]17 important, but we found no positive evidence for that in the form of increasing capital-labour ratios. We therefore conclude that convergence to an optimal scale is not imposed by market forces in European business services. Rather than that, there is weaker competition between size classes in most countries. The average X-efficiency gap within size classes became larger or remained the same in most countries, but diminished in Austria, Belgium, Spain, France, Sweden and the UK.
Table 5 Change in average efficiency gaps, by country over time interval 1999-2005
Country Change in average X-efficiency gap
(no. of observations) a)
Change in average scale-efficiency gap (no. of observations) a)
Diminish Same or larger Diminish Same or larger
Austria (AT) 116 112 77 151
Belgium (BE) 130 92 85 137
Germany (DE) 102 138 108 132
Denmark (DK) 55 75 43 87
Spain (ES) 92 68 76 84
Finland (FI) 41 62 32 71
France (FR) 182 98 147 133
Ireland (IE) 61 65 60 66
Italy (IT) 98 182 98 182
Netherlands (NL) 112 148 106 154
Portugal (PT) 103 108 88 123
Sweden (SE) 140 101 111 130
United Kingdom (UK) 121 94 91 124
Total observations 1353 1343 1122 1574
a) Change between 1999 (or closest available starting year) and 2005 (or closest available final year). The variation in
the data is by industry and size class. Source: own calculations.
Not all data cells are equally important in terms of employment. Figure 4 is a scatter plot of the
employment-weighted change in the average size of efficiency gaps within and between size classes. The
size of the dots is proportional to the employment size of each data cell. In a dynamic market with effective competitive selection we would expect a reduction in both efficiency gaps, with a clear dominance of
observations in the southwest quadrant C. This is not what we observe in Figure 4. Many heavy-weight dots are found in northwest quadrant D (smaller X-efficiency gap, but larger scale efficiency-gap) and in
northeast quadrant A (increase of both efficiency gaps). The pattern is not driven by outliers, but is found in parts of European business services that represent large chunks of overall employment. A short
characterisation of the dynamic pattern is that we observe an overall increase of scale-efficiency gaps with a mixed performance regarding X-efficiency gaps.
18
Figure 4 Change in average efficiency gaps over 1999-2005 interval , observations weighted by employment size
A
B D
C
-.
4
-.
2
0
.2
.4
-.6 -.4 -.2 0 .2 .4 .6
1999-2005 change in avg. X-efficiency gap Note: observations weighted by employment size
4. Explaining scale-related inefficiencies
Since we find divergent results for different countries and industries, the next challenge is to identify the market characteristics and environment factors that explain the dynamics of scale-related inefficiencies.
Our preferred approach is a Tobit model in which X-efficiency and scale efficiency are explained as continuous variables in a panel data context for 1999-2005. We do several robustness checks to investigate
the stability and soundness of the Tobit results.
The hypothesis that we test is that regulatory characteristics and market contestability variables
explain the level of scale-efficiency and X-efficiency per data cell.22 The data has a panel structure, holding information on both the intertemporal dynamics and on the observed group entities. It allows to
deal efficiently with unobserved or missing variables. A Tobit regression is applied because of the continuous but censored nature of the DEA variables (cf. Hsiao 2006). We apply a random-effects Tobit
panel estimator, which accounts for the possibility that our selection of countries and industries has impact on the results. An additional reason to apply random effects (RE) relates to the structure of our data. Though we know the number of firms in each data cell, we do not know which firm is in what data cell in
which year.23 This limitation rules out the use of a model with firm-level fixed-effects, but a RE model is a good stand-in. We test two similar Tobit panel regression models for explaining the scale efficiency and
22
Note that our observations are constructed representative firms per data cell (unique combinations of size class, industry, country and year), which is the lowest level of data detail for which we have internationally comparative data.
23
19 efficiency performance, for explaining the scale efficiency and X-efficiency performance, respectively
sjkt
SCE and
*sjktVRTS:1 2
*
1 2
ln(
)
ln(
)
kjst kjst kjt s j kjst
VRTS
kjst kjst kjt s j kjst
SCE
M
R
z
z
M
R
z
z
(4.1)
in which zj and zs are vectors of fixed-effect dummy variables for, respectively, industries and size classes; the M vectorcollects explanatory variables for market contestability, the R vector contains variables for the regulatory environment, and
sjktand
sjktrepresent error terms.As explanatory variables for the regulatory environment our first model applies an umbrella
indicator, and in a second model we differentiate to three regulatory variables for specific domains of entry and exit costs. The umbrella indicator regulation-caused costs of doing business (cdb_aba) varies by
country and year is constructed from the least aggregated data of the World Bank Cost of Doing Business database. cdb_aba is a combined index based on 46 quantitative sub-indicators for regulation-linked costs
for ten business activity areas, like starting a business, getting credit, enforcement of contracts, closing a business, employing labour, getting licenses, getting credit, trading across borders and paying taxes.24 A
higher value on this index reflects more business costs. In our second model we use indicators from the same World Bank source and with the same properties, but now for regulation in specific business areas that affect dynamic market selection. For entry costs we use the cost ofstarting a business index, for the
regulatory costs of hiring and firing workers and flexibility in labour contracts we use employment
inflexibility, and for exit costs we use costs of closing a business. To avoid possible multicollinearity
problems between employment inflexibility and cost ofstarting a business, we have interacted
employment inflexibilitywith each data cell‟s capital-labour ratio. Based on the literature (section 1), our
hypothesis is that all four regulatory variables have a negative impact on both scale efficiency,
X-efficiency, and the persistence of both, because the regulation tends to shield-off the incumbent firms. The
M vector holds variables for the contestability of business services markets national markets. Since the persistence of scale diseconomies is used as an indicator for competitive market selection we cannot use
any market structure variables like market concentration ratios that are outcomes of competitive selection.
Instead, we use two variables that proxy the (exogenous) contestability of the incumbents‟ market. The
first one is import penetration, measured as the share of imports in total domestic use of business services.25 The second one is the start-up rate of new firms.26 Both imports and start-ups may have two
discernible competitive impacts:
24
The index is constructed by item-wise comparing each EU country with a 60-country reference group in which all 28 sub-indices for individual business areas enter the umbrella index with equal weights. It varies in the [0,3] space.
25
20 a. they potentially contest the market position of national incumbent firms by introducing innovation,
new varieties, cheaper products and new marketing methods.
b. they may exert a „business stealing effect‟ with a potential threat to the rents of the incumbent firms, and/or the market share and scale gains of the latter.
Foreign firms generally bring with them some scale advantages, built up in home markets or elsewhere. For import penetration it is not a priori evident how this works out for X-efficiency and scale efficiency. More import penetration probably induces more X-efficiency, but not necessarily more scale efficiency. The
„business stealing‟ effect could undermine the achievement of scale gains by domestic firms. Domestic
start-ups increase domestic market contestability for incumbent firms, because of their actual and potential
„business stealing‟ effect. We test these two market variables first separately and then in combination. A problem is that the number of observation drops by almost one-quarter if we include the domestic start-up
ratio, due to missing data.
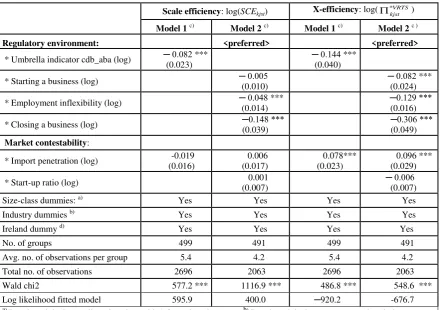
Table 6 provides the marginal effects of a change in the explanatory variables in the conditional mean for DEA X-efficiencies and DEA scale efficiencies, calculated on the basis of the random-effects Tobit
models. All continuous variables are expressed in logarithms. The results may be read as elasticities, giving the x% change in the conditional mean of the DEA scale efficiencies or X-efficiencies after 1%
change in an explanatory variable. In both tested models, all regulatory variables have a significant negative impact on X-efficiency, with the largest effect (-0.3) for the costs of closing a business and the regulation-linked employment inflexibility index (-0.12). Import penetration has a significant positive
impact on X-efficiency. When turning to scale efficiency, all regulatory variables still have a negative sign, but the regulatory costs of starting a new business appears not to have a significant impact. Also import
penetration has no significant impact on scale efficiency. Domestic start-up ratios in none of the regressions have a significant impact.
We have run the regressions of Table 6 for individual size classes and branches to obtain a better understanding of what drives the results.27 One results that catches the eye is that regulation-linked
employment inflexibility and costs of closing a business have a significant negative impact on both the scale
efficiency and the X-efficiency of almost all industries, and also on the X-efficiency of most size classes.
We have performed a number of robustness checks. Firstly, to account for the possibility that the results are mainly driven by the scale-efficiency gap of the smallest size class (0-9 employees), we repeated the regression of table 6 after removing these small-firm observations from the sample (making size class 5
the new benchmark for the dummies). This did not change the overall pattern of the results, with one
exception. The domestic start-up ratio now had a significant negative impact on X-efficiency. We
26
Defined as the number of new firms by data cell over the number of incumbent firms, using data from the Eurostat business demography database, with variation by country, industry and year. In case of missing data we proxied the variable as the net growth rate of the number of firms per data cell
1 /
kjst kjst
nof nof
, even though this proxy is like to understate the real annual start-up rate, because of non-observed exits.
27
21
Table 6 Explaining scale efficiency and X-efficiency performance, using Tobit panel estimator with random effects
Scale efficiency: log(SCEkjst) X-efficiency:log( *VRTS kjst
)
Model 1 c) Model 2 c) Model 1 c) Model 2 c )
Regulatory environment: <preferred> <preferred>
* Umbrella indicator cdb_aba (log) ─ 0.082 *** (0.023)
─ 0.144 *** (0.040)
* Starting a business (log) ─ 0.005(0.010) ─ 0.082(0.024) ***
* Employment inflexibility (log) ─ 0.048 ***
(0.014)
─0.129 *** (0.016)
* Closing a business (log) (0.039) ─0.148 *** (0.049) ─0.306 ***
Market contestability:
* Import penetration (log) -0.019 (0.016)
0.006 (0.017)
0.078*** (0.023)
0.096 *** (0.029)
* Start-up ratio (log) 0.001 (0.007) (0.007) ─ 0.006
Size-class dummies: a) Yes Yes Yes Yes
Industry dummies b) Yes Yes Yes Yes Ireland dummy d) Yes Yes Yes Yes
No. of groups 499 491 499 491
Avg. no. of observations per group 5.4 4.2 5.4 4.2
Total no. of observations 2696 2063 2696 2063
Wald chi2 577.2 *** 1116.9 *** 486.8 *** 548.6 ***
Log likelihood fitted model 595.9 400.0 ─920.2 -676.7
a) Benchmark is the smallest size class with 1-9 employed persons. b) Benchmark is the computer services industry
(K720). c) The figures between between parentheses are bootstrapped standard errors derived by replication of the regressions for the number of groups reported in the table. Significance codes, based on Z values: ** significant at 5% confidence level, *** significant at 1% level. d) see main text. Source: own calculations.
interpret this difference as evidence that the positive X-efficiency contribution of start-ups is mainly concentrated in the smallest size class, and that in other size classes the start-ups are less efficient than incumbents. A second robustness test was done, because the random-effects Tobit model is relatively
sensitive to regression errors that are not normally distributed. We therefore used a bootstrap procedure for
deriving reliable standard errors. This robustness check changed the results only marginally. Table
6
presents
the „bootstrapped‟ results. Thirdly, to investigate the role of unobserved country heterogeneity we did also a OLS regression on the same dependent variables using the same explanatory variables, but with standard errors clustered by country. This reproduced the same pattern of estimated parameter values and statistical significance as in Table 6. The only major difference was that import penetration was no longersignificant, possibly due to the fact that (because lacking detailed data) we had to measure import
penetration at the national level for business services as a whole, where it may be correlated with other
non-observed country heterogeneity.
5. Conclusions
22 been derived by DEA methods. The method has been applied to analyse market performance in European business services. Most countries during the period 1999-2005 display a persistence and even deterioration
of scale inefficiencies (between size classes), while the picture for X-inefficiencies (within-sizeclass efficiency gaps) was mixed at best. The conclusion seems unavoidable that there is weak competition
between small and large firms in EU business services. Similarly, in many countries and industries we also find weak competitive selection within size classes of the same industry. A salient finding is that small firms appear to compete mostly with other small firms, but not with firms in other size classes. Our results appear
not to be driven by a few industries, countries or size classes, but prevail widely in European business services. The pattern of weak dynamic market selection may explain the results by other studies that
European business services industry has zero or even negative TFP growth over the past decades. Which factors may explain the variation between countries and industries in the persistence of
scale-related inefficiencies? To find out we did panel regressions with two market-contestability variables (domestic start-up ratios, import penetration) and four regulation variables that pertain to the entry costs,
exit costs and employment-adjustment costs. The regulatory variables all have a significant negative impact on X-efficiency, and most of them also have a negative impact on scale efficiency. Import penetration has a
significant positive effect on within-sizeclass competitive selection, but was found not to have a significant impact on scale efficiency (perhaps due to „business stealing‟ effect which makes the attainment of scale
gains more difficult).
Business services supply 15-25% of all intermediary production inputs in the EU countries. Weak competitive selection in such a key industry may be of more than academic relevance. These conclusions are
most relevant for current European policies, such as „Europe 2020‟ that aims inter alia at more integration of European services markets. While business services imports tend to increase the number of product varieties
available for domestic firms, our results indicate that more import penetration also improves dynamic market selection. Another conclusion is that regulatory reform is important. Especially regulation that
lowers exit costs (costs of closing a business), makes labour adjustment by firms more flexible, and lowers start-up costs for new firms will strengthen dynamic market selection anind, indirectly, the productivity
performance of European business services.
ANNEX ON DATA
A. Data on the representative firm by 'data cell'. Our data consist of constructed 'average firms' for each combination of 5 size classes, 8 sub-sectors and 13 countries in the cross-sectional dimension. We do not have specific information on the distribution of firms within each data cell (size class by sub-sector by
country). Nonetheless our „average‟ observations can be considered as representative firms for each data