http://www.scirp.org/journal/jbbs ISSN Online: 2160-5874 ISSN Print: 2160-5866
Spatial-Temporal Quantitative Global Energy
Differences between the Living and Dead Human
Brain
Nicolas Rouleau
1,2, Michael A. Persinger
1,21Biomolecular Sciences Program, Laurentian University, Sudbury, Canada 2Behavioural Neuroscience Program, Laurentian University, Sudbury, Canada
Abstract
The dynamic differences between a living human brain and a clinically dead (fixed) human brain were measured over international Quantitative Electroencephalo-graphic (QEEG) sites for 1 Hz increments between 1 Hz and 50 Hz. Although the expected greater power (μV2∙Hz−1) for the living brain was apparent, the difference
was particularly obvious for theta and low beta bands. The integrated square root values over the entire band indicated the difference in intrinsic charge-based energy between the living (higher) and dead brain was ~2·10−23 J. This quantity is
remarka-bly proximal to the Cosmic Background Microwave value and would be consistent with the Hameroff-Penrose definition of consciousness that suggests a permeating presence derived from discrete physical events. A power value obtained by multiply-ing this increment of energy by the frequency of the universal hydrogen line resulted in ~10−12 W∙m−2 when applied to the surface area of the human cerebrum. This value
is the median flux density that has been measured from human brains during cogni-tion and defines the ultra-weak photon emissions displayed by cells, tissue, and or-ganisms. These results suggest that modern technology may now be sufficiently pre-cise to discern the critical parameters that differentiate the living brain from the fixed “dead” brain. This information might be useful for future designs of virtual con-sciousness and simulations within cerebral space.
Keywords
QEEG, Living Tissue, Dead Tissue, Theta Band, Factor Analysis, Cosmic Microwave Background
1. Introduction
One of the basic principles of neuroscience is that structure determines function. The
How to cite this paper: Rouleau, N. and Persinger, M.A. (2016) Spatial-Temporal Quantitative Global Energy Differences between the Living and Dead Human Brain. Journal of Behavioral and Brain Science, 6, 475-484.
http://dx.doi.org/10.4236/jbbs.2016.612043
Received: September 25, 2016 Accepted: October 31, 2016 Published: November 3, 2016
Copyright © 2016 by authors and Scientific Research Publishing Inc. This work is licensed under the Creative Commons Attribution International License (CC BY 4.0).
http://creativecommons.org/licenses/by/4.0/
physical parameters that differentiate between the living human brain and the fixed, post-mortem human brain have not been explored thoroughly. Once the human brain is removed and fixed, it is assumed to be “dead” and without the potential for dynamic properties. Recent technologies have allowed, for the first time, access to quantitative measures of sufficient density to assess these potential differences [1] [2] [3]. In most sciences, the contribution of a process or experimental manipulation requires a refer-ence (a “control” group). We designed an experiment that would produce relatively ar-tifact-free quantitative differences between the intrinsic electroencephalographic prop-erties of a representative fixed human brain and those obtained from a representative living brain.
Historically, the aggregate or field of electromagnetic patterns and the mosaic of chemical processes that define or can be employed to describe the living brain and its properties have not measured the quantitative differences between living and dead states from a holistic perspective. However, if one approaches the problem in a manner similar to the measurement of spontaneous photons where the actual measurements are subtracted from the dark counts that define the intrinsic circuitry of the photomultip-lier unit [4], then the actual increments of dynamic energy can be inferred. Here we demonstrate for the first time in the published literature that differences in potentials over the 1 Hz successive increments of the contemporary quantitative electroencepha-lography (QEEG) between a living and a dead human brain reveal a quantity of energy that might be central to the understanding of the universal values that define “living and consciousness”. These quantities may have philosophical significance as well as ap-plication to the synthetic creation of simulated or virtual living and consciousness states.
2. Methods
The aim of the study was to investigate the frequency-dependent electric potential dif-ferences (µV) between gyri of a post-mortem, chemically fixed human brain and its ba-silar artery. Needle-electrodes were inserted into all major gyri of a post-mortem hu-man brain. Power densities (PDs) were measured in μV2·Hz−1 and compared to
equiva-lent measures from the QEEG of a living brain. Relatively equal PDs as a function of frequency defines white noise. The measurements presented here are unevenly distri-buted across frequency bands and respond dynamically to applications of stimuli [3].
2.1. Fixed Human Brain Specimen
of a needle electrode (n = 52) were included in the analysis. Gyri of the human cere-brum can extend over considerable spatial distances. In this experiment probes were only inserted into one point along a given gyrus. The fixed human brain, for the pur-poses of simplicity, was labelled the “Non-Living” and the person’s brain was labelled “Living”.
2.2. Measurement Device
A Mitsar 201 amplifier unit, typically used in quantitative electroencephalography, was coupled to five needle-electrodes. Four of the probes, which were inserted into the ba-silar artery of the human brain fixed in EFA, collectively served as the electrical refer-ence point. The remaining probe was inserted serially into most gyri over the surface of the human brain. Electric potential differences (µV) were obtained and subsequently converted to spectral power densities (µV2·Hz−1) within SPSS v19 for segmentation into
discrete bands: delta (1.5 Hz - 4 Hz), theta (4 Hz - 7.5 Hz), alpha (7.5 Hz - 14 Hz), beta1 (14 Hz - 20 Hz), beta2 (20 Hz - 30 Hz), and gamma (30 Hz - 40 Hz). The device was set to measure with a sampling rate of 250 Hz. Low- (1.5 Hz) and high-cut (50 Hz) filters were applied to reduce extraneous sources of electrical noise. An additional notch filter was applied to remove 60 Hz electrical artifacts.
2.3. Human QEEG Reference Point
QEEG data extracted from the brain of a living human participant was used as a refer-ence point for the analysis. The case was selected from a database of QEEG profiles containing hundreds of individuals’ electroencephalograms [6] which were collected by the Neuroscience Research Group at Laurentian University. This Living brain met cri-teria which indicated that it was representative of the database. The mean normalized (z-scored) power densities within all bands during QEEG recordings while the subject’s eyes were closed did not exceed z = 2.00. There was no reported history of head injury or neuropathology. QEEG channels for the Living brain were those typically associated with the 10 - 20 International system of electrode placement. However, only channels which were situated over gyri which were probed within the Non-Living brain were re-tained for the analysis. The pairs are not perfectly superimposed in space, though their positions are proximal to within <1 cm.
2.4. Protocol
Non-Living brain measurements consisted of 30 second recordings of raw microvolt potentials. Each measurement was preceded by a surface primer application of 10% EFA to prevent tissue from drying. Raw potentials were extracted and transferred to SPSS v19 for subsequent processing. Signals were z-transformed and spectral analyzed. Data were then segmented into frequency bins.
2.5. Analysis
between the Non-Living human brain and the Living brain, two other analyses were employed. The first analysis involved dimensional reduction. Factor analyses with va-rimax rotation were explored by loadings of all gyrus- (Non-Living) and channel- sourced (Living) PD profile time series. With maximum iterations set to 25, the factor analyses were performed within each QEEG band (i.e. delta, theta, alpha, beta1, beta2, and gamma). These analyses facilitated plotting of the numbers of factors which cumu-latively explained the most amount of variance within each frequency band for both the Non-Living and Living brains.
The second analysis involved correlating time-independent, band-specific PDs ob-tained over left and right hemispheric homologous areas. Living and Non-Living brain data obtained at different times (T1 and T2) were extracted for contralateral pairs of channels and needle-electrodes. Data were normalized by z-transformation and spectral analysed. Power profiles for contralateral pairs of channels (Living) and needle-elec- trodes (Non-Living) were correlated within typical QEEG frequency bands (i.e. delta, theta, alpha, beta1, beta2, and gamma) as well as low- and high-frequency case-cont- rolled (n = 254) band ranges (i.e. 1.5 Hz - 10 Hz and 31.5 Hz - 40Hz). We reasoned that strong correlations would indicate time-independent PD profile parity for contralateral pairs. This is an implicit measure of PD stability between hemispheric homologues over time. Alternatively, any reliable strong correlation between time-independent PD pro-files for contralateral pairs could be considered as an indicator of high signal redun-dancy for the paired structures being directly probed or over which QEEG channels were positioned.
3. Results
Increased power densities (μV2·Hz−1) within all frequency bands were observed in the
Living brain relative to those obtained within the needle-probed Non-Living brain with effect sizes (r2) ranging between 0.26 and 0.90 (Figure 1A). On the other hand, within
the delta-band (1.5 Hz - 4 Hz) PDs of equivalent amplitudes were observed when pa-rieto-occipital sources for Living (i.e. O1, O2, P3, and P4) and Non-Living (i.e. left and right occipital poles and superior parietal lobules) brains [t (6) = −1.10, p = 0.31] were compared as shown in Figure 1B. These differences indicate that measurements ob-tained within the Living and Non-Living brains could be effectively discriminated based upon frequency-dependent signal amplitudes. The exception was the caudal ag-gregates. The primary sources of variance were differences within theta, alpha, and be-ta1 bands.
Figure 1. Living (light) and non-living (dark) PD differences as a function of frequency band for an aggregate of all channel-electrode matched measurements (A) as well as delta-band PDs for lobular aggregates (B).
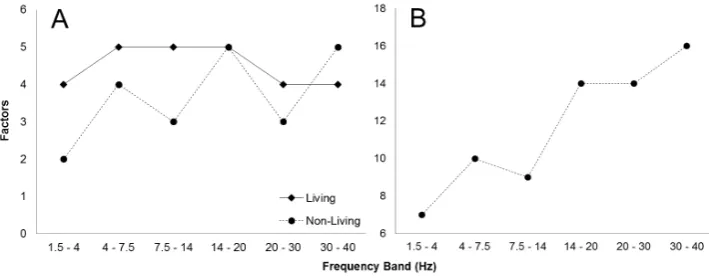
Figure 2. Living (squares) and non-living (circles) channel-electrode matched PD source (n =
14) factors within all frequency bands (A) as well as non-living PD source factors for all probed gyri (n = 52) within all frequency bands (B).
gyri (n = 52) were entered into the factor analysis, a conspicuous, strong positive rela-tionship emerged between frequency and factors (r = 0.95, p < 0.005, rho = 0.93, p < 0.01), which is presented in Figure 2B.
[image:5.595.196.551.299.438.2]The low-frequency (1.5 Hz - 10 Hz) case-controlled band range demonstrated in-creased correlations relative to the high-frequency (31.5 Hz - 40 Hz) range for both Living and Non-Living brains. However, correlations for the Living brain were (in a majority of cases) significantly weaker than those associated with the Non-Living brain when low-frequencies (Fz > 1.96, p < 0.001) were examined. One conspicuous overlap-ping feature consisted of clusters of strong correlations (r > 0.80, p < 0.05) centering upon the fronto-temporal operculum for both the Living and Non-Living low-freq- uency bands. They were eliminated (r ≃ 0) at higher frequencies. It was apparent that the Living brain was subject to incidences of non-correlation over spatially diffuse re-gions within the high-frequency band (Figure 3). In contrast, the Non-Living brain ex-pressed primarily fronto-temporal incidences of non-correlation (Figure 4). These re-presentational maps suggest some gross overlap of time-independent PD profiles for
Figure 3. Representational maps of time-independent PD correlations (pearson r) between
con-tralateral homologous sensor pairs in a living human brain for the 1.5Hz - 10 Hz and 31.5 Hz - 40 Hz bands. Non-correlations (p > 0.05) are indicated by black markers with white borders.
Figure 4. Representational maps of time-independent PD correlations (pearson r) between
[image:6.595.198.552.488.664.2]paired sensors across hemispheres. Both the Living and Non-Living brains shared a de-gree of spatially clustered signal stability which was contingent, in both cases, upon frequency.
4. Discussion
The employment of a single test case representative of one population (a dead brain) compared to a case that is representative of another population (a living brain) might be considered anecdotal. However, this would not be the first instance in the history of neuroscience where a single case is representative. Classic examples include Broca’s pa-tient who demonstrated expressive aphasia and Alzheimer’s female papa-tient who exhi-bited the presenile manifestations of dementia. We suggest that the specific nature of the quantitative differences in power densities over different regions of the cerebrum and frequency bands in the present study may represent a real phenomenon separate and distinct from noise.
One of the advantages of physical sciences and quantitative measurements is that values can be obtained that reflect the phenomenon being studied. When the differenc-es between the total power (μV2·Hz−1) for the Living and Non-Living (dead) brain were
obtained, a significant energy was apparent. The square root of the sum of the products of the averaged μV2 per Hz multiplied by the numbers of 1 Hz integers within each
frequency band for each band shown in Figure 1A results in 78 μV for the band be-tween 1.5 Hz and 50 Hz.
When the differences for the powerful source from the 0.5 to 1.5 Hz band was added (26 μV), the Living brain was 104 μV higher over the 0.5 Hz to 50 Hz band compared to the dead brain. This would be similar to the transcerebral availability of 0.1 mV which is within the range of a miniature EPSP (Excitatory Postsynaptic Potential) [7]. Like photon measurements where direct photon counts are subtracted from background (dark) counts, this value could be considered as the actual phenomena when the dif-ferences between the two electrodynamic aggregates are obtained. Because the dead brain displayed effectively similar values to those from other brains in our library [2] [3] and the Living brain was representative of the data base from living populations, the quantitative value can be considered reliable.
If this assumption is valid, then the energy difference associated with “living and consciousness” relative to the “dead” organic substrate of fixed brains can be estimated. The product of 1.04·10−4 V and 1.6·10−19 A·s is 1.7·10−23 J for the aggregate of process
Mach’s principle indicates, any part of the Cosmos is determined by all of its parts [11], then some representations might be residual within the appropriately fixed cerebral matter. There is some experimental evidence [12] [13] that might support this inter-pretation. In other words, background electromagnetic fields likely interact with brain matter in non-random ways.
The Hameroff-Penrose model of consciousness assumes a pervasive physical force which orders molecular as well as other biologically-relevant events and which can be measured as changing brain states. There is evidence to suggest that human brains are influenced by subtle environmental factors including perturbations in the Earth’s elec-tromagnetic field [14]. Radiofrequency-induced calcium ion efflux has also been meas-ured in brain tissue [15]. Hinrikus et al. [16] demonstrated that microwave stimulation, known to induce vibration of charged particles and cellular membranes, produced in-creased EEG energy levels within human brains, particularly within the beta1 band. The effects were non-thermal. The observations presented here indicated a discrete energet-ic difference between pre- and post-mortem brains whenerget-ich was within error term of CBM. Our hypothesis requires further substantiation by independent observers with similar or greater resources. The important discovery presented here is that modern electrophysiological technology and statistical methods might reveal hidden relation-ships that previously could not be systematically examined.
Several models and calculations have indicated the pervasiveness of a physical sub-strate to Hameroff and Penrose’s depiction of consciousness would require a universal integrator. The most likely candidate is the neutral hydrogen line or precision frequen-cy of the hydrogen atom which constitutes about 90% of the universe [17]. When the living-dead brain difference value of 1.7·10−23 J for the energy difference from the
elec-trodynamics we measured here is multiplied by the hydrogen frequency (1.42·109 s−1),
the result is ~1.2·10−14 W. When this power is divided by typical estimates of the
cere-bral cortical area [18], which is in the order of 10−2 m2, the flux power density is 10−12
W·m−2.
Approximately one picoWatt per meter squared is the consistent value for photon flux density measured by many researchers as the central value from living systems that include bacteria, cells, hippocampal slices, and whole brain sections [19] [20]. The po-tential connection to cognition was reported by Dotta et al. [21] who instructed volun-teers who were sitting in very dark rooms to think about white light or mundane idea-tion over several trials. Photonic energy was measured either as flux density by analo-gue photomultiplier tubes or numbers of photons by digital photomultiplier units placed approximately 15 cm from the right hemisphere at the level of the temporal lobe. The quantitative relationships between this magnitude of photon flux density and ener-gies intrinsic to action potentials and related physical substrates to “consciousness” have been consistently convergent [22].
When the subjects were engaging in imagery and imagination, the increased output of photon flux density from the right hemisphere was ~10−12 W·m−2. The magnitude of
the gradient of photon emissions from the human brain were temporally coupled to mediation through the thin (400 to 800 nm) axons within the corpus callosum. Al-though we would expect substantial complexity in the physical substrates of the living human brain and consciousness, the fact that quantitative values for the simple differ-ence between the living brain and the dead brain can be measured so simply may open new perspectives.
As with all case studies, the intrinsic limitation is one of generalization. It is unclear whether other brains of equivalent features would produce similar results, though our experiments with coronal slices have produced reliable results across specimens. One experiment, which would serve as verification of our measurements and provide a de-tailed understanding of the intermediates between the living and post-mortem brain states presented here, would involve the measurement of fresh human brains after au-topsy with subsequent longitudinal measures including data collection post-fixation. We do not possess the facilities or equipment to conduct the serial measurements on fresh cadavers, though human brains can be substituted by animal models assuming common mechanisms.
References
[1] Rouleau, N. and Persinger, M.A. (2015) Enhancement of Theta and Gamma Activity Power within Fixed Sections of Human Brains Stimulated by Sean Harribance’s Electroencephalo-graphic Configuration: Is He Equivalent to a “Universal Donor” for Entanglement? Neu-roQuantology, 13, 384-398. http://dx.doi.org/10.14704/nq.2015.13.4.886
[2] Rouleau, N. and Persinger, M.A. (2016) Differential Responsiveness of the Right Parahip-pocampal Region to Electrical Stimulation in Fixed Human Brains: Implications for His-torical Surgical Stimulation Studies? Epilepsy & Behavior, 60, 181-186.
http://dx.doi.org/10.1016/j.yebeh.2016.04.028
[3] Rouleau, N., Lehman, B. and Persinger, M.A. (2016) Focal Attenuation of Specific Elec-troencephalographic Power over the Right Parahippocampal Region during Transcerebral Copper Screening in Living Subjects and Hemispheric Asymmetric Voltages in Fixed Brain Tissue. Brain Research, 1644, 267-277. http://dx.doi.org/10.1016/j.brainres.2016.05.034
[4] Persinger, M.A., Dotta, B.T., Karbowski, L.M. and Murugan, N.J. (2015) Inverse Relation-ship between Photon Flux Densities and Nanotesla Magnetic Fields over Cell Aggregates: Quantitative Evidence for Energetic Conversion. FEBS Open Bio, 5, 413-418.
http://dx.doi.org/10.1016/j.fob.2015.04.015
[5] Crosby, E.C., Humphrey, T. and Lauer, E.W. (1962) Chapter 7 Telecephalon, Part 1—Gross Structure of the Telencephalon, Correlative Anatomy of the Nervous System. Macmillan, New York, 343-355.
[6] Saroka, K.S., Vares, D.E. and Persinger, M.A. (2016) Similar Spectral Power Densities within the Schumann Resonance and a Large Population of Quantitative Electroencephalo-graphic Profiles: Supportive Evidence for Koenig and Pobachenko. PloS ONE, 11, e0146595. http://dx.doi.org/10.1371/journal.pone.0146595
[7] Suzue, T., Wu, G.B. and Furukawa, T. (1987) High Susceptibility to Hypoxia of Afferent Synaptic Transmission in the Goldfish Sacculus. Journal of Neurophysiology, 58, 1066- 1079.
4080 Mc/s. The Astrophysical Journal, 142, 419-421. http://dx.doi.org/10.1086/148307
[9] Hameroff, S. and Penrose, R. (1996) Orchestrated Reduction of Quantum Coherence in Brain Microtubules: A Model for Consciousness. Mathematics and Computers in Simula-tion, 40, 453-480. http://dx.doi.org/10.1016/0378-4754(96)80476-9
[10] Hameroff, S. and Penrose, R. (2014) Consciousness in the Universe: A Review of the “OrchOR” Theory. Physics of Life Reviews, 11, 39-78.
http://dx.doi.org/10.1016/j.plrev.2013.08.002
[11] Singh, J. (1961) Great Ideas and Theories of Modern Cosmology. Dover, New York. [12] Costa, J.N. and Persinger, M.A. (2016) A Possible Flux Density Value of 10−12 W·m−2 for
“Spontaneous” Photon Emissions in Fixed Human Brain Tissue: Was Spinoza Correct? Re-search in Neuroscience, 5, 10-14.
[13] Persinger, M.A. (2013) Experimental Evidence that Hubble’s Parameter Could Be Reflected in Local Physical and Chemical Reactions: Support for Mach’s Principle of Imminence of the Universe. International Letters of Chemistry, Physics and Astronomy, 16, 86-92.
http://dx.doi.org/10.18052/www.scipress.com/ILCPA.16.86
[14] Allahverdijev, A.R., Babayev, E.S., Khalilov, E.N. and Gahramanova, N.N. (2001) Possible Space Weather Influence on Functional Activity of the Human Brain. Proceedings of Space Weather Workshop: Looking towards a European Space Weather Programme, Noordwijk, 17-19 December 2001, 17-19.
[15] Blackman, C.F., Elder, A., Weil, C.M., Benane, S.G., Eichinger, D.C. and House, D.E. (1979) Induction of Calcium-Ion Efflux from Brain Tissue by Radio-Frequency Radiation: Effects of Modulation Frequency and Field Strength. Radio Science, 14, 93-98.
http://dx.doi.org/10.1029/RS014i06Sp00093
[16] Hinrikus, H., Bachmann, M., Tomson, R. and Lass, J. (2005) Non-Thermal Effect of Mi-crowave Radiation on Human Brain. Environmentalist, 25, 187-194.
http://dx.doi.org/10.1007/s10669-005-4282-x
[17] Cameron, A.G.W. (1973) Abundances of the Elements in the Solar System. Space Science Reviews, 15, 121-146. http://dx.doi.org/10.1007/bf00172440
[18] Van Essen, D.C. and Drury, H.A. (1997) Structural and Functional Analyses of Human Ce-rebral Cortex Using a Surface-Based Atlas. The Journal of Neuroscience, 17, 7079-7102. [19] Gurwitsch, A.A. (1988) A Historical Review of the Problem of Mitogenetic Radiation.
Ex-perientia, 44, 545-550. http://dx.doi.org/10.1007/bf01953301
[20] Persinger, M.A. (2016) Spontaneous Photon Emissions in Photoreceptors: Potential Con-vergence of Arrhenius Reactions and the Latency for Rest Mass Photons to Accelerate to Planck Unit Energies. Journal of Advances in Physics, 11, 3529-3537.
[21] Dotta, B.T., Saroka, K.S. and Persinger, M.A. (2012) Increased Photon Emission from the Head while Imagining Light in the Dark Is Correlated with Changes in Electroencephalo-graphic Power: Support for Bókkon’s Biophoton Hypothesis. Neuroscience Letters, 513, 151-154. http://dx.doi.org/10.1016/j.neulet.2012.02.021
[22] Persinger, M.A. (2015) The Prevalence and Significance of ~10−20 J and ~10−12 W·m−2 as
Convergent/Divergent Nodal Units In the Universe. International Letters of Chemistry, Physics and Astronomy, 61, 94-100.
http://dx.doi.org/10.18052/www.scipress.com/ILCPA.61.94
Submit or recommend next manuscript to SCIRP and we will provide best service for you:
Accepting pre-submission inquiries through Email, Facebook, LinkedIn, Twitter, etc. A wide selection of journals (inclusive of 9 subjects, more than 200 journals)
Providing 24-hour high-quality service User-friendly online submission system Fair and swift peer-review system
Efficient typesetting and proofreading procedure
Display of the result of downloads and visits, as well as the number of cited articles Maximum dissemination of your research work