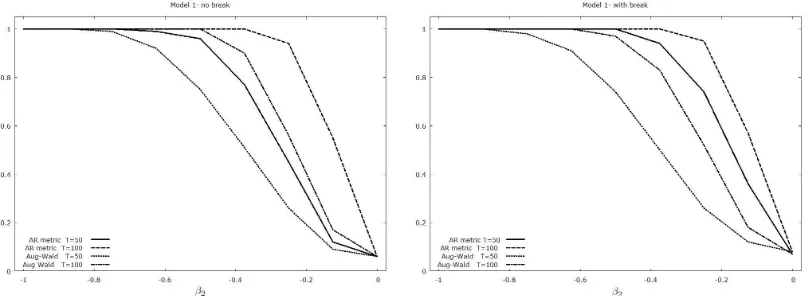
Testing for non causality by using the Autoregressive Metric
Full text
Figure


Related documents
Two Stage Robust Ridge Estimators based on robust estimators M, MM, S, LTS are examined in the presence of autocorrelation, multicollinearity and outliers
By the other side, the classification of swollen head syndrome as derivate from pathogenic clonal groups (Group D), and the high frequency of virulence related genes among these
The analysis is based on an analytical framework that combines the classical supermultiplier demand led growth model with the hypothesis that the balance of
The limited availability of studies evaluating long-term implant survival and existing concerns with regard to increased wear rates and aseptic loosening, leads to the conclusion
He ensured that climate change risk will be high on the fund’s agenda, but also stressed that the Norwegian Government Pension Fund Global is a financial investor and not a
Table Mountain National Park (TMNP) was established eight years ago when land and personnel were transferred from the City of Cape Town to SANParks.. The TMNP is the
instance Benmelech et al. Overall and partly due to data availability the findings on the effects of securitization remain ambiguous and centered in the United States. In this
We again examine several incentives aimed at increasing cybersecurity: (i) network provider liability on economic losses caused by cybersecurity attacks on network users,