Study of
12
CC Collisions at 4.5 A GeV to Define Centrality
Z. Wazir1*, A. Rauf2, Z. Hussain1, M. A. Rafih Amer1, S. Ullah2, R. Nawaz2, K. Ullah2, G. Sughra1, W. A. Syed2, M. Tufail1
1Department of Basic Sciences, Riphah International University, Islamabad, Pakistan 2Department of Physics, International Islamic University, Islamabad, Pakistan
Email: *[email protected]
Received April 24, 2013; revised May 30, 2013; accepted July 4, 2013
Copyright © 2013 Z. Wazir et al. This is an open access article distributed under the Creative Commons Attribution License, which permits unrestricted use, distribution, and reproduction in any medium, provided the original work is properly cited.
ABSTRACT
Using a statistical method which is based on random matrix theory, the results for the nearest-neighbor energy spacing distributions E(S) obtained from experimental as well as from computational data have been selected for review study. The obtained results confirm that the energy spacing correlation between secondary charged particles depends upon the charged particles multiplicity and central collisions are also associated with charged particles multiplicity.
Keywords: Random Matrix Theory; Nearest-Neighbor Energy Spacing Distributions; Spacing Correlations; Central Collisions; Charged Particles Multiplicity
1. Introduction
The creation of new phases of strongly interacting matter is the most interesting area of research for physicist for last many years. Physicists are interested in studying characteristics of newly formatting matter under extreme conditions [1-7]. One way to create these new phases is the heavy ion collision at relativistic and ultra relativistic energies. We are interested in centrally dependence of hadron—nucleus and nucleus—nucleus collisions. These experiments indicate the regime change at some values of the centrality as some critical phenomena. If the re- gime change observed in the different experiments takes place unambiguously twice, this would be the most direct experimental evidence to a phase transition from had- ronic matter to a phase of deconfined quarks and gluons [1-7]. After point of regime change the saturation is ob- served. The simple models cannot explain the effect.
To trace anticipated order of the phase evolution, for example, with increase of the baryon density, one analy- ses various characteristics of particle production at nu- clear-nuclear collisions depending on the centrality of collisions [8-13]. However, there is an ongoing discus- sion about how to define the centrality experimentally [1-13]. For instance, in various experiments the centrality is defined as a number of protons, projectile and target fragments, slow particles, all particles, as the energy flow of the particles with emission angles equal 0˚ or 90˚, etc.
[1-10]. Among the most popular approaches, based on geometrical picture, is a Glauber modeling which con- tains some theoretical approximations [14]. This ap- proach enables one to establish approximately the cen- trality with the aid of the impact parameter b and the multiplicity of identified secondary charged particles in experiments. Note, in this case, however, there is a model dependent definition of the centrality. Evidently, the ab- sence of an unambiguous criterion for the centrality may significantly affect the interpretation of experimental results and, therefore, hide a true signal on the onset of a new phase of the hadronic matter. In a preliminary report [15] it is suggested that tools from Random Matrix The- ory (RMT) [16-22] might be useful in illuminating the presence of correlations in the spectral (momentum) dis- tribution of secondary particles produced in nucleus- nucleus collisions at high energy [18-22]. It is notewor- thy that during the last twenty years the RMT grew into the powerful new statistical theory of fluctuations in a variety of physical problems [19-22]. In various fields, the Dyson-Mehta statistical measures are most often used to quantify a system’s correlations and to determine what information the fluctuations contain. These measures do not depend on the background of measurements and used in the context of RMT give universal forms depending only on the fundamental symmetries preserved [19-22]. Their only requirement is that local mean densities (or secular behaviors) be understood and their effects be removed. Furthermore, a change of fluctuation properties
of a system under consideration, induced by a change of its symmetry properties, can be detected by the RMT tools unambiguously. Therefore these tools could provide a way of detecting the transition between different phases (with different fluctuation properties) of strongly inter-acting matter. Evidently, that the energy of secondary particles produced in nucleus-nucleus collisions at high energies is given by continuous distributions. Since in each event only a finite number of particles are emitted, the discreteness naturally comes in the analysis of data [19,22]. The average number of particles per unit of en-ergy can change with increase (decrease) the absolute value of the energy and its direction in each event. How-ever; it is always possible to define regions where the mean particle density is approximately a constant. On the other hand, the distance between two successive particles can fluctuate differently in different energy windows. And this characterizes the local fluctuation properties of the system. The astonishing thing is that the fluctuating properties quite different systems are determined only by over-all symmetries of system [17]. This fact provides the basis for application of the RMT tools for analysis of nucleus-nucleus collision data at high energies [15-22].
Indeed, one can find a good agreement between the results obtained in this way and a standard analysis based on the method of effective mass spectra and two-pair correlation function often used in high energy physics [18]. The purpose of the present review is to discuss a novel criterion for the centrality of collision, using a rig-orous mathematical framework of the RMT [18-22]. Sec-tion 2 briefly reviews how to detect the manifestaSec-tion of correlations with the aid of nearest-neighbor spacing en-ergy distribution (NND) from the data obtained in light nuclei collisions in Dubna Experiments. Section 3 is de-voted to determination of the centrality of the nucleus- nucleus collisions with the aid of the NND. The main conclusions are summarized in Section 4.
2. Basic: Nearest-Neighbor Energy Spacing
Distribution
The experimental data [23-25] that have been obtained from the 2-m propane bubble chamber of the Laboratory of High Energy, JINR have been used. In this experiment, there are 37792 12CC interaction events at energy of 4.5
A GeV (for greater discussion of the details see [23-26]) containing 7740 events with more than ten tracks of charged particles.
In general [18-22], this procedure does not involve any uncertainty or spurious contributions and deals with a direct processing of physical data.
One can recall that the RMT theory [14-16] deals with the Hamiltonian that belongs to an ensemble of random matrices that are consistent with the fundamental
sym-metries of the system. In particular [15-22], since the nuclear interaction preserves time-reversal symmetries, the relevant ensemble is the Gaussian Orthogonal En-semble (GOE). When the time-reversal symmetry is broken one can apply the Gaussian Unitary Ensemble (GUE). The GOE and GUE correspond to ensembles of real symmetric matrices and of Hermitian matrices, re-spectively. Besides these general symmetry considera-tions, there is no need in other properties of the system under consideration.
If the “events” [18-22] are independent, i.e., correla-tions in the system under consideration are absent, the form of the histogram must follow E(S) = exp(−S) known as the Poisson density. The Poisson spectrum corresponds to the dominance of many crossings between different energies. On the other hand, if the levels are repelled, the density is approximately given by the
Wigner surmise form E(S) = π exp π 2 2S 4S
for the
GOE. In turn, the crossings are usually observed when there is no mixing between states that are characterized by different good quantum numbers, while the anti crossings signal about a strong mixing due to a perturba-tion brought about by either external or internal sources[27]. In other words, any correlations that pro-duce the deviation from the regular pattern (Poisson dis-tribution): production of a collective state (resonance), or some structural changes in the system under considera-tion would be uniquely identified from the change of the histogram shape [27].
To clearly recognize correlations the total set of spac-ing’s {Si} has been divided into three sets, in
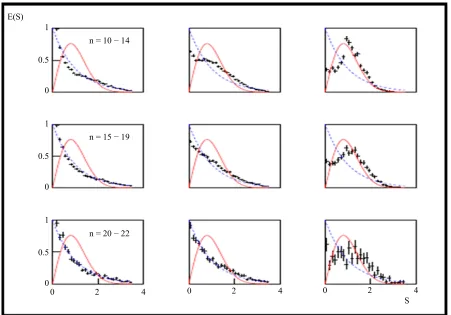
correspon-dence with three regions of the measured energies: a) 0.1 < |E| < 1.18 GeV(region I); b) 1.18 < |E| < 4.0 GeV (re-gion II); c) 4.0 < |E| < 8.5 GeV (re(re-gion III) (see Figure 1). The region boundaries were determined with the re-quirement that the shape of the spacing density E(S) does not change in the region under consideration [19-22]. Therefore, in the present review only the total near-est-neighbor energy spacing distribution, related to all charged secondary particles is considered.
To precede further additionally the events have been separated into three groups: 1) the events with n = 10 − 14 secondary charge particles; 2) the events with n = 15 − 19 secondary charge particles; 3) the events with n = 20 − 22 secondary charge particles. In this case the sepa-ration was also done according to the criteria discussed above [19-22].
n = 20 − 22 n = 15 − 19 n = 10 − 14 E(S)
1
0.5
0
1
0.5
0
1
0.5
0
0 2 4 0 2 4 0 2 4
S
Figure 1. (Color online) the experimental (data related to all charged secondary particles) nearest-neighbor energy spacing distribution (histogram) E(S) for different regions of measured energies: the first column corresponds to 0.1 < |E| < 1.18 GeV; the second column corresponds to 1.18 < |E| < 4.0 GeV; the third column correspond to 4.0 < |E| < 8.5 GeV. The NND distri-bution for different multiplicities n: the top row corresponds to n = 10 − 14; the middle row corresponds to n = 15 − 19: the bottom row corresponds to n = 20 − 22. The Poisson and the Wigner surmise distributions are connected by dashed and solid lines, respectively.
creased, which can be associated with the onset of the central collisions.
found in virtue of the RMT analysis, owes their origin to the protons produced as a result of decays of well known ∆++—isobars with masses
m∆++ = 1.232 and 1.650
(GeV/c2). The presence of the sharp peak in the third
interval 4.0 < |E| < 8.5 GeV (the region III) can be attrib-uted to the interaction between stripping protons in the final state, which dominates in the peripheral collisions which have been seen in P(S) distributions[19-22].
3. Determination of the Centrality Windows
To shed light on the production of the secondary charged particles, Dubna Cascade Model [1,21] is used which is the host of models those are proposed to explain the gen- eral features of relativistic nucleus-nucleus collisions. Dubna Cascade Model (DCM) is the most popular model. It is an approach based on simulation (Monte-Carlo tech- niques) and applied to situation where multiple scattering is important. In the simplest approach, it is assumed [21] that due to the interaction of a projectile hadron with one of the target nucleons the creation of a new particle takes place. The participating target nucleon accepts momen- tum and begins to move in the nucleus. All moving (cas- cade) particles can interact with other nuclear nucleons to produce new particles or suffer elastic rescattering. Therefore, cascade reproduction of moving particles is assumed. The interactions between cascade particles are Indeed, one can find that strong correlations are
[image:3.595.72.523.85.400.2]omitted as a rule. The process continues until all moving particles either leave the nucleus or are absorbed. In the case of (A + A) collisions, it is assumed that cascade particles can interact with projectile and target nucleons. Due to analysis fast particles and correlations between slow and fast particles DCM [28-33] was recognized as the best model applied in the intermediate energy physics [34,35]. Simulating the secondary charged particles pro- duction in 12C + 12C collisions at energy of 4.5A GeV,
the same procedure as for the analysis of experimental data was applied. Surprisingly, the results obtained with the aid of the DCM nicely reproduce the tendency ob- served for the experimental data. The model results as shown in Figure 2 confirm the existing of some peaks in the region II and their transformation to the Wigner dis-tribution in the region III. Evidently, the model results demonstrate the existing of some non-trivial non-kine- matic correlations for the secondary charged particles in the regions II and III.
This fact provides a hope that the RMT could be use-ful for analysis of experimental results obtained in heavy ion reactions at high energies [15-22].
This analysis provides the basis to identify the critical multiplicity that would signal on the onset of central col-lisions [19-22]. To this aim the DCM code [36], is used
which is most suitable for the data obtained in the Dubna experiment.
4. Summary
Using the experimental data on 12CC interaction events at
[image:4.595.65.529.399.718.2]energy of 4.5 A GeV obtained from the 2-m propane bubble chamber of the Laboratory of High Energy, JINR, the energy distribution of the secondary charged particles produced in this reaction is analyzed and compared with the momentum distributions [19-22]. To this aim the NNDs are calculated in three intervals of the energy dis-tributions: 0.1 < |E| < 1.18 GeV; 1.18 < |E| < 4.0 GeV; 4.0 < |E| < 8.5 GeV similarly to momentum distributions in [19-22]. To establish the connection between the NNDs and the onset of region of central collisions em- ployed the DCM code. The results obtained with version of the DCM code evidently demonstrate that the NND enable one to detect the presence of correlations, brought about by various new mechanisms. Based on these re- sults, one can propose novel criteria to define the central- ity of the nucleus-nucleus collisions, using the NNDs for different multiplicities. In turn, the centrality of nu- cleus-nucleus collisions is associated with the absence of correlations.
n = 23 − 29 n = 17 − 22 n = 10 − 16 E(S)
1
0.5
0
1
0.5
0
1
0.5
0
0 2 4 0 2 4 0 2 4
S
5. Acknowledgements
We acknowledge Riphah Academy of Research & Edu-cation (RARE), Riphah International University Islama-bad, Pakistan for financial support.
REFERENCES
[1] Z. Wazir, M. K. Suleymanov, O. B. Abdinov, E. U. Khan, M. Q. Haseeb, M. Ajaz, K. H. Khan and Sh. Ganbarova, Azerbaijan Journal of Physics (Fizika), Vol. 16, 2010, pp. 75-78.
[2] Z. Wazir, M. K. Suleymanov, O. B. Abdinov, E. U. Khan, M. Q. Haseeb, M. Ajaz, K. H. Khan and Sh. Ganbarova, Azerbaijan Journal of Physics (Fizika), Vol. 16, 2010, pp. 85-88.
[3] K. H. Khan, M. K. Suleymanov, O. B. Abdinov, Z. Wazir, E. U. Khan, M. Q. Haseeb, M. M. Ajaz and Sh. Ganba- rova, Azerbaijan Journal of Physics (Fizika), Vol. 16, 2010, pp. 474-477.
[4] B. Z. Belashev, M. K. Suleymanov, S. Vokal, J.Vrlakova, M. Ajaz, A. Zaman, K. H. Khan and Z. Wazir, Chinese Physics C, Vol. 35, 2011, pp. 1095-1099.
doi:10.1088/1674-1137/35/12/003
[5] M. K. Suleymanov, E. U. Khan, K. Ahmed, M. Q. Ha-seeb, F. Tahir, Y. H. Huseynaliyev, M. Ajaz, K. H. Khan and Z. Wazir, Indian Journal of Physics, Vol. 85, 2011, pp. 1047-1050. doi:10.1007/s12648-011-0128-1
[6] M. Ajaz, M. K. Suleymanov, O. B. Abdinov, A. Zaman, K. H. Khan, Z. Wazir and Sh. Khalilova, Azerbaijan Journal of Physics (Fizika), Vol. 17, 2011, pp. 17-20. [7] M. K. Suleymanov, E. U. Khan, K. Ahmed, M. Q. Ha-
seeb, F. Tahir, Y. H. Huseynaliyev, M. Ajaz, K. H. Khan and Z. Wazir, International Journal of Modern Physics, Vol. A24, 2009, pp. 544-548.
doi:10.1142/S0217751X09044036
[8] J. Aichelin and K. Werner, Physical Review, Vol. C79, 2009, Article ID: 064907.
doi:10.1103/PhysRevC.79.064907
[9] I. C. Arsene, Journal of Physics G: Nuclear and Particle Physics, Vol. 36, 2009, Article ID: 064004.
[10] H. Masui, The European Physical Journal, Vol. C62, 2009, p. 169.
[11] R. A. Soltz, R. J. Newby, J. L. Klay, M. Heffner, L. Beaulieu, T. Lefort, K. Kwiatkowski and V. E. Viola, Physical Review, Vol. C79, 2009, Article ID: 034607. doi:10.1103/PhysRevC.79.034607
[12] T. Gburek, Journal of Physics G: Nuclear and Particle Physics, Vol. 35, 2008, Article ID: 104131.
[13] H. Masui, Journal of Physics G: Nuclear and Particle Physics, Vol. 36, 2009, Article ID: 064047.
[14] M. L. Miller, K. Reygers, S. J. Sanders and P. Steinberg, Annual Review of Nuclear and Particle Science, Vol. 57, 2007, p. 205.
doi:10.1146/annurev.nucl.57.090506.123020
[15] E. I. Shahaliev, R. G. Nazmitdinov, A. A. Kuznetsov, M. K. Syleimanov and O. V. Teryaev, Physics of Atomic Nu- clei, Vol. 69, 2006, p. 142.
doi:10.1134/S1063778806010182
[16] T. A. Brody, J. Flores, J. B. French, P. A. Mello, A. Pan-dy and S. S. M. Wong, Reviews of Modern Physics, Vol. 53, 1981, p. 385. doi:10.1103/RevModPhys.53.385 [17] M. L. Mehta, “Random Matrices,” 3rd Edition, Elsevier,
Amsterdam, 2004.
[18] R. G. Nazmitdinov, E. I. Shahaliev, M. K. Syleimanov, and S. Tomsovic, Physical Review, Vol. C79, 2009, Arti- cle ID: 054905. doi:10.1103/PhysRevC.79.054905 [19] Z. Wazir, Chinese Physics Letters, Vol. 28, 2011, Article
ID: 092503. doi:10.1088/0256-307X/28/9/092503 [20] Z. Wazir, Chinese Physics C, Vol. 34, 2010, pp. 1593-
1597. doi:10.1088/1674-1137/34/10/008
[21] Z. Wazir, R. G. Nazmitdinov, E. I. Shahaliev and M. K. Suleymanov, Chinese Physics C, Vol. 34, 2010, pp. 1076- 1081. doi:10.1088/1674-1137/34/8/007
[22] Z. Wazir, et al., Modern Physics Letter A, Vol. 27, 2012, Article ID: 1250090.
[23] O. Balea, et al., Physical Letters, Vol. B39, 1972, p. 571. doi:10.1016/0370-2693(72)90347-4
[24] N. Akhababian, et al., JINR Report, No. 1-12114, Dubna, 1979.
[25] D. D. Armutliiski, et al., Yadernaya Fizika, Vol. 45, 1987, p. 1047.
[26] H. N. Agakishiyev, et al., Zeitschrift für Physik C Parti- cles and Fields, Vol. 27, 1985, p. 177.
[27] H. A. Weidenm¨uller and G. E. Mitchell, Reviews of Modern Physics, Vol. 81, 2009, p. 539.
doi:10.1103/RevModPhys.81.539
[28] V. S. Barashenkov and V. D. Toneev, “Interaction of High Energy Particles and Atomic Nuclei with Nuclei,” Atomizadt, Moscow, 1972.
[29] N. W. Bertini, et al., Physical Review, Vol. C9, 1974, p. 522. doi:10.1103/PhysRevC.9.522
[30] N. W. Bertini, et al., Physical Review, Vol. C14, 1976, p. 590. doi:10.1103/PhysRevC.14.590
[31] J. P. Bondorf, et al., Physics Letters, Vol. 65B, 1976, p. 217.
[32] J. P. Bondorf, et al., Zeitschrift für Physik, Vol. A279, 1976, p. 385.
[33] V. D. Toneev and K. K. Gudima, Nuclear Physics, Vol. A400, 1983, p. 173. doi:10.1016/0375-9474(83)90433-5 [34] S. G. Mashnik, “Intermediate Energy Nuclear Data: Odels
and Codes,” Proceedings of a Specialists Meeting, Paris, 1994, p. 107.
[35] M. B. Blann, H. Gruppelaar, P. Nagel and J. Rodens, “International Code Comparison for Intermediate Energy Nuclear Data,” NEA, OECD, Paris, 1994.
![Figure 2. (Color online) similar to Figure 1, simulated with the aid of the DCM code [36]](https://thumb-us.123doks.com/thumbv2/123dok_us/7823528.731816/4.595.65.529.399.718/figure-color-online-similar-figure-simulated-dcm-code.webp)
